Transcription
Lab Exercise – TCPObjectiveTo see the details of TCP (Transmission Control Protocol). TCP is the main transport layer protocol usedin the Internet.Step 1: Open the TraceOpen the trace file here: e-tcp.pcapFigure 6: Trace file1
Step 2: Inspect the TraceSelect a long packet anywhere in the middle of your trace whose protocol is listed as TCP. Expand the TCPprotocol section in the middle panel (by using the “ ” expander or icon). All packets except the initialHTTP GET and last packet of the HTTP response should be listed as TCP. Picking a long packet ensuresthat we are looking at a download packet from the server to your computer. Looking at the protocol layers, you should see an IP block before the TCP block. This is because the TCP segment is carried in an IP.We have shown the TCP block expanded in our figure.You will see roughly the following fields: First comes the source port, then the destination port. This is the addressing that TCP adds beyond the IP address. The source port is likely to be 80 since the packet was sent by a web serverand the standard web server port is 80.Then there is the sequence number field. It gives the position in the byte stream of the first payload byte.Next is the acknowledgement field. It tells the last received position in the reverse byte stream.The header length giving the length of the TCP header.The flags field has multiple flag bits to indicate the type of TCP segment. You can expand it andlook at the possible flags.Next is a checksum, to detect transmission errors.There may be an Options field with various options. You can expand this field and explore if youwould like, but we will look at the options in more detail later.Finally, there may be a TCP payload, carrying the bytes that are being transported.As well as the above fields, there may be other informational lines that Wireshark provides to help youinterpret the packet. We have covered only the fields that are carried across the network.2
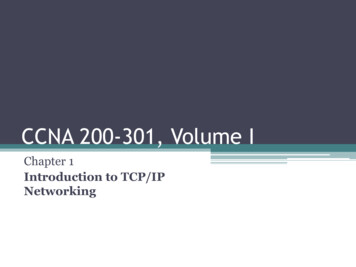
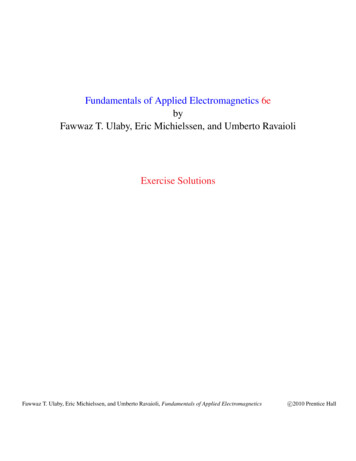
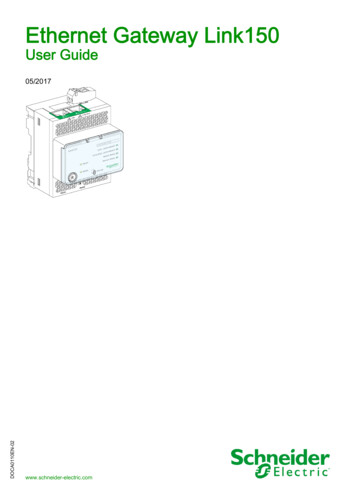
Step 3: TCP Segment StructureFigure 7: Structure of a TCP segmentThis drawing differs from the text drawing in the book in only minor respects: The Header length and Flags fields are combined into a 2-byte quantity. It is not easy to determine their bit lengths with Wireshark. The Urgent Pointer field is shown as dotted. This field is typically not used, and so does not showup in Wireshark and we do not expect you to have it in your drawing. You can notice its existence in Wireshark, however, by observing the zero bytes in the segment that are skipped overas you select the different fields. The Options field is shown dotted, as it may or may not be present for the segments in yourtrace. Most often it will be present, and when it is then its length will be a multiple of four bytes. The Payload is optional. It is present for the segment you viewed, but not present on an Ackonly segment, for example. Note, you can work out sizes yourself by clicking on a protocol block in the middle panel (theblock itself, not the “ ” expander). Wireshark will highlight the corresponding bytes in the packetin the lower panel, and display the length at the bottom of the window. You may also use theoverall packet size shown in the Length column or Frame detail block. See below where a TCPpacket of length 66 is highlighted.Figure 8: Examining the size of segments3
Step 4: TCP Connection Setup/TeardownThree-Way HandshakeTo see the “three way handshake” in action, look for a TCP segment with the SYN flag on. These are up atthe beginning of your trace, and the packets that follow it (see below).Figure 9: Selecting a TCP segment with SYN flagThe SYN flag is noted in the Info column. You can also search for packets with the SYN flag on using thefilter expression “tcp.flags.syn 1”. (See below)Figure 10: Selecting a TCP segment with SYN flag onA “SYN packet” is the start of the three-way handshake. In this case it will be sent from your computerto the remote server. The remote server should reply with a TCP segment with the SYN and ACK flagsset, or a “SYN ACK packet”. On receiving this segment, your computer will ACK it, consider the connection set up, and begin sending data, which in this case will be the HTTP request.4
Step 5: TCP Connection Setup/TeardownNext, we wish to clear the display filter tcp.flags.syn 1 so that we can once again see all the packets inour original trace. Do this by clearing the display filter as shown below.Figure 11: Clearing the display filter TCP segment with SYN flag onIf you do this correctly, you should see the full trace. We are most interested in the first three packets.Figure 12: Viewing the complete trace5
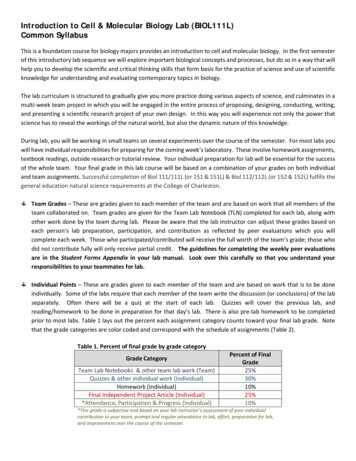
Below is a time sequence diagram of the three-way handshake in your trace, up to and including the firstdata packet (the HTTP GET request) sent by ‘your computer’ when the connection is established. Asusual, time runs down the page, and lines across the page indicate segments.Figure 13: Time sequence diagram for the TCP three-way handshakeThere are several features to note: The initial SYN has no ACK number, only a sequence number. All subsequent packets have ACKnumbers.The initial sequence numbers are shown as zero in each direction. This is because our Wiresharkis configured to show relative sequence numbers. The actual sequence number is some large 32bit number, and it is different for each end.The ACK number is the corresponding sequence number plus 1.Our computer sends the third part of the handshake (the ACK) and then sends data right away ina different packet. It would be possible to combine these packets, but they are typically separate (because one is triggered by the OS and one by the application).For the Data segment, the sequence number and ACK stay with the previous values. The sequence number will advance as the sender sends more data. The ACK number will advance asthe sender receives more data from the remote server.The three packets received and sent around 88ms happen very close together compared to thegap between the first and second packet. This is because they are local operations; there is nonetwork delay involved.The RTT is 88ms in our trace. If you use a local web server, the RTT will be very small, likely a fewmilliseconds. If you use a major web server that may be provided by a content distribution network, the RTT will likely be tens of milliseconds. If you use a geographically remote server, theRTT will likely be hundreds of milliseconds.6
Step 5: Connection OptionsAs well as setting up a connection, the TCP SYN packets negotiate parameters between the two endsusing Options. Each end describes its capabilities, if any, to the other end by including the appropriateOptions on its SYN. Often both ends must support the behavior for it to be used during data transfer.Common Options include Maximum Segment Size (MSS) to tell the other side the largest segment thatcan be received, and Timestamps to include information on segments for estimating the round trip time.There are also Options such as NOP (No-operation) and End of Option list that serve to format the Options but do not advertise capabilities. You do not need to include these formatting options in your answer above. Options can also be carried on regular segments after the connection is set up when theyplay a role in data transfer. This depends on the Option. For example: the MSS option is not carried oneach packet because it does not convey new information; timestamps may be included on each packetto keep a fresh estimate of the RTT; and options such as SACK (Selective Acknowledgments) are usedonly when data is received out of order.Our TCP Options are Maximum Segment Size, Window Scale, SACK permitted, and Timestamps. Each ofthese Options is used in both directions. There are also the NOP & End of Option List formatting options.Here is an example of a FIN teardown:Figure 14: Time sequence diagram for FIN teardownPoints to note: The teardown is initiated by the computer; it might also be initiated by the server. Like the SYN, the FIN flag occupies one sequence number. Thus, when the sequence number ofthe FIN is 192, the corresponding Ack number is 193. Your sequence numbers will vary. Our numbers are relative (as computed by Wireshark) butclearly depend on the resource that is fetched. You can tell that it is around 1 MB long. The RTT in the FIN exchange is like that in the SYN exchange, as it should be. Your RTT will varydepending on the distance between the computer and server as before.7
Step 6: FIN/RST TeardownFinally, the TCP connection is taken down after the download is complete. This is typically done with FIN(Finalize) segments. Each side sends a FIN to the other and acknowledges the FIN they receive; it is similar to the three-way handshake. Alternatively, the connection may be torn down abruptly when one endsends a RST (Reset). This packet does not need to be acknowledged by the other side.Below is a picture of the teardown in your trace, starting from when the first FIN or RST is issued untilthe connection is complete. It shows the sequence and ACK numbers on each segment.Figure 15: Time sequence diagram for RST teardownPoints to note: The teardown is initiated by the computer; it might also be initiated by the server. The teardown is abrupt – a single RST in this case, and then it is closed, which the other endmust accommodate. The sequence and Ack numbers do not really matter here. They are simply the (relativeWireshark) values at the end of the connection. Since there is no round trip exchange, no RTT can be estimated.8
Step 7: TCP Data TransferFor this part, we are going to launch an older version of Wireshark called Wireshark legacy. You do thisby selecting the Wireshark legacy application as follows.When it launches, you should open the trace-tcp file which is in your downloads folder from earlier.9
You should then be presented with the same trace-tcp as used previously in this exercise.The middle portion of the TCP connection is the data transfer, or download, in our trace. This is the mainevent. To get an overall sense of it, we will first look at the download rate over time.Under the Statistics menu select an “IO Graph” (as shown below).Figure 16: Opening an IO graphYou should end up with a graph like below. By default, this graph shows the rate of packets over time.You might be tempted to use the “TCP Stream Graph” tools under the Statistics menu instead. However,these tools are not useful for our case because they assume the trace is taken near the computer sending the data; our trace is taken near the computer receiving the data.Figure 17: The IO graph10
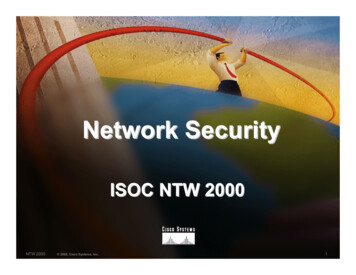
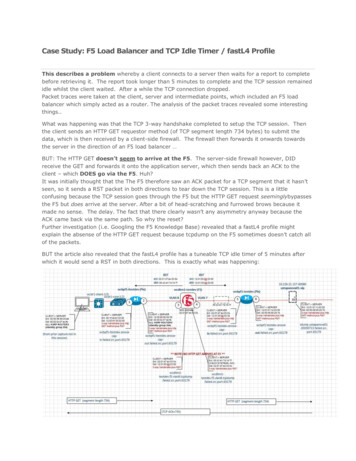
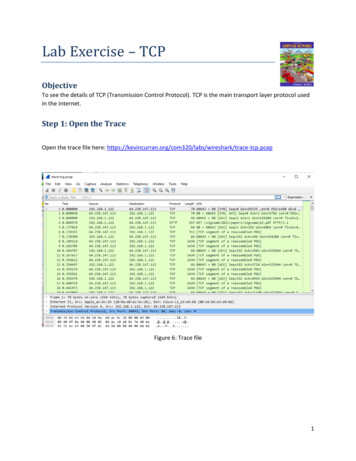
Now we will tweak it to show the download rate with the changes given below On the x-axis, adjust the tick interval and pixels per tick. The tick interval should be small enoughto see into the behavior over the trace, and not so small that there is no averaging. 0.1 secondsis a good choice for a several second trace. The pixels per tick can be adjusted to make thegraph wider or narrower to fill the window. Make this 10. See below. On the y-axis, change the unit to be Bits/Tick. The default is Packet/Tick. By changing it, we caneasily work out the bits/sec throughput by taking the y-axis value and scaling as appropriate,e.g., 10X for ticks of 0.1 seconds. Add a filter expression to see only the download packets. So far we are looking at all of the packets. Assuming the download is from the usual web server port of 80, you can filter for it with afilter of “tcp.srcport 80”. Don’t forget to press Enter, and you may need to click the“Graph” button to cause it to redisplay. To see the corresponding graph for the upload traffic, enter a second filter in the next box. Againassuming the usual web server port, the filter is “tcp.dstport 80”. After you press Enterand click the Graph button, you should have two lines on the graph.Our graph for this procedure is shown in the figure on next page. From it we can see the sample download rate quickly increase from zero to a steady rate, with a bit of an exponential curve. This is slowstart. The download rate when the connection is running is approximately 2.5 Mbps. The upload rate is asteady, small trickle of ACK traffic. Our download also proceeds fairly steadily until it is done. This is theideal, but many downloads may display more variable behavior if, for example, the available bandwidthvaries due to competing downloads, the download rate is set by the server rather than the network, orenough packets are lost to disrupt the transfer.Note, you can click on the graph to be taken to the nearest point in the trace if there is a feature youwould like to investigate.Try clicking on parts of the graph and watch where you are taken in the Wireshark trace window.11
Figure 16: TCP download rate over time via an IO graphInspect the packets in the download in the middle of your trace for these features: You should see a pattern of TCP segments received carrying data and ACKs sent back to theserver. Typically, there will be one ACK every couple of packets. These ACKs are called DelayedACKs. By delaying for a short while, the number of ACKs is halved.Since this is a download, the sequence number of received segments will increase; the ACKnumber of subsequently transmitted segments will increase correspondingly.Since this is a download, the sequence number of transmitted segments will not increase (afterthe initial get). Thus the ACK number on received segments will not increase either.Each segment carries Window information to tell the other end how much space remains in thebuffer. The Window must be greater than zero, or the connection will be stalled by flow control.Note the data rate in the download direction in packets/second and bits/second once the TCP connection is running well is 250 packet/sec and 2.5 Mbps.Our download packets are 1434 bytes long, of which 1368 bytes are the TCP payload carrying contents.Thus 95% of the download is content.The data rate in the upload direction in packets/second and bits/second due to the ACK packets is 120packets/sec and 60,000 bits/sec. We expect the ACK packet rate to be around half of the data packetrate for the typical pattern of one delayed ACK per two data packets received. The ACK bit rate will beat least an order of magnitude below the data bit rate as the packets are much smaller, around 60 bytes.The Ack number tells the next expected sequence number therefore it will be X plus the number of TCPpayload bytes in the data segment.12
Wireshark will highlight the corresponding bytes in the packet in the lower panel, and display the length at the bottom of the window. You may also use the overall packet size shown in the Length column or Frame detail block.