Transcription
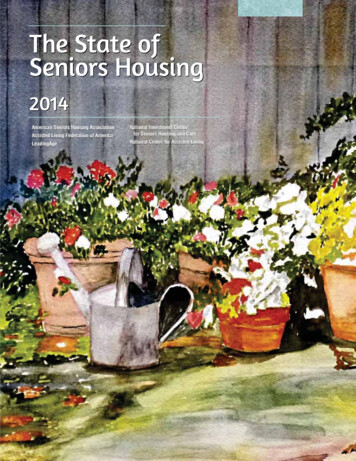
The State ofSeniors Housing2014American Seniors Housing AssociationAssisted Living Federation of AmericaNational Investment Centerfor Seniors Housing and CareLeadingAgeNational Center for Assisted Living
2014 All rights reserved. The text portions of this work may not be reproduced or transmitted in any form or by anymeans, electronic or mechanical, including photocopying, recording, or by information storage and retrieval system,without permission in writing from the publisher.American Seniors Housing Association // www.seniorshousing.org 250 per copy
The State ofSeniors Housing2014American Seniors Housing AssociationartworkAssisted Living Federation of AmericaNational Investment Centerfor Seniors Housing and CareLeadingAgeNational Center for Assisted LivingArtwork for The State of Seniors Housing 2014 has been created by seniors housingresidents. Special thanks to Laurie Rodman of Benchmark Senior Living, Paul Salais Jr.of LCS, and Julie McKowen of Senior Star for assistance with the artwork in this year’sState of Seniors Housing report.Cover art: Heritage of Green Hills David Lumb
Corporate SponsorsThe American Seniors Housing Association, Assisted Living Federation of America, LeadingAge,National Center for Assisted Living, and National Investment Center for Seniors Housing &Care gratefully acknowledge the generous support of the following companies who have helpedunderwrite the publication of The State of Seniors Housing 2014.sponsorsBrookdale Senior LivingCapital Senior LivingGrace ManagementHealth Care REITLCSPrudential Real Estate InvestorsRed Capital GroupSenior Housing Properties TrustSenior Lifestyle CorporationSenior Star
GRACEMANAGEMENT
mmary17MethodologyandData Analysis
18Terminology22Definitions /NomenclatureChaptersChapter 1Community Type and Unit Mix . . . . . . . . . . . . . . . . . . . . . . . . . . . . . . . . . . . . . . . . . . . . . . . 26Chapter 2Geographic Distribution of Properties and of Units . . . . . . . . . . . . . . . . . . . . . . . . . . . . . . . . 29Chapter 3Property Size . . . . . . . . . . . . . . . . . . . . . . . . . . . . . . . . . . . . . . . . . . . . . . . . . . . . . . . . . . . . . 32Chapter 4Age of Communities . . . . . . . . . . . . . . . . . . . . . . . . . . . . . . . . . . . . . . . . . . . . . . . . . . . . . . . 37Chapter 5Ownership Status . . . . . . . . . . . . . . . . . . . . . . . . . . . . . . . . . . . . . . . . . . . . . . . . . . . . . . . . . 39Chapter 6Primary Payment Plans and Fee Structures . . . . . . . . . . . . . . . . . . . . . . . . . . . . . . . . . . . . . 43Chapter 7Occupancy . . . . . . . . . . . . . . . . . . . . . . . . . . . . . . . . . . . . . . . . . . . . . . . . . . . . . . . . . . . . . . 46Chapter 8Resident Turnover . . . . . . . . . . . . . . . . . . . . . . . . . . . . . . . . . . . . . . . . . . . . . . . . . . . . . . . . . 49Chapter 9Financial Results . . . . . . . . . . . . . . . . . . . . . . . . . . . . . . . . . . . . . . . . . . . . . . . . . . . . . . . . . . 51Chapter 10“Same-Store” Analysis . . . . . . . . . . . . . . . . . . . . . . . . . . . . . . . . . . . . . . . . . . . . . . . . . . . . . 71Chapter 11Staffing Ratios and Labor Costs . . . . . . . . . . . . . . . . . . . . . . . . . . . . . . . . . . . . . . . . . . . . . . 74Chapter 12Other Key Cost Items . . . . . . . . . . . . . . . . . . . . . . . . . . . . . . . . . . . . . . . . . . . . . . . . . . . . . . 78Chapter 13Key Financial Performance Indicators . . . . . . . . . . . . . . . . . . . . . . . . . . . . . . . . . . . . . . . . . . 83Chapter 14Historical Performance of Key Financial Indicators . . . . . . . . . . . . . . . . . . . . . . . . . . . . . . . . 85Orchard Valley at Wilbraham Evelyn King
7AcknowledgmentsThe American Seniors Housing Association (ASHA), Assisted Living Federation of American(ALFA), LeadingAge, National Center for Assisted Living (NCAL), and National Investment Centerfor Seniors Housing & Care (NIC) wish to thank the numerous companies who submitted the datathat comprise the 2014 edition of The State of Seniors Housing.THE STATE OF SENIORSHOUSING TASK FORCEWe also thank the following individuals who continue to provide valuable assistance to the StateCOLLEEN BLUMENTHAL, MAI(Task Force Lead)HealthTrust, LLCSarasota, FLof Seniors Housing effort: Cindy Robinson of Brookdale Senior Living; John Getchey, Rich Hansen,Michelle Kelly, Derreck Shaw, Christian Sweetser and Rachel Watson of Health Care REIT; AlanPlush, MAI of HealthTrust, LLC; Stephen J. Maag, JD of LeadingAge; Biba Aidoo, Bill Kauffman,Beth Burnham Mace, Chris McGraw, and Sam Ross of National Investment Center for SeniorsHousing & Care; Jim Hands of Salem Equity; Holly Hoover and William Thomas of Senior Star;and Krystalle Campo of the American Seniors Housing Association.CHARLES W. HARRY, JR.National Investment Centerfor Seniors Housing & CareAnnapolis, MDCHARLES J. HERMAN, JR.Health Care REIT, Inc.Toledo, OHHARVEY SINGERREDMARK Real Estate DevelopmentEconomics and Market ResearchKapolei, HICrescent Point at Niantic Agnes Peckham
9IntroductionThe American Seniors Housing Association (ASHA), Assisted Living Federation of America(ALFA), LeadingAge, National Center for Assisted Living (NCAL), and National InvestmentCenter for Seniors Housing & Care (NIC), are pleased to announce that this year’s State of SeniorsHousing report reflects a sample of 2,131 market rate seniors housing properties — the largestnumber of properties in virtually every category, and the largest number of beds/units for whichwe have ever collected information.We have made significant progress improving the quality of the dataset by providing largeoperators the option of free data-mapping assistance so that most financial data can be submittedin formats they already use and by upgrading our Excel-based survey design.ASHA, ALFA, LeadingAge, NCAL, and NIC wish to thank the many companies who recognize thevalue and importance of participating in this data collection process. We also thank the members ofour State of Seniors Housing Task Force and others who continue to help improve the quality of thisresearch. We remain committed to making this annual collaborative report as useful and timely aspossible and welcome readers’ feedback.Our sincere thanks and appreciation to all who continue to support The State of Seniors Housing andshare our collective goal of providing America’s seniors with the highest quality housing and services.North Oaks Lynn PerlinFALL 2014DAVID S. SCHLESSPresidentAmerican Seniors Housing AssociationWashington, DCMARIBETH BERSANIInterim CEO & SVP of Public PolicyAssisted Living Federation of AmericaAlexandria, VAWILLIAM L. MINNIX, JR., D. MINPresident & CEOLeadingAgeWashington, DCDAVID KYLLOExecutive DirectorNational Center for Assisted LivingWashington, DCROBERT G. KRAMERPresidentNational Investment Centerfor Seniors Housing & CareAnnapolis, MD
Executive Summary10KEY FINDINGSThe State of Seniors Housing 2014 summarizes data collected from more than 2,000 seniors housingproperties comprising more than 250,000 units (or beds), located throughout the USA — the largestresponse sets in the report’s 20 year history. The survey data, collected during the first part of 2014,describe the performance results for the 12 months ending nearest to December 31, 2013. Whererequired, a randomized selection from the data submitted by larger operators was employed in thefinancial reporting, in order to prevent the results from being disproportionately impacted by a fewvery large providers.We believe that the response set includes almost one in every five of the US inventory ofprofessionally-managed seniors housing properties (excluding properties that are predominantlynursing homes, and excluding properties that are predominantly seniors apartments with few orno meals and services — neither of which property types were a focus of this study) and includes, inthose properties, almost one in five of the US investment-grade inventory of units.Surveys were received from a widespread range of respondents, leading us to believe that the resultsreported here are reliably representative of the “State of Seniors Housing” across the USA. Surveyswere received from:Q Most states in the contiguous USA (44 in total)Q Every region of the continental USAQ Properties in hundreds of separate US cities, towns, and metropolitan areasQ Properties ranging from quite small (a few dozens of units and residents; fewer than a dozen employees) to quitelarge (thousands of units and residents; many hundreds of employees, revenues of nearly 100,000,000)Galloway Ridge Roy Lindholm
More than one-third of the 2,000 properties in the response set offer independent living units:Q Freestanding independent living communities represent 10% Q Communities that are predominantly independent living but with a smaller number of assisted living beds representanother 10% Q 5% contain independent living units with some assisted living and Alzheimer’s care unitsQ Between 5% and 10% of the properties are Continuing Care Retirement Communities (CCRCs), containing bothindependent living and skilled nursing bedsProperties consisting of predominantly assisted living and / or Alzheimer’s care units represent12more than one-half of the properties:Q One-third are freestanding assisted living communitiesQ Between 5% and 10% are freestanding Alzheimer’s careQ Communities with both assisted living and Alzheimer’s care comprise almost 20%Of the more than 250,000 units in these responding properties:Q More than 10% were in freestanding independent living communitiesQ Another 25% /- were in communities with predominantly independent livingbut also some assisted living and / or Alzheimer’s careQ 25% were in CCRCsQ 15% were in freestanding assisted living communitiesQ Almost 15% were in communities offering both assisted living and Alzheimer’s careMore detail about the types of properties and units, and their geographic distribution,is found in Chapters 1 and 2 of the report.The typical CCRC in the study consists of about three times the number of units (400 /-), squarefootage of building area (300,000 ) and property acreage (35 acres) than the typical independentliving property (at 150 units /- ; 100,000 to 140,000 square feet; under 10 acres). In turn, thetypical independent living property is more than twice the size of the typical assisted livingproperty (at 50 units; 50,000 /- square feet; 3 to 5 acres). Even the allocations of space withinbuildings reflect different uses: assisted living properties and those with Alzheimer’s care allocatemore space proportionally to common areas (more than 40%) than do other property types (closerto 30%) — possibly because more of the resident-service functions, such as assistance with eatingand bathing, take place outside of residents’ rooms. More detail about property and unit size, andabout unit mix, is found in Chapter 3.
Properties open less than two years by December 31, 2013 were excluded from the sample analyzedin this report as most of these properties have not yet reached operational or financial stabilization.That exclusion of properties opened within the most recent two years makes the survey’s responseset a bit older, in aggregate (and with details in Chapter 4) than the “universe” of all US properties.In this year’s results, the dominant share of properties (95% ) were owned by for-profit entities.Of those, private for-profit ownership and publicly-held ownership were about evenly-split, at45% – 50% each. An exception is CCRCs: almost half the properties were owned by not-for-profitentities. Better than 4 out of every 5 of the survey respondents indicated that the property’s manageroperates more than 25 properties. Smaller multi-community operators (with 2 to 25 properties)together comprise about 15% of the responses, while single-asset operators are less-frequent still —although this result could indicate response-bias (that is, single-asset operators less likely to receivethe survey or to respond, no matter what their proportion nationally). More detail about propertymanagement and ownership is found in Chapter 5.Rental payment plans are dominant (90% ) among the properties responding, with the exceptionof CCRCs, where ⅔ or more require entry fees of more than 20,000 up-front (in addition tomonthly fees) as the primary payment option. Most properties use some form of fee-for-service(e.g., points, levels-of-care; a la carte fees) to charge for the delivery of assistance with ADLs: fewerthan 15% of assisted living services, and fewer than 50% of Alzheimer’s care services were paid-forvia an all-inclusive rate. Property base fees can vary widely by geographic region: half-again asmuch in the Northeast as some other states. More detail about payment plans and fee structuresis found in Chapter 6.Occupancy rates for these [stabilized] properties centered at about 90% to 91%. At for-profitcommunites, the stabilized occupancy of those publicly-owned at over 93%, was higher thanat privately-owned, at closer to 90%. Not-for-profit communities — primarily CCRCs — appearto occupy nursing beds at slightly higher rates (more than 89%) than for-profits, but occupyindependent living units (at under 90%) and assisted living beds (at about 91%) no higher thanfor-profits. More detail about occupancy rates is found in Chapter 7.Of the survey respondents, annual resident turnover [calculated as the number of move-outs at aproperty during the year, divided by the average number of units or beds occupied throughout theyear] was highest for assisted living properties — at more than 55%, which implies each bed turnsmore than once every 2 years. Turnover was lower for independent living properties (typically lessthan 40% annually) and was lower still for CCRCs (excluding the skilled nursing beds) at only 15%.More detail can be found in Chapter 8.13
Among the five principal property types described:Q Freestanding independent living propertiesQ Independent living properties with a smaller number of assisted living bedsQ Freestanding assisted living properties (or with a smaller number of independent living units,but without Alzheimer’s care)Q Assisted living properties with Alzheimer’s care unitsQ CCRCs14what we term “median” 1 revenues per occupied unit (or bed) ranged from between 2,600 and 2,700 per month (for independent living properties without assisted living) up to almost 5,000 permonth for assisted living properties with Alzheimer’s care, and for CCRCs. “Median” net operatingincome per occupied unit (or bed) was highest at assisted living properties with Alzheimer’s care,at more than 18,000 annually. Median NOI per occupied unit for other property types ran closer to 14,000 annually. More detail about revenues and expenses is found in Chapter 9.Year-to-year comparisons between The State of Seniors Housing survey results are difficult tomake with confidence, because the sample composition is different each year. So, year-over-yeardifferences we report may either represent real trends over time, or they may simply have occurredbecause we are examining performance from a different set of properties each year. In order to makemore-valid and more-reliable year-over-year comparisons, Chapter 10 presents data from “samestore” properties — properties that do contribute data in successive years.This same-store analysis shows that, compared with last year:Q Year-over-year occupancy has generally increased at about a 1% annual rate1The metric presented as“median” in this report is notthe particular middle propertyor unit in a set arrayed inascending or descending order,but rather is the average of theproperties (or units, etc.) in themiddle two deciles (the 5th and6th decile, in other words fromthe 40th to the 60th percentile).By doing so, the “median” wereport is broader, more stableand more “typical” of a set ofdata than is the one particularproperty (or unit, etc.) at themiddle. This calculation waschosen to better represent thecentral cluster, or “middle ofthe pack” of an entire set ofdata, and still without undueinfluence from extreme highor low values which canskew simple average (mean)calculations. This “median” wereport can therefore be viewedas a kind of “trimmed” mean.Q Property revenues have generally increased but not by more than 5% annuallyQ Operating expenses in general have increased by up to 5% or 10%Q Labor cost increases have outpaced other operating expense increasesQ Operating margins have therefore deteriorated, but only slightlyQ NOI has also deteriorated slightly, except in CCRCs where rising labor costs have been offset,and where NOI increased about 5% based on revenue increasesSince 2010, same-store performance has generally improved:Q In revenues, by about 2% annuallyQ In NOI, an annual improvement but somewhat less than that, all based on occupancy increasesof from one to three percent annually
Given the importance of labor costs, Chapter 11 shows average staff-to-resident ratios: ranging from0.17 (that is, one full-time-equivalent employee for every 6 residents) in freestanding independentliving, to approximately 0.4 (that is, one FTE for every 2½ residents) when assistance with activitiesof daily living is involved, up to approximately 0.5 (that is, one FTE for every 2 residents) whereAlzheimer’s care or nursing care is involved. Chapter 11 also presents average annual wages bydepartment at the various property types.Chapter 12 examines other key cost items in more detail:Q Raw food costs averaging 6 or 7 per resident per dayQ Management fees averaging 4.5% of revenues, but varying from 1% to more than 10%Q Employee benefits averaging about 10% of total wages and salariesQ Utilities costs averaging about 2 per square foot, or expressed differently at 5 per resident per dayQ Capital expenditures to maintain properties’ competitive positions averaging almost 3,000 per unit, butsubstantially more than that — by about one-third — for properties approaching or exceeding 30 years of ageChapter 13 presents key financial performance indicators for properties operated on a for-profitbasis and that have been open for at least two full years:Q Operating margins, calculated as Net Operating Income divided by Total Revenue, generally decreased(because costs, especially labor costs, increased relative to revenues) as the levels of resident acuity andtherefore resident care increased: from about 40% “median” for independent living, to about 30% for assistedliving and / or Alzheimer’s care, to less than 30% for CCRCsQ “Median” debt service coverage ratios were 2.1 or higher for the various property types with sufficient responseset sizes; which means that a sizeable majority of for-profit seniors housing properties were generating more-thansufficient cash flow to cover their debt serviceQ Current (unleveraged) “median” return on total investment typically ran between 7% and 9%. However, becausethe total project investment in the “ROI” denominator is in terms of historical purchase cost, development cost,and expansion / renovation costs, the “Return on Investment” as presented in this report is not necessarilyequivalent to a current capitalization rateKeeping in mind the caveats about making year-to-year comparisons generated from different setsof responding properties each year (because any year-to-year difference could be due to the nonsimilar properties, not due to “real” trends) and also caveats about slightly different calculationmethods and community-type groupings recently, the historical tables in Chapter 14 suggest that:Q “Median” occupancy rates may well have recovered to the 90% and above level seen beforethe “Great Recession” of 2008Q Resident turnover rates, at nearly 40% annually for independent living and over 50% annually for assisted living,may be creeping back up above rates seen in recent years – although CCRCs at 15% annual turnover (excludingnursing beds) are bucking that trendQ “Median” operating margins at 44% for independent living, at above 30% for assisted living, and at nearly30% for CCRCs, appear to be at or near historic highs for the industry15
Methodologyand Data AnalysisASHA, ALFA, LeadingAge, NCAL, and NIC contacted owners and managers of seniors housingresidences throughout the United States and provided the 2014 State of Seniors Housing survey inan Excel format. Respondents were asked to complete separate surveys for each of their company’sproperties. Large regional and national providers (generally those with 2,500 or more units) wereidentified by the State of Seniors Housing Task Force and were given the option of submitting dataelectronically from their own operating statements, through confidential data-mapping servicesprovided by HealthTrust, LLC. Several large providers utilized the data-mapping services, whileothers completed their surveys in the Excel format. Completed questionnaires were carefullyreviewed for accuracy and, when appropriate, follow-up with respondents was made to clarifyapparent ambiguities or inconsistent responsesRespondents were asked for operating results for the 12-month period ending nearest to December31, 2013. The metrics presented in this report that originated from State of Seniors Housingquestionnaires are subject to non-sampling errors, such as differences in the interpretation ofquestions by respondents or variations in financial reporting, and also to sampling errors. Effortswere made, and are ongoing, to minimize the effects of these errors. Results in this report may differfrom those in other surveys because of differences in survey timing, question wording, and differentrespondent samples. The use of a statistical sampling protocol has been used to guide the selection ofproperties presented in the State of Seniors Housing report, so that entities submitting responses fordisproportionate numbers of properties would be neither over-represented nor under-represented.The Heritage of Green Hills Paul Laincz17
Terminology18The findings reported from our analysis are presented in several different types of measurements andstatistics: counts, sums, means (averages), and what we term “medians,” “deciles” and “quartiles.”Counts are the number of responses to a particular question, while sums aggregatethe numerical responses.Means are arithmetic averages, sometimes (where noted) weighted by the number of units, theSTATISTICAL TERMINOLOGYCOUNTNumber of responsesSUMAggregate valueof numerical responsesMEANArithmetic averageof numerical responsesMEDIANThe [weighted] averageof the 40th through the 60th percentileLOWER DECILEThe [weighted] averageof the lowest 10% of responsesLOWER QUARTILEThe [weighted] averageof the lowest 25% of responsesUPPER QUARTILEThe [weighted] averageof the highest 25% of responsesUPPER DECILEThe [weighted] averageof the highest 10% of responsesnumber of dollars, the number of FTEs, etc. involved — so that larger properties, with more units,more residents, more revenues, etc. can be made to count more heavily in the averages. For example,“average” number of FTEs per resident for a set of properties could be calculated either by(1) adding the total number of FTEs in the entire set, then dividing by the number of residents in the entire set (whichwould weight larger properties more heavily), or by(2) averaging the FTEs per resident, property by property, with both large and small properties assigned equal weightsWe endeavor to make clear which averaging method is used in the various tables.Measures derived from percentile data are presented extensively throughout this report, including:the 10th and 90th percentiles (the lower and upper deciles); the 25th and 75th percentiles (thelower and upper quartiles); and the 50th percentile, referred to by some as the median. Mediansare sometimes preferred over means or averages, which can be skewed by a few extremely high orlow response values.Quartiles are calculated by dividing a sample into four equal parts. When responses are arrangedsequentially, the lower quartile describes the properties in the lowest 25% of the sample. The upperquartile describes the upper 25% of the responses. Similarly, the lower decile describes the lowest10% of the responses, and the upper decile describes the upper 10% of the responses.The Heritage of Green Hills Paul Laincz
In this report (and in contrast to report years before 2012), the metrics presented for a decile or20quartile are calculated as the average of all the responses within the decile or quartile, respectively,rather than as the one-property “cutpoint” separating that decile or quartile from the next. Thispresentation was chosen to better summarize and represent all the properties within that decileor quartile rather than portray the characteristic(s) for only one particular property (the one whichhappens to fall at the cutpoint), and which may well not be as representative of the entire decileor quartile. Such data, when presented, now summarize the responses within the decile or quartile,rather than representing the one property at the cutpoint.In similar vein (and also in contrast to report years before 2012), the metric presented as a “median”in this report is not (except where so identified) the particular middle property in a set arrayed inascending or descending order, but rather is the average of the properties in the middle 2 deciles(the 5th, and 6th decile, in other words from the 40th to the 60th percentile). By doing so, the“median” we report is broader, more stable, and more “typical” of a set of data than is one particularproperty. This calculation was chosen to better represent the central cluster, or “middle of the pack”of an entire set of data, and still without undue influence from extreme high or low values.Exhibits in which “medians” are presented are often accompanied by decile and /or quartilestatistics. Together with the “median,” such deciles and quartiles provide a range of responsesto identify higher-performing, and lower-performing, properties. Means (that is, averages) arepresented either when a sample is relatively uniform, or in select cases when it is not, along withmedian data, in order to identify the effects of outlier responses.Questions about the exhibits or survey methodology should be directed to Colleen Blumenthalof HealthTrust, LLC at colleen.blumenthal@healthtrust.com
All figures in this report are intendedto serve as descriptive information,not as benchmarks or performancegoals. The State of Seniors Housingresults are dependent on theunderlying properties selected bycontributing operators (althoughwhere a disproportionate numberof properties are available fromparticular respondents, the Stateof Seniors Housing analysis nowconducts a randomized sample withinthat selection). Consequently, yearto-year comparisons are difficultbecause — except where a “samestore sample” is made explicit — thesample composition is differenteach year: differences year-toyear are otherwise confoundedwith differences solely due to theunderlying samples not beingidentical. The American SeniorsHousing Association, Assisted LivingFederation of America, LeadingAge,National Center for Assisted Livingand National Investment Centerfor Seniors Housing & Care do notattempt to set or conform pricesor operating ratios for the seniorshousing industry.21
22Definitions andNomenclatureCategorizing seniors housing remains a challenge because states use different nomenclature andregulatory systems. By utilizing very specific survey instructions and data sorting techniques, webelieve that property types have been accurately and uniformly categorized for purposes of this report.CATEGORIZATION OF UNIT TYPESRespondents were asked to identify units and /or beds for each property surveyed based on thefollowing definitions:Senior Apartments: Market-rate units in age-restricted communities where at least 80% of theresidents are 55 years of age or older. Although optional meal plans may be offered, the basemonthly fee does not include meals in a common dining facility, and therefore, “senior apartments”are different from “independent living units.”Independent Living Units: Designed for seniors who pay for some services (e.g., housekeeping,transportation, meals) as part of a monthly fee or rental rate, and who require little, if any, assistancewith Activities of Daily Living. Typically, independent living units are not licensed for health care.Residents of independent living units may receive home health care services provided to themby either an outside agency or an affiliate of the property management. In order to qualify as anindependent living property, the community must contain a common dining facility that provides atleast one daily meal as part of the monthly fee.Assisted Living Beds: Designed for frail seniors who need assistance with Activities of DailyLiving, but do not require continuous skilled nursing care. These beds can be offered in a separatewing, separate floor (or part of a floor), or separate building, and typically have state licensurerequirements for the delivery of assisted living services.Alzheimer’s Beds: Designed for those residents with significant cognitive impairment as a result ofhaving Alzheimer’s disease or related dementia. Alzheimer’s care beds are not licensed as nursingbeds, but may have additional state licensure requirements.Skilled Nursing Beds: Licensed nursing beds.The Heritage of Green Hills Paul Laincz
CATEGORIZATION OF PROPERTY TYPESThe State of Seniors Housing report categorizes CCRCsBy asking respondents to categorize their units / beds,separately from independent living communities, inrather than property type, the database is designedcontrast to some other industry publications whichto allow us to make logical groupings by type, afterconsider CCRCs to be a sub-category of other propertyrespo
Artwork for The State of Seniors Housing 2014 has been created by seniors housing residents. Special thanks to Laurie Rodman of Benchmark Senior Living, Paul Salais Jr. of LCS, and Julie McKowen of Senior Star for assistance with the artwork in this year's State of Seniors Housing report. Cover art: Heritage of Green Hills David Lumb


