Transcription
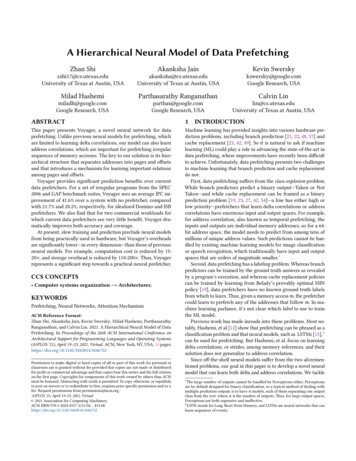
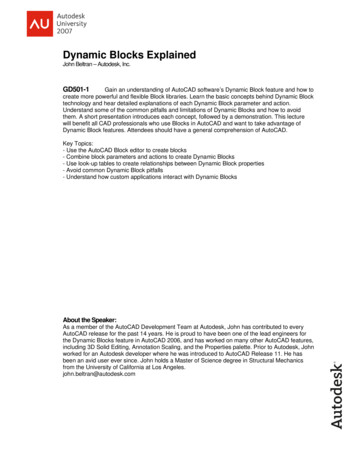
Dynamic Prefetching of Data Tiles for InteractiveVisualizationLeilani BattleRemco ChangMichael StonebrakerMITCambridge, MA 02139Tufts UniversityMedford, MA 02155MITCambridge, MA raker@csail.mit.eduABSTRACTIn this paper, we present ForeCache, a general-purpose tool for exploratory browsing of large datasets. ForeCache utilizes a clientserver architecture, where the user interacts with a lightweight clientside interface to browse datasets, and the data to be browsed is retrieved from a DBMS running on a back-end server. We assume adetail-on-demand browsing paradigm, and optimize the back-endsupport for this paradigm by inserting a separate middleware layerin front of the DBMS. To improve response times, the middlewarelayer fetches data ahead of the user as she explores a dataset.We consider two different mechanisms for prefetching: (a) learning what to fetch from the user’s recent movements, and (b) using data characteristics (e.g., histograms) to find data similar towhat the user has viewed in the past. We incorporate these mechanisms into a single prediction engine that adjusts its predictionstrategies over time, based on changes in the user’s behavior. Weevaluated our prediction engine with a user study, and found thatour dynamic prefetching strategy provides: (1) significant improvements in overall latency when compared with non-prefetching systems (430% improvement); and (2) substantial improvements inboth prediction accuracy (25% improvement) and latency (88% improvement) relative to existing prefetching techniques.1.INTRODUCTIONExploratory browsing helps users analyze large amounts of dataquickly by rendering the data at interactive speeds within a viewport of fixed size (e.g., a laptop screen). This is of particular interestto data scientists, because they do not have the time or resources toanalyze billions of datapoints by hand. One common interactionpattern we have observed in data scientists is that they analyze asmall region within a larger dataset, and then move to a nearbyregion and repeat the same analysis. They initially aggregate orsample these regions when looking for a quick answer, and zoominto the raw data when an exact answer is needed. Thus, we focuson supporting a detail-on-demand browsing paradigm, where userscan move to different regions within a single dataset, and zoom intothese regions to see them in greater detail.While users want to be able to drill down into specific regions ofa dataset, they also want their actions within the browsing tool to bePermission to make digital or hard copies of all or part of this work for personal orclassroom use is granted without fee provided that copies are not made or distributedfor profit or commercial advantage and that copies bear this notice and the full citation on the first page. Copyrights for components of this work owned by others thanACM must be honored. Abstracting with credit is permitted. To copy otherwise, or republish, to post on servers or to redistribute to lists, requires prior specific permissionand/or a fee. Request permissions from permissions@acm.org.SIGMOD’16, June 26-July 01, 2016, San Francisco, CA, USAc 2016 ACM. ISBN 978-1-4503-3531-7/16/06. . . 15.00DOI: http://dx.doi.org/10.1145/2882903.2882919Figure 1: A diagram of ForeCache’s tile storage scheme.fluid and interactive. Even one second of delay after a pan or zoomcan be frustrating for users, hindering their analyses and distractingthem from what the data has to offer [17, 15]. Thus, the goal of thisproject is to make all user interactions extremely fast (i.e., 500 msor less), thereby providing a seamless exploration experience forusers. However, although modern database management systems(DBMS’s) allow users to perform complex scientific analyses overlarge datasets [20], DBMS’s are not designed to respond to queriesat interactive speeds, resulting in long interaction delays for browsing tools that must wait for answers from a backend DBMS [2].Thus, new optimization techniques are needed to address the noninteractive performance of modern DBMS’s, within the context ofexploratory browsing.In this paper, we present ForeCache, a general-purpose tool forinteractive browsing of large datasets. Given that data scientistsroutinely analyze datasets that do not fit in main memory, ForeCache utilizes a client-server architecture, where users interact witha lightweight client-side interface, and the data to be explored is retrieved from a back-end server running a DBMS. We use the arraybased DBMS SciDB as the back-end [23], and insert a middlewarelayer in front of the DBMS, which utilizes prefetching techniquesand a main-memory cache to speedup server-side performance.When the user performs zooms in ForeCache, she expects to seemore detail from the underlying data. To support multiple levelsof detail, we apply aggregation queries to the raw data. However,complex scientific analyses take time, and may not execute at interactive speeds in the DBMS. To ensure that zooms are fast in ForeCache, we compute each level of detail, or zoom level, beforehand,and store them on disk. A separate materialized view is created foreach zoom level, and we partition each zoom level into equal-sizeblocks, or data tiles [16].The user cycles through the following steps when browsing datain ForeCache: (1) she analyzes the result of the previous request,(2) performs an action in the interface to update or refine the request(e.g., zooms in), and then (3) waits for the result to be rendered onthe screen. ForeCache eliminates step 3 by prefetching neighboring tiles and storing them in main memory while the user is stillin step 1, thereby providing the user with a seamless browsing ex-
perience. At the middleware level, we incorporate a main-memorycache for fetching computed tiles, shown in Figure 1. When tilesare prefetched, they are copied from SciDB to the cache. However,in a multi-user environment, there may be too little space on theserver to cache all neighboring tiles for every user. Furthermore,we may only have time to fetch a small number of tiles before theuser’s next request. Thus, we must rank the tiles first, and fetchonly the most likely candidates.While prefetching is known to be effective, ForeCache needs access to the user’s past interactions with the interface to predict future data requests. We have observed that the client has extensiverecords of the user’s past interactions, which we can leverage to improve our prefetching strategy. For example, the client knows whatregions the user has visited in the past, and what actions she hasrecently performed. One straightforward optimization is to train aMarkov model on the user’s past actions, and to use this model topredict the user’s future actions [6, 8]. We refer to these predictiontechniques as recommendation models throughout this paper.However, the user’s actions are often too complex to be describedby a single model (which we will show in Section 5). Thus, existingmodels only cover a fraction of possible analysis goals, leading tolonger user wait times due to prediction errors. A comprehensiveapproach is needed, such that we can consistently prefetch the righttiles over a diverse range of high-level analysis goals.To address the limitations of existing techniques, we have designed a new two-level prediction engine for our middleware. Atthe top level, our prediction engine learns the user’s current analysis phase (i.e., her current frame of mind), given her most recentactions. The user’s analysis phase hints at her current analysisgoals, and thus provides context for which actions in the interfaceshe may use to reach her goals. We provide examples of analysisphases in the following paragraph. Furthermore, users frequentlyemploy several low-level browsing patterns within each analysisphase (e.g., panning right three times in a row). Therefore at thebottom level, our prediction engine runs multiple recommendationmodels in parallel, each designed to model a specific low-levelbrowsing pattern. Using this two-level design, our prediction engine tracks changes in the user’s current analysis phase, and updates its prediction strategy accordingly. To do this, we increaseor decrease the space allotted to each low-level recommendationmodel for predictions.Taking inspiration from other user analysis models [19], we haveobserved that the space of user interaction patterns can be partitioned into three separate analysis phases: Foraging (analyzing individual tiles at a coarse zoom level to form a new hypothesis),Sensemaking (comparing neighboring tiles at a detailed zoom levelto test the current hypothesis), and Navigation (moving betweencoarse and detailed zoom levels to transition between the previoustwo phases). The user’s goal changes depending on which phaseshe is currently in. For example, in the Navigation phase, the useris shifting the focus of her analysis from one region in the datasetto another. In contrast, the user’s goal in the Foraging phase is tofind new regions that exhibit interesting data patterns.We consider two separate mechanisms for our low-level recommendation models: (a) learning what to fetch based on the user’spast movements (e.g., given that the the user’s last three moves wereall to “pan right,” what should be fetched?) [8]; and (b) using dataderived characteristics, or signatures, to identify neighboring tilesthat are similar to what the user has requested in the past. We usea Markov chain to model the first mechanism, and a suite of signatures for the second mechanism, ranging from simple statistics(e.g., histograms) to sophisticated machine vision features.To evaluate ForeCache, we conducted a user study, where domain scientists explored satellite imagery data. Our results showthat ForeCache achieves (near) interactive speeds for data exploration (i.e., average latency within 500 ms). We also found thatForeCache achieves: (1) dramatic improvements in latency compared with traditional non-prefetching systems (430% improvementin latency); and (2) higher prediction accuracy (25% better accuracy) and significantly lower latency (88% improvement in latency), compared to existing prefetching techniques.In this paper, we make the following contributions:1. We propose a new three-phase analysis model to describehow users generally explore array-based data.2. We present a tile-based data model for arrays, and architecture for enabling interactive exploration of tiles in SciDB,3. We present our two-level prediction engine, with an SVMclassifier at the top level to predict the user’s current analysisphase, and recommendation models at the bottom to predictlow-level interaction patterns.4. We present the results from our user study. Our results showthat our approach provides higher prediction accuracy andsignificantly lower latency, compared to existing techniques.1.1BackgroundForeCache relies on a diverse set of prediction components anduser inputs. Here, we provide an overview of the main conceptsutilized in ForeCache, some of which were introduced in Section 1.User Interactions/Moves: The user’s interactions with ForeCacheare the actions she makes in the front-end interface to explore herdata. We also refer to these interactions as moves.User Session: A user session refers to a single session for whichthe user has logged into ForeCache and explored a single dataset.Data Model: The ForeCache data model defines: (1) the structure and layout of data tiles, and (2) how to build data tiles. Weexplain the ForeCache data model in detail in Section 2.Analysis Model: Our analysis model is defined by our three analysis phases, and how these phases interact with each other. Weexplain our analysis model in detail in Section 4.2.Analysis Phase: The user’s current analysis phase representsher frame of mind while exploring data in ForeCache (i.e., Foraging, Navigation, or Sensemaking). Analysis phases can be inferredthrough the user’s interactions; we explain how we predict analysisphases in Section 4.2.2.Browsing Patterns: Low-level browsing patterns are short chainsof interactions repeated by the user (e.g., zooming in three times).We explain how we predict these patterns in Section 4.3.Recommendation Model: A recommendation model is an algorithm used to predict low-level browsing patterns (e.g., Markovchains). ForeCache employs two kinds of recommendation models:Action-Based (Section 4.3.2) and Signature-Based (Section 4.3.3).2.DATA MODELIn this section, we describe the kinds of datasets supported byForeCache, and our process for building zoom levels and data tiles.2.1Datasets Supported by ForeCacheThe datasets that work best with ForeCache share the same properties that make SciDB performant: (a) the majority of columntypes are numerical (integers, floats, etc.), and (b) the relative position of points within these columns matters (e.g., comparing pointsin time, or in latitude-longitude position). These properties ensurethat the underlying arrays are straightforward to aggregate, partition, and visualize in ForeCache. The following three exampledatasets share these properties: geospatial data (e.g., satellite im-
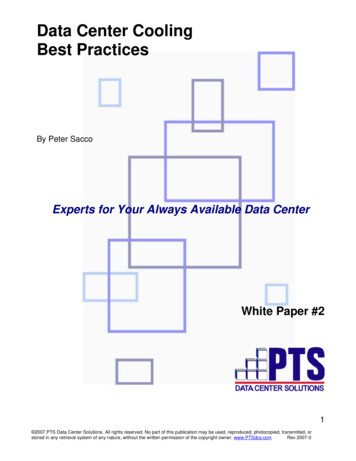
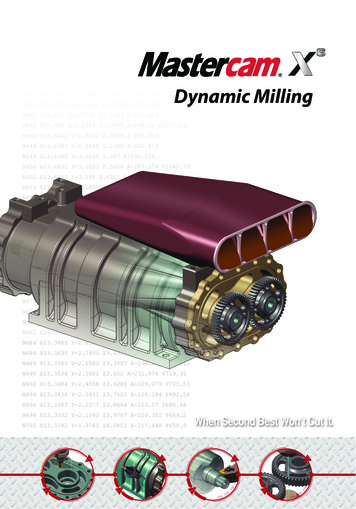
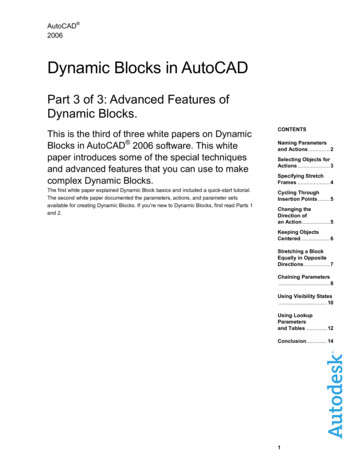
Figure 3: A 16x16 array being aggregated down to an 8x8 arraywith aggregation parameters (2, 2).(a) Satellite Imagery(b) Multidimensional(c) Timeseries (Heart rate Monitoring)Figure 4: A zoom level being partitioned into four tiles, with tilingparameters (4, 4).Figure 2: Potential tiling schemes for three types of data.agery in Figure 2a), multidimensional data (e.g., iris flower classification in Figure 2b), and time series data (e.g., heart rate monitoring in Figure 2c). Beyond these three examples, SciDB has alsobeen used for efficiently analyzing genomics data [24] and astronomy data [22]. Given its extensive support for complex analytics over multidimensional datasets, we use SciDB as the back-endDBMS in ForeCache.Consider Figure 2a, where the user is exploring an array of snowcover measurements computed from satellite imagery. Each arraycell has been mapped to a pixel, where orange and yellow pixelscorrespond to snow. We have partitioned the current zoom levelalong the array’s two dimensions (latitude and longitude), resultingin four data tiles. The user’s current viewport is located at the topleft data tile; the user can move to other tiles by panning in theclient-side interface. The user can also zoom in or out to exploredifferent zoom levels.2.2Interactions Supported by ForeCacheIn this paper, we focus on supporting data exploration throughtwo-dimensional (2D) views, where exploration means that the usercan browse, but not modify the underlying dataset. In addition, weassume that users are interacting with the data using consistent,incremental actions that only retrieve a fraction of the underlyingdataset. For example, if the user wants to go from zoom level 0to 4 in ForeCache, she must go through levels 1, 2, and 3 first.Otherwise, users are essentially performing random accesses on theunderlying data, which are generally difficult to optimize for anyback-end DBMS (e.g., “jumping” to any location in the dataset).These assumptions define a specific class of exploration interfaces, characterized by the following four rules: (a) the interfacesupports a finite set of interactions (i.e., no open-ended text boxes);(b) these interactions cannot modify the underlying dataset; (c)each interaction will request only a small fraction of data tiles;and (d) each interaction represents an incremental change to theuser’s current location in the dataset (i.e., no “jumping”). Note thatgiven rule (c), ForeCache does not currently support interactionsthat force a full scan of the entire dataset, such as searches (e.g.,find all satellite imagery pixels with a snowcover value above 0.7).2.3Building Data TilesTo improve performance, ForeCache builds all data tiles in advance, and stores them on disk in SciDB. In this section, we explain how ForeCache builds zoom levels and data tiles in advance,which is done in three steps: (1) building a separate materializedview for each zoom level; (2) partitioning each zoom level intonon-overlapping blocks of fixed size (i.e., data tiles); and (3) com-puting any necessary metadata (e.g., data statistics) for each datatile. The most detailed zoom level (i.e., highest resolution) is justthe raw data without any aggregation.Building Materialized Views: To build a materialized view, weapply an aggregation query to the raw data, where the aggregationparameters dictate how detailed the resulting zoom level will be.These parameters form a tuple ( j1 , j2 ,., jd ), where d is the numberof dimensions. Each parameter j specifies an aggregation intervalover the corresponding dimension, where every j array cells alongthis dimension are aggregated into a single cell. Consider Figure 3,where we have a 16x16 array (on the left), with two dimensionslabeled x and y, respectively. Aggregation parameters of (2, 2) correspond to aggregating every 2 cells along dimension x, and every2 cells along dimension y (i.e., the red box in Figure 3). If we compute the average cell value for each window in the 16x16 array, theresulting array will have dimensions 8x8 (right side of Figure 3).Partitioning the Views: Next, we partition each computed zoomlevel into data tiles. To do this, we assign a tiling interval to each dimension, which dictates the number of aggregated cells containedin each tile along this dimension. For example, consider our aggregated 8x8 view in Figure 4. If we specify a tiling window of (4, 4),ForeCache will partition this view into four separate data tiles, eachwith the dimensions we specified in our tiling parameters (4x4).We choose the aggregation and tiling parameters such that onetile at zoom level i translates to four higher-resolution tiles at leveli 1. To do this, we calculated our zoom levels bottom-up (i.e.,starting at the raw data level), multiplying our aggregation intervalsby 2 for each coarser zoom level going upward. We then appliedthe same tiling intervals to every zoom level. Thus, all tiles havethe same dimensions (i.e., tile size), regardless of zoom level.Computing Metadata: Last, ForeCache computes any necessarymetadata for each data tile. For example, some of our recommendation models rely on data characteristics, or signatures, to be computed for each tile, such as histograms or machine vision features(see Section 4 for more detail). As ForeCache processes each tileand zoom level, this metadata is computed and stored in a shareddata structure for later use by our prediction engine.Choosing a Tile Size: Pre-computing tiles ensures that ForeCache provides consistently fast performance across zoom levels.However, choosing a bad tile size can negatively affect performance.For example, increasing the tile size reduces the number of tilesthat can be stored in the middleware cache (assuming a fixed cachesize), which could reduce ForeCache’s prefetching capabilities. Inour evaluation (Section 5), we take this into account by varyingthe number of tiles that are prefetched by ForeCache in our experiments. We plan to perform an in-depth study of how tiling parameters affect performance as future work.
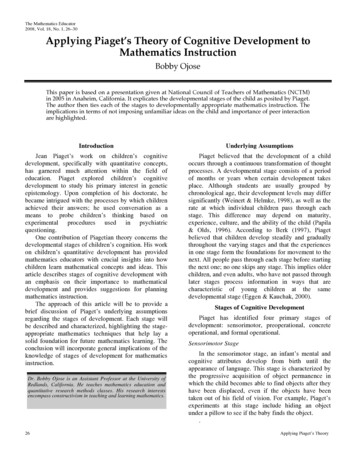
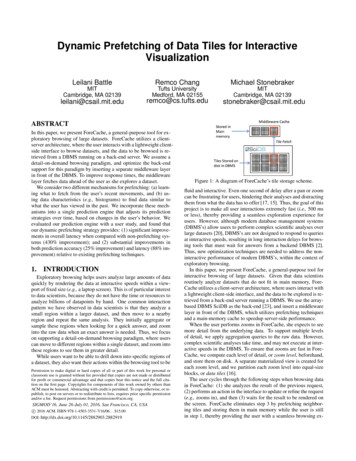
Figure 5: Overview of the ForeCache architecture.3.ARCHITECTUREForeCache has four primary components, illustrated in Figure 5:a web-based visualization interface on the client; a prediction engine; a tile cache manager; and the back-end DBMS. The visualizersends tile requests to the tile prediction engine, and the predictionengine then sends these requests to the cache manager for retrieval.To anticipate the user’s future requests, the prediction engine sendspredictions to the cache manager to be fetched ahead of time. Thecache manager stores predicted tiles in the middleware tile cache,and retrieves tiles requested by the client from either the middleware cache or SciDB. We elaborate on the first three componentsof the ForeCache architecture in the rest of this section.Front-End Visualizer: ForeCache is agnostic to the front-end visualizer, which can be implemented in any language or platform onthe client. The only requirement is that the visualizer must communicate with the back-end through tile requests. For our experiments,we implemented a lightweight visualizer that runs in a web browseron the client machine (see Section 5 for more details).Prediction Engine: The purpose of the prediction engine is tomanage ForeCache’s tile requests, which consists of two majortasks: responding to tile requests from the client; and managingboth the high-level (analysis phase classifier) and low-level (recommendation models) predictions used to infer the user’s futurerequests. To fulfill existing tile requests, the prediction engine retrieves requested tiles from the cache manager, and sends themback to the client for visualization. This component also manages ForeCache’s predictions. At the top-most level, this component runs an SVM classifier that predicts the user’s current analysisphase. At the lower level, the prediction engine manages severaltile recommendation models running in parallel. These recommendation models make suggestions for what data tiles to fetch, and theactual fetching of the tiles is left to the cache manager. After eachuser request, the prediction engine retrieves a separate list of predictions from each recommender, and forwards these predictionsto the cache manager for further processing. We describe our SVMclassifier and recommendation models in detail in Section 4.Tile Cache Manager: The cache manager decides which tileswill be stored in the main-memory middleware cache. Each recommendation model is allotted a limited amount of space in thiscache to make predictions. The remaining space in the middlewarecache is used to store the last n tiles requested by the interface.We refer to the allocations made to our recommendation modelsas the cache manager’s current allocation strategy. This allocationstrategy is reevaluated after each request to ensure that space is allocated efficiently across all models. We explain how we updatethese allocations in Section 4. The cache manger then uses the tilerecommendations from the prediction engine to fill the cache oncethe allocations have been updated.4.PREDICTION ENGINE DESIGNThe goal of our prediction engine is to identify changes in theuser’s browsing patterns, and update its prediction strategy accord-ingly. In this way, our prediction engine ensures that the most relevant prediction algorithms are being used to prefetch data tiles.To do this, our prediction engine makes predictions at two separatelevels. At the top level, it learns the user’s current analysis phase.At the bottom level, it models the observed analysis phase with asuite of recommendation models.We chose a two-level design because we have found that usersfrequently switch their browsing patterns over time. In contrast,recommendation models make strict assumptions about the user’sbrowsing patterns, and thus ignore changes in the user’s behavior.For example, Markov chains assume that the user’s past moves willalways be good indicators of her future actions. However, oncethe user finds a new region to explore, the panning actions thatshe used to locate this region will be poor predictors of the futurezooming actions she will use to move towards this new region. As aresult, we have found that recommendation models only work wellin specific cases, making any individual model a poor choice forpredicting the user’s entire browsing session.However, if we can learn what a user is trying to do, we canidentify the analysis phase that best matches her current goals, andapply the corresponding recommendation model(s) to make predictions. To build the top level of our prediction engine, we trained aclassifier to predict the user’s current analysis phase, given her pasttile requests. To build the bottom level of our prediction engine, wedeveloped a suite of recommendation models to capture the different browsing patterns exhibited in our analysis phases. To combinethe top and bottom levels, we developed three separate allocationstrategies for our middleware cache, one for each analysis phase.In the rest of this section, we formalize the general predictionproblem solved by ForeCache, explain the top and bottom leveldesigns for our prediction engine, and discuss how we combine thetwo levels using our allocation strategies.4.1Prediction FormalizationHere, we provide definitions for all inputs to and outputs fromForeCache, and a formalization of our general prediction problem.User Session History: The user’s last n moves are constantlyrecorded by the cache manager and sent to the prediction engine asan ordered list of user requests: H [r1 , r2 , ., rn ]. Each requestri H retrieves a particular tile Tri . Note that n (i.e., the historylength) is a system parameter set before the current session starts.Training Data: Training data is used to prepare the predictionengine ahead of time, and is supplied as a set of traces: {U1 , U2 ,.}. Each trace U j represents a single user session, and consists ofan ordered list of user requests: U j [r1 ,r2 ,r3 ,.].Allocation Strategy: The cache manager regularly sends the current allocation strategy to the prediction engine: {k1 , k2 ,.}, werek1 is the amount of space allocated to recommendation model m1 .General Prediction Problem: Given a user request r for tile Tr ,a set of recommender allocations {k1 , k2 , .}, and session historyH, compute an ordered list of tiles to prefetch P [T1 ,T2 ,T3 ,.],where each tile Ti P is at most d moves away from Tr . The firsttile (T1 ) has highest priority when prefetching tiles. d is a systemparameter set before the current session starts (default is d 1).Only a few of these prediction parameters must be specified bythe user: allocation strategies for the tile cache (Section 4.4); distance threshold d (Section 4.3.1); user history length n (Section4.3.2); and user traces as training data (Sections 4.2.2-4.3.2).4.2Top-Level DesignIn this section, we explain the three analysis phases that usersalternate between while browsing array-based data, and how weuse this information to predict the user’s current analysis phase.
Table 1: Input features for our SVM phase classifier, computedfrom traces from our user study (see Section 5 for more details).Feature NameX position (in tiles)Y position (in tiles)Zoom levelPan flagZoom-in flagZoom-out flag4.2.1InformationRecordedX positionY positionzoom level ID1 (if user panned), or 01 (if zoom in), or 01 (if zoom out), or 0Accuracy forthis Feature0.6760.6920.6960.5800.5560.448Learning Analysis PhasesWe informally observed several users browsing array-based datain SciDB, searching for common interaction patterns. We usedthese observed patterns to define a user analysis model, or a generalpurpose template for user interactions in ForeCache. Our user analysis model was inspired in part by the well-known Sensemakingmodel [19]. However, we found that the Sensemaking Model didnot accurately represent the behaviors we observed. For example, the Sensemaking model does not explicitly model navigation,which is an important aspect of browsing array data. Thus, weextended existing analysis models to match these observed behaviors. We found that our users alternated between three high-levelanalysis phases, each representing different user goals: Foraging,Sensemaking, and Navigation. Within each phase, users employeda number of low-level interaction patterns to achieve their goals.We model the low-level patterns separately in the bottom half ofour prediction engine, which we describe in detail in Section 4.3.In the Foraging phase, the user is looking for visually interestingpatterns in the data and forming hypotheses. The user will tend tostay at coarser zoom levels during this phase, because these levelsallow the user to scan large sections of the dataset for visual patterns that she may want to investigate further. In the Sensemakingphase, the user has identified a region of interest (or ROI), and islooking to confirm an initial hypothesis. During this phase, the userstays at more detailed zoom levels, and analyzes neighboring tilesto determine if the pattern in the data supports or refutes her hypothesis. Finally, during the Navigation phase, the user performszooming operations to move between the coarse zoom levels of theForaging phase and detailed zoom levels of the Sensemaking phase.4.2.2Predicting the Current Analysis PhaseThe top half of our two-level scheme predicts the user’s currentanalysis phase. This problem is defined as follows:Sub-Problem Definition: given a new user request r and theuser’s session history H, predict the user’s current analysis phase(Foraging, Sensemaking, or Navigation).To identify the current analysis phase, we apply a Support Vector Machine (SVM) classifier, similar to the work by Brown et al.[3]. SVM’s are a group of supervised learning techniques that arefrequently used for classification and regression tasks. We used amulti-class SVM classifier with a RBF kernel. We implementedour classifier using the LibSVM Java Library1 .To construct an input to our SVM classifier, we compute a feature vector using the current request r, and the user’s previous request rn H. The format and significance of each extracted featurein our feature vector is provided in Table 1. Because this SVMclassifier only learns from interaction data and relative tile positions, we can apply our classification techniques to any dataset thatis amenable to a tile-based format. To build a training dataset for1 https://github.com/cjlin1/libsvmAlgorithm 1 Pseudocode to update the last ROI after each request.Input: A user request r for tile TrOutput: ROI, a set of tiles representing the user’s last visited ROI.1: ROI {}2: tempROI {}3: inFlag False4: procedure U PDATE ROI(r)5:if r.move “zoom-in” then6:inFlag True7:t
Dynamic Prefetching of Data Tiles for Interactive Visualization Leilani Battle MIT Cambridge, MA 02139 leilani@csail.mit.edu Remco Chang Tufts University Medford, MA 02155 remco@cs.tufts.edu Michael Stonebraker MIT Cambridge, MA 02139 stonebraker@csail.mit.edu ABSTRACT In this pa