Transcription
CAFEECenter for Alternative Fuels, Engines & EmissionsWest Virginia UniversityHeavy-Duty Vehicle Diesel EngineEfficiency Evaluation and Energy AuditOctober 2014Final ReportArvind Thiruvengadam, Ph.D. – Principal InvestigatorSaroj PradhanPragalath ThiruvengadamMarc BeschDaniel CarderMechanical and Aerospace DepartmentWest Virginia University,Morgantown, WVOscar Delgado, Ph.D.The International Council on Clean TransportationWashington, DC
Table of ContentsEXECUTIVE SUMMARY . 11INTRODUCTION . 41.1BACKGROUND . 51.1.1Simulation Modeling of Fuel Consumption . 51.1.2Engine Transient Phenomena . 51.1.3Engine Efficiency and Loss Mechanisms . 61.1.4Engine Model . 72TEST ENGINE SPECIFICATION . 92.1US EPA 2010-COMPLIANT HEAVY-DUTY DIESEL ENGINE . 92.2LEGACY US EPA 2004 COMPLIANT HEAVY-DUTY DIESEL ENGINE . 102.3US EPA 2010 COMPLIANT MEDIUM-DUTY DIESEL ENGINE. 113EXPERIMENTAL SETUP . 133.1TEST CELL INTEGRATION . 134TEST PROCEDURE . 144.14.24.34.44.54.6ENGINE INSTRUMENTATION . 14ENGINE LUG CURVE . 15MOTORING PROCEDURE . 15FUEL MAP DEVELOPMENT . 15ENERGY AUDIT METHODOLOGY . 18WASTE HEAT RECOVERY SIMULATION . 205RESULTS . 235.1FUEL MAP CHARACTERIZATION . 235.1.1MY 2005 Mercedes OM460 . 235.1.2MY 2011 Mack MP8 505C . 245.1.3Difference between steady-state and transient maps . 265.1.3.1Transient Correction Factor . 295.25.35.45.1.4MY2011 Cummins ISB6.7 . 30AUTONOMIE FUEL MAP . 31ENERGY AUDIT . 325.3.1USEPA 2010 Heavy-Duty Engine Energy Audit . 335.3.2USEPA 2010 Medium-Duty Engine Energy Audit . 34FUTURE ENGINE PREDICTION . 355.4.1Oil Pump . 365.4.2Water Pump . 365.4.3Air Compressor . 375.4.4Exhaust Backpressure . 375.4.5Engine Friction . 385.4.6Prediction Methodology . 385.4.6.15.4.6.25.4.6.35.4.6.45.4.6.55.5Pumping Loss Improvements . 38Engine Accessories . 39Engine Friction . 39Exhaust Energy . 39Coolant Energy . 415.4.72017 Engine Map Analysis . 425.4.82020 Engine Map Analysis. 46REGULATORY CYCLE PREDICTIONS . 495.5.1Heavy-duty SET Prediction . 505.5.2Medium-duty FTP Prediction . 51ii
5.6WASTE HEAT RECOVERY . 525.6.1USEPA 2010 Heavy-Duty Diesel Engine WHR Model . 535.6.2USEPA 2010 Medium Duty Diesel Engine WHR Model . 556CONCLUSIONS . 577REFERENCES. 598APPENDIX . 61iii
ACKNOWLEDGEMENTSThe West Virginia University Center for Alternative Fuels, Engines and Emissions would like to thankthe International Council for Clean Transportation (ICCT) for funding this study. We thank VolvoTechnology North America for supporting test cell integration of their engine, and thank Cummins Inc.for donating a medium-duty diesel engine for research purposes. In addition, we thank the Cummins andVolvo teams, Dr. Rachel Muncrief, and Fanta Kamakaté, for their reviews and input on an earlier versionof the report. We also thank Dr. Oscar Delgado for being the technical lead from the ICCT and Dr. NicLutsey for providing valuable inputs during the course of the study.iv
EXECUTIVE SUMMARYThe modern diesel engine, the primary propulsion source for most heavy-duty vehicle freight movement,is subject to many design constraints, including durability, efficiency, and low emissions. The moststringent emission regulations, for example those in the United States and Europe, require greatly reducedoxides of nitrogen and particulate matter emissions. Heavy-duty vehicle fleet operators and freightshippers demand increased engine efficiency and reliability. Increasingly, new efficiency and greenhousegas (GHG) emission standards are requiring further improvements in engine efficiency.This work sought to further understand the engine efficiency, energy losses, and prospects forimprovement in diesel engines for heavy-duty vehicles. The project’s approach involved laboratoryengine testing and analysis of heavy-duty and medium-duty diesel engines that are compliant with the2010 U.S. Environmental Protection Agency (US EPA) emissions standards. The two primary referenceengines tested were a model year 2011 12.8-liter heavy-duty diesel engine, a representative engine forClass 8 tractor-trailers, and a model year 2013 6.7-liter medium-duty engine, representative of Class 4-6trucks (e.g., urban delivery, vocational). In addition, data from industry colleagues and from the researchliterature were utilized to understand the change in energy flows and losses due to various efficiencytechnologies.The two primary outputs from this study were the characterization of the engines’ fuel consumption maps,and detailed energy audit analyses across varying engine speed-load conditions. The engine mapping offuel consumption included laboratory testing on a 40 CFR 1065 compliant engine dynamometerlaboratory at West Virginia University’s Center for Alternative Fuels, Engines and Emissions (CAFEE).The process to develop the engine maps included test cycles created using design of experiments (DOE)and curve fitting approach to ascertain a wide range of fueling events that cannot be captured bytraditional steady-state test cycles such as the Supplemental Emission Test (SET) and EuropeanStationary Cycle (ESC). The energy audits utilized data that included in-cylinder pressure measurementsto estimate indicated work, flow rate and temperature measurements at various locations of the engine toestimate energy flows, and motoring and individual component testing to estimate friction and pumpinglosses.The reference heavy-duty diesel engine converted 39.1% of its fuel energy to brake power over the SETengine cycle, with 35.5% lost as exhaust heat, 10.6% lost to engine coolant heat transfer, 6% lost throughheat rejected from the charge air cooler (CAC), 3.4% lost as heat to the surrounding ambient air, 2.3%lost to friction of engine components, 1.7% lost to engine pumping, and 1.3% consumed by parasiticlosses due to engine accessories such as water and oil pumps. The contribution of EGR cooling to theengine coolant circuit is of the order of 46% of the total heat carried by the coolant. While the referencemedium-duty diesel engine over the FTP cycle converted 29.2% of its fuel energy to brake power, 31.4%of fuel energy was lost through exhaust gases, 18.4% of energy loss is attributed to friction and pumpingloss, 10% of fuel energy was rejected through the coolant circuit, CAC rejected 5% of fuel energy, 3.6%of fuel energy is attributed to heat transfer to ambient air, and 2.4% of fuel energy was consumed byengine accessories.The assessment investigated emerging technologies that have the ability to reduce fuel consumption bytargeting different energy loss mechanisms. Two potential future engines were analyzed: (1) a “2017engine” for compliance with heavy-duty vehicle GHG engine standards, and (2) a “2020 engine” thatutilizes more advanced technologies for further fuel consumption reduction from the reference dieselengine. The investigation of emerging technologies to achieve the increased efficiency includesimprovements to combustion from increased compression ratio and peak in-cylinder pressures. In1
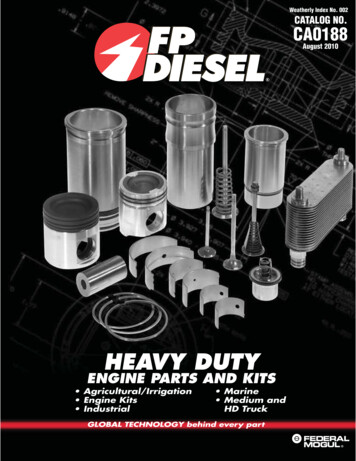
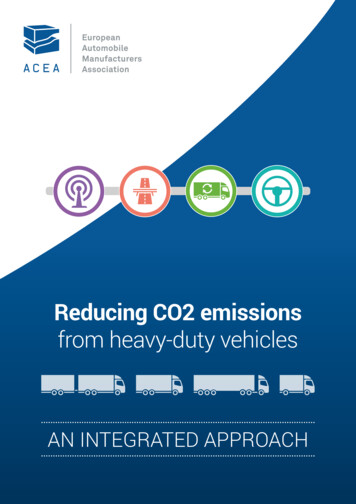
addition, reduction in pumping losses through low-pressure drop aftertreatment systems, low pressuredrop EGR loops, reduced EGR and improved turbocharging technology were considered. The reductionin frictional parasitic losses was attributed to the development of advanced lubricants, engine materialcoatings that lower friction, variable speed water pump and oil pump. Finally, a simulation of an OrganicRankine Cycle (ORC) waste heat recovery (WHR) system was performed to assess its contributiontowards engine efficiency improvements.The simulation focused on using a thermodynamic approach to project fuel consumption of future enginetechnologies by reducing individual loss categories by a certain magnitude as identified by technologypathways through previous research. Estimated 2017 fuel consumption maps were developed to representengine fuel consumption that would achieve compliance with the US EPA greenhouse gas standard(GHG) for heavy- and medium-duty engines. Figure 1 illustrates the total energy consumed over theregulatory SET cycle for the reference 2010, estimated 2017, and 2020 and later engines. The estimated2017 engine technology achieved an average 7.9% fuel consumption reduction over the SET enginecycle, while the more advanced 2020 engine achieved an average 18.3% fuel consumption reduction incomparison to baseline 2010 heavy-duty engine. The peak BTE of the 2020 engine was projected to be49%, and the waste heat recovery simulation improved the BTE of the 2020 engine to 52%. Thereductions were based on a baseline 2010 engine, with a brake-specific CO2 of 498 g/bhp-hr over theSET. The baseline brake specific-CO2 emissions is an approximation based on the mass of fuel consumedand not a result of emissions measurement. The fuel consumption reduction for the 2017 engine wasfactored to achieve at a minimum the 2017 CO2 standard of 460 g/bhp-hr.Figure 1 Energy audit results for reference heavy-duty engine, and estimated 2017 and 2020 engine technologies over the SET cycle2
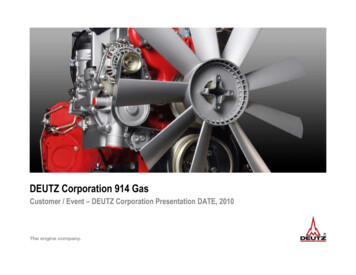
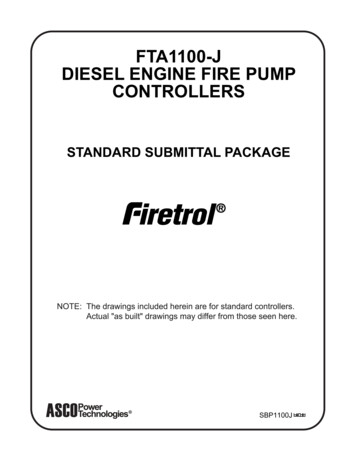
The energy distribution of a reference 2013 medium-duty engine and the estimation of its energydistribution for 2017 and 2020 engine technologies over the FTP are shown in Figure 2. The 2017medium-duty technology resulted in 10.6% reduction in estimated fuel consumption compared to thereference 2013 engine to achieve at a minimum 2017 US EPA standard of 576 g/bhp-hr CO2. The fuelconsumption reduction for the advanced 2020 medium-duty engine was projected to be 19.5%.Figure 2 Energy audit results for reference medium-duty engine, and estimated 2017 and 2020 engine technologies for the FTP cycleThe assessment of potential future engine characteristics presented in this study considers a best-casescenario of chosen technology advancements. The study presents a holistic view of the possible benefitsthat could be achieved by improving certain loss mechanisms. An objective of the fuel consumptionanalysis performed in this study was to develop a 2017 engine fuel map that would be compliant with theSET 460 gCO2/bhp-hr heavy-duty and with the FTP 576 gCO2/bhp-hr medium heavy-duty GHGstandards for 2017 and beyond. The distribution of energy among the various loss categories in real-worldfuture engines could be different from the projections shown in this study, since the energy distribution offuture engines will be dependent on the actual pathways and technology approaches adopted by thevarious manufacturers.This research makes novel contributions in providing a detailed breakdown of engine energy loads andlosses for a modern diesel engine, as well as estimates of technical efficiency potential for future engines.The research points to many areas where future research will better inform the potential for heavy-dutydiesel efficiency improvements. For example, integrating an energy flow study of this kind with fullvehicle simulation will be critical to understanding the engine-transmission and powertrain-vehicle loadinteractions with emerging efficiency technologies for the 2020-2030 timeframe.3
1 INTRODUCTIONThe heavy-duty diesel engine, the primary propulsion source for most heavy-duty vehicle freightmovement, is subject to many design constraints, including durability, efficiency, and low emissions.There is a need for increased engine efficiency and reliability by heavy-duty vehicle fleet operators andfreight shippers. More stringent fuel consumption and greenhouse gas (GHG) emission standards arerequiring further improvements in engine efficiency.The transportation sector is one of the largest consumers of petroleum in the U.S. Heavy-duty vehiclediesel consumption is projected to increase for the next several decades, while the largest energy user inthe transportation sector, automobiles, is projected to have declining fuel use (EIA, 2013).With recent presidential directives to improve energy security, Environmental Protection Agency (EPA)and National Highway Traffic Safety Administration (NHTSA) introduced the standards to reduce fuelconsumption and GHG emissions. The standards are aimed at improving fuel economy of heavy- andmedium-duty trucks, buses, and commercial pickups and vans (USEPA, 2011). The adoption of the firstphase of standards will be phased in from 2014-2018 and seeks to reduce GHG by nearly 250 millionmetric tons and 500 million barrels of crude oil (USEPA, 2011). Deliberations toward a second phase ofheavy-duty vehicle standards for 2020 and beyond have begun (White House, 2014), further motivatingquestions about technology potential, availability, and cost.With the recent focus on fuel economy and GHG emissions, regulatory agencies are increasingly relyingon vehicle simulation tools that allow the prediction of fuel consumption and GHGs for a variety ofvehicles over different test cycles. The heavy-duty fleet is very diverse in both vehicle configuration andactivity patterns, so the use of simulation makes strong practical sense for reducing the time required forfuel economy testing. In the U.S., the Greenhouse Gas Emission Model (GEM) is helping regulatoryagencies as a regulatory tool. While in Europe, the VECTO model, will serve as the regulatory CO2emissions reporting tool.Simulation tools such as Autonomie developed by Argonne National Laboratory and IGNITE by Ricardo,have become widely accepted methods to predict vehicle fuel consumption from a combination of engine,powertrain and chassis design features. These simulation tools have afforded researchers and regulatorsthe ability to model an entire vehicle based on component block models and to further exercise thevehicle simulation over different vehicle driving cycles. One of the salient features of such physics-basedmodels is that the flow of energy through the various subsystems can be visualized to better understandthe losses and energy recovery systems that possibly affect fuel economy. Vehicle simulation modelsoffer the capacity to change vehicle parameters that affect the road load equation and auxiliary loadingsystems in vehicles to understand their effects on fuel consumption without elaborate experimental testprocedures. The accuracy of the prediction, however, is directly dependent on the accuracy of the modelblocks that represent the various components of the vehicle. For instance, the accuracy of the road load ona vehicle is direct manifestation of the real-world aerodynamic drag area, vehicle weight, and tire rollingfriction inputs.Of the many components of a vehicle simulation model, the engine fuel map as a function of speed andtorque is vital to calculate fuel consumption when simulating driving cycles. The accuracy of the fuel mapin reflecting real-world engines will contribute to a representative fuel consumption profile of a vehicle.4
The West Virginia University (WVU) Center for Alternative Fuels, Engines and Emissions (CAFEE)collaborated with the International Council for Clean Transportation (ICCT) to quantify the efficiency,energy losses, and prospects for efficiency improvements in diesel engines for heavy-duty vehicles. Theproject entails experimentally characterizing accurate fuel maps of representative US EPA 2010compliant heavy-duty and medium-duty diesel engines. The developed fuel maps serve as inputs for theengine block in Autonomie for complete vehicle and powertrain simulation. The global objective of thestudy is to accurately estimate the fuel efficiency of US EPA 2010 heavy-duty diesel vehicle usingAutonomie and further analyze 2017 and future heavy-duty fuel efficiency by considering technologyadvancement associated with the powertrain.The specific objectives of the study are as follows:1) Characterize the fuel map of two US EPA 2010 compliant diesel engines using enginedynamometer testing and conduct an energy audit to quantify their energy losses.2) Utilize the data and underlying detailed energy audit analysis of the US EPA 2010 compliantengine with technology predictions to develop a fuel map for an engine that is representative ofUS EPA and NHTSA 2017 GHG and fuel efficiency standards.3) Assess the potential for advanced energy efficiency technologies for the 2020-2030 timeframeand provide a fuel map and a detailed energy audit for an engine that incorporates thosetechnologies.4) Develop a waste heat recovery (WHR) simulation based on energy flows from the energy auditconducted on the US EPA 2010 engine.5) Analyze the differences between engine operation in steady-state and transient conditions toapproximate a transient correction factor to estimate the difference at various engine load points.1.1Background1.1.1 Simulation Modeling of Fuel ConsumptionDetailed engine models such as GT-Power can generate high fidelity simulation results. In these models,engine performance can be characterized at crank-angle resolution. These combustion-level models havethe ability to capture transient phenomena like turbo lag or precise injection timing. GT-Power offers anintermediate step namely “Fast Running Model” which simplifies many of the flow paths but retains acrank-angle resolution of the engine performance parameters. This model runs significantly faster than adetailed engine model (close to real time) but must be tuned for the operating range in order to accuratelyreflect the detailed engine. Engines can also be modeled using performance maps that describe theoperating characteristics of the engine across the speed-load range. This map-based engine can besimulated using vehicle simulation software such as Autonomie where the power demand to the engine isdescribed as a continuous function of vehicle and duty cycle parameters. A map-based model iscomputationally inexpensive and is very well suited for studies such as drive cycle analysis or fuelefficiency calculation to capture vehicle-level phenomena with a substantial reduction in computationaltime.1.1.2 Engine Transient PhenomenaAn engine’s transient performance depends on various design features adopted by the OEM. For instance,the design and calibration of the Variable Geometry Turbocharger (VGT) dictates the type of throttleresponse that engine will produce. Engine manufacturers emphasize on performance, emissions andaftertreatment activity as primary transient operation criteria. Hence, significant differences can be5
observed between extended steady-state operation and transient activity. OEMs strive to achieve the bestpossible fuel economy within regulatory standards and as a result include subtle differences in theirtechnology and control strategy.Distribution of energy losses change continuously during transient engine operation and the monitoring ofthe energy distribution on a temporal resolution is highly challenging. Changing DPF soot loading anddesired EGR mass flow rates contribute to variations in pumping loss of the engine, further auxiliarydevices such as the water pump, oil pump and fuel pump act as variable parasitic losses across the enginelug curve. The thermodynamic state of the engine and oil also affect the lubrication and convective andradiative heat transfer from engine surfaces. Therefore, data driven energy distribution models fordifferent regions of the lug curve are needed to characterize the flow of energy as a function of speed andtorque.1.1.3 Engine Efficiency and Loss MechanismsFigure 3 illustrates a hypothetical energy audit for an engine over a particular operating condition. Theproportion of the fuel energy1 that is converted into indicated work (i.e. work done on the piston) is adirect measure of the engine’s fuel conversion efficiency. Irreversibility during the combustion process(fluid friction, mixing, rapid expansion) affect the amount of work extraction by the piston, the energyleaving the engine cylinder as heat, and the energy remaining in the exhaust at the end of theexpansion process. These indicated efficiency losses represent fuel energy that was not converted intowork during the combustion process. Moreover, not all of the energy that is converted into work done onthe piston makes it to the final engine shaft output. Some of the energy is used in overcoming enginefriction at the bearings and piston-cylinder interface, some is used to pump air into the engine and exhaustgases out of the engine (pumping losses), and some is used to power engine auxiliaries and accessories(e.g., water pump, oil pump, fuel pump, cooling fan, alternator, power steering fluid pump, compressorfor cabin air conditioning). The brake thermal efficiency value, expressed as a percentage, is the ratiobetween the useful work at the engine shaft output and the fuel energy input. Note that it is commonpractice to exclude some accessories during engine testing and the excluded accessories may varydepending on the engine laboratory standard practices.Figure 3. Energy loss mechanisms within an engine energy audit.1Fuel energy fuel mass (kg) x fuel lower heating value (MJ/kg).6
Figure 4 shows the historical changes in heavy-duty engine BTE mainly due to changes in emissionsregulation and advancements in engine technology. The figure shows engine BTE over the FTP andUDDS cycles calculated from WVU’s large database of engine and chassis dynamometer test data. Thefigure also displays historical values of peak BTE calculated from brake-specific fuel consumptionpresented by Volvo at 2011 DEER conference (Greszler, 2011). The figure shows the range ofefficiencies that might be expected from differences in cycle characteristics and engine operational loadsthat change the magnitude and distribution of engine losses. Highest engine efficiency is not realizedthroughout transient cycles and operational characteristics affect the overall BTE of the engine. Evenwhile US EPA regulations have reduced NOx and PM standards by over 95% between 1992 and 2010,heavy-duty engine have shown progress towards improved fuel efficiency, with the exception of the postconsent decree (model year 2004) engines that show an approximate 6% decrease in BTE. This drop inengine efficiency could be related to the regulation by the US EPA to the OEMs to achieve a NOxstandard of 2.4 g/bhp-hr from an earlier 1998 standard of 4.0 g/bhp-hr without the use of defeat devices.OEMs products achieved this emissions reduction without the use of any NOx aftertreatment systems.The pathway to this emissions reduction could have directly affected the engine efficiency during thisperiod. Since then, a simultaneous improvement to engine and aftertreatment technology with acorresponding decrease in emissions have enabled OEMs to simultaneously develop more efficient andcleaner diesel engines.Figure 4 Historical changes in heavy-duty engine efficiency from WVU FTP and Volvo peak BTE(Greszler, 2011) data1.1.4 Engine ModelNumerical models that simulate engine performance are vital to understand and predict the potential of7
future engine technologies to improve engine efficiency. However, these models require a complexunderstanding of engine behavior and accurate design inputs to accurately predict engine energy flows.Modern heavy-duty diesel engines have multiple control algorithms that OEMs could potentially changedepending on emissions compliance and fuel economy targets. Therefore, accurate data driven enginemodels are imperative for successful prediction of energy flows and fuel consumption of current andfuture heavy-duty diesel engines.Simulation tools such as Autonomie do not require detailed engine models to predict fuel consumption.Autonomie works with a fuel look-up table for respective speed and torque to interpolate appropriate fuelconsumption rates. Therefore, a data driven approach is necessary to develop these fuel map inputs forAutonomie to predict fuel economy on various real-wor
The heavy-duty diesel engine, the primary propulsion source for most heavy-duty vehicle freight movement, is subject to many design constraints, including durability, efficiency, and low emissions. There is a need for increased engine efficiency and reliability by heavy-du


![Bosch ESI[truck] Heavy Duty Truck Software Update – Q2 .](/img/22/bosch-esitruck-heavy-duty-truck-release-notes-details-2019-2-0-0-0.jpg)