Transcription
Predictive Modeling ofBuilding Fire RiskMetro21: Smart Cities Initiative
Predictive Modeling ofBuilding Fire RiskDesigning and evaluating predictivemodels of fire risk to prioritizeproperty fire inspections
A M ETRO 21 RESEARCH PROJECT, C ARNEGIE M ELLON U NIVERSITYM ETRO 21: S MART C ITIES I NITIATIVEThe Metro21: Smart Cities Initiative takes a forward-looking creative approach to bringing people, policy and technology together to significantly improve the quality of life for metropolitanarea citizens. The multidisciplinary effort employs research, development and deployment tacticswith key partners to create and test smart city solutions. CMU’s collaborative relationship withthe City of Pittsburgh, Allegheny County and other government agencies has produced successfuloutcomes that are already being implemented in additional metro areas. Cities worldwide face thesame imminent challenges. The work of Metro21 provides a global model for innovative future cities.ACKNOWLEDGMENTSThis was a Metro21: Smart Cities Initiative project, conducted under the supervision of MichaelMadaio from January to October of 2017, with generous financial support provided by the HillmanFoundation. Special thanks are due to our partners at the Bureau of Fire: Chief Darryl Jones, ChiefNorman Auvil, Chief Thomas Cook, Lt. Jason Batts, Inspector Chris Skertich, and our partnersat the Department of Innovation and Performance: Laura Meixell, Geoffrey Arnold, and MaxwellCercone, among many others. Student contributors to this project were: Qianyi Hu and BhavkaranSingh, Fangyan Chen, Jeffrey Chen, Nathan Kuo, Jessica Lee, Palak Narang, Amaya Taylor, andSophia Yoo. Thank you to Rick Stafford and Jeff Chen for the stimulating discussion and support.This publication is available in Open Access under the Attribution-ShareAlike 3.0 IGO (CC-BY-SA3.0 IGO) license /). The present license appliesexclusively to the text content and graphics of this publication. For the use of any photo, permissionmust be obtained from the Pittsburgh Bureau of Fire. The ideas and opinions expressed in thispublication are those of the author, and do not necessarily reflect those of Metro21, Carnegie MellonUniversity, Pittsburgh Bureau of Fire, or Pittsburgh Department of Innovation and Performance.AUTHOR : Michael A. MadaioT EMPLATE : c Michael A. Madaio 2018, under the LaTeX Project Public License (LPPL) 1.3c,adapted from a template by Mathias Legrand and Andrea Hidalgo.P HOTO C REDITS : p1, 4, 6, 8, 11, 16, 21, 25, 27, 30 c Pittsburgh Bureau of Fire p14, Figure 3.3 "Wikipedia: Precision and Recall" by Walber / CC BY-SA 4.0C ODE REPOSITORY: https://github.com/CityofPittsburgh/fire risk analysisS UGGESTED CITATION : Metro21: Smart Cities Initiative (2018). Predictive Modeling of BuildingFire Risk: Designing and evaluating predictive models of fire risk to prioritize property fire inspections. Metro21 Research Publication.For inquiries about the contents of this report or the code in the repository, contact: mmadaio@cs.cmu.edu.For general inquiries about Metro21, media relations, or partnership opportunities please contact:karenlightman@cmu.edu.www.metro21.cmu.edu
Contents1Executive Summary . . . . . . . . . . . . . . . . . . . . . . . . . . . . . . . . . . . . . . . . . . . . cations72Related Work . . . . . . . . . . . . . . . . . . . . . . . . . . . . . . . . . . . . . . . . . . . . . . . . . . . 92.1Fire Inspection Prioritization2.2Urban Fire Risk Analysis102.3Risk-based Fire Inspections113Methodology . . . . . . . . . . . . . . . . . . . . . . . . . . . . . . . . . . . . . . . . . . . . . . . . . . 133.1Data Sets133.2Data Pre-Processing133.3Model Construction153.4Model Comparison154Findings . . . . . . . . . . . . . . . . . . . . . . . . . . . . . . . . . . . . . . . . . . . . . . . . . . . . . . . 184.1Overview184.2Model Performance189
54.3Feature Importance194.4Analysis of High-Risk Properties205Deliverables . . . . . . . . . . . . . . . . . . . . . . . . . . . . . . . . . . . . . . . . . . . . . . . . . . . 235.1Deployed Risk Model235.2Data Visualizations235.2.15.2.2Data Dashboard . . . . . . . . . . . . . . . . . . . . . . . . . . . . . . . . . . . . . . . . . . . . . . . . . 24Interactive Map . . . . . . . . . . . . . . . . . . . . . . . . . . . . . . . . . . . . . . . . . . . . . . . . . . 246Next Steps . . . . . . . . . . . . . . . . . . . . . . . . . . . . . . . . . . . . . . . . . . . . . . . . . . . . 266.1Improvements to Model Performance266.2Extensions to Residential Properties277Discussion . . . . . . . . . . . . . . . . . . . . . . . . . . . . . . . . . . . . . . . . . . . . . . . . . . . . . 287.0.17.0.2Risk . . . . . . . . . . . . . . . . . . . . . . . . . . . . . . . . . . . . . . . . . . . . . . . . . . . . . . . . . . . . 28Trust . . . . . . . . . . . . . . . . . . . . . . . . . . . . . . . . . . . . . . . . . . . . . . . . . . . . . . . . . . . 297.1Conclusion29
1. Executive Summary1.1MotivationIn 2016 alone, there were 475,500 structure fires in the United States, causing 2,950 civilian deaths,12,775 civilian injuries, and 7.9 billion in property damage [1]. Municipal fire departments, asthe Authority Having Jurisdiction (AHJ), are responsible for enforcing applicable fire codes toreduce the risk of structure fires. The City of Pittsburgh’s Bureau of Fire (PBF), like many othermunicipal fire departments, conducts regular inspections of various types of commercial, industrial,and governmental (here, "non-residential") properties to ensure that they comply with the city’sCode of Ordinances [12] for fire prevention and safety. Such inspections are intended to detect codeviolations that, if left uncaught, may result in loss of life, as seen in recent high-profile fire incidentssuch as the Grenfell Towers in London [3], the “Ghost Ship” warehouse fire in Oakland in 2016 [15],or the Deutsche Bank fire in New York in 2007 [6]. However, many municipal fire departments areunable to inspect all commercial properties in their city on an annual basis [13], and must thereforedetermine which subset of properties warrants annual inspection. To determine this, many firedepartments rely on a legacy system of inspections conducted on the basis of pre-existing permits,or, at best, a rule-based heuristic for determining which properties warrant inspection. However,these existing approaches to determining inspection priority do not involve a risk-based evaluationof the fire risk of the properties to be inspected. As such, existing approaches to fire inspectioncould be significantly enhanced by the adoption of risk-based data-driven processes for identification,selection, and prioritization of new properties to inspect [11, 10].1.2MethodologyTo address this gap in fire inspection prioritization, we have developed a predictive model todetermine property-level fire risk (i.e. likelihood of a given property having a fire incident in agiven 6-month time period). To develop our model, we use data from historical fire incidents from2009-2017, property assessment and valuation data from Allegheny County, and non-fire-relatedinspections and violations (e.g. noise and sanitation) from the City of Pittsburgh Department ofPermits, Licenses, and Inspections. We join these data at an address level, and use machine learning
1.3 Findings7models to predict the likelihood of a fire for a given address for a 6-month window, by "training"the model on the first 7.5 years of data on historical fire incidents, and evaluating the model on atest set which was not used for training. The output of this predictive model is a set of risk scoresfrom 1-10 (lowest risk to highest) for the 20,806 non-residential properties in the City of Pittsburgh.We have displayed these results on a private instance of the city’s geo-information visualizationtool, "Burgh’s Eye View," for fire inspectors and fire chiefs to use to identify high-risk propertiesof various property usage types. We also provided Pittsburgh Bureau of Fire with a dashboard toinspect the fire risk scores, to easily compare risk scores of neighborhoods, fire districts, or propertytypes, and output those data as an image or spreadsheet with detailed property information to use intheir strategic planning.1.3FindingsOur predictive model is able to predict the presence of a fire incident (any code 100) in a particularaddress for a given 6-month window with a predictive performance better than the prior state-ofthe-art. For any given 6-month window, we are able to accurately detect over half (55%) of thefire incidents that occurred (aka, the "recall" metric of the model). Considering the small numberof code-100 fire incidents in a 6-month window ( 50) compared to the number of non-residentialproperties in the city ( 20,000), if we were to guess randomly, we would only be correct 0.21%of the time, instead of 55%. As this is the first risk-based model to be deployed in Pittsburgh(and, to our knowledge, the 3rd in the country, after New York and Atlanta), we cannot comparethis performance to PBF’s existing risk assessment. At the time of this writing, we find that 164properties are classified as high risk (score 7-10), 596 as medium risk (score 4-6), and the remainingproperties as low risk (score 1-3). The most common property types in the high-risk properties areapartments of 40 units (18 properties), apartments of 5-19 units (15 properties), properties ownedby the Board of Education (14 properties), charitable exemption (9), and independent living forseniors (8). Our predictive model also identified the most predictive features of fire risk, whichincluded unintentional alarm or smoke detector activation, gas leaks, or electrical wiring problems inthe 6-months preceding a predicted fire, as well as the lot area and fair market building value of theproperty, and other features.1.4ImplicationsThe fire risk prediction model is currently deployed to the Pittsburgh Bureau of Fire’s server, whereit re-runs every week, generating new risk scores based on the most up-to-date fire and propertydata. PBF fire chiefs and inspectors are able to use the fire risk scores to inform their day-to-dayinspections and high-level inspection planning. As with any predictive model, the fire risk scores arean estimate of the likelihood for a particular outcome (i.e. fire incident) to be true, and contain someuncertainty (discussed in more detail in Section 7). These risk scores are intended to be used as partof a comprehensive process of risk assessment and decision-making, which may incorporate not onlythe likelihood of a fire occurring, but also the potential for loss of life or property damage. Therefore,these risk scores should complement, not replace, existing PBF risk assessment and strategic planningfor fire inspection, as there may be factors unknown to the model (e.g. the mobility of residents, as inindependent living facilities for seniors) that may be critical to informing fire inspection procedures.We believe predictive models for fire risk can be an essential asset to a modern, data-driven approachto fire risk reduction in urban environments, augmenting the practitioner knowledge of the fire
8Chapter 1. Executive Summaryinspectors and fire chiefs and helping contribute to greater municipal public safety.
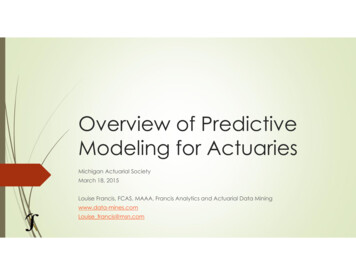
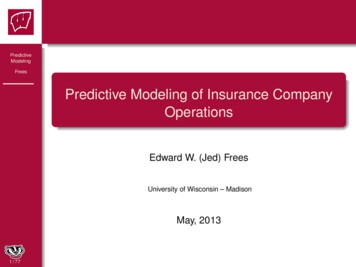
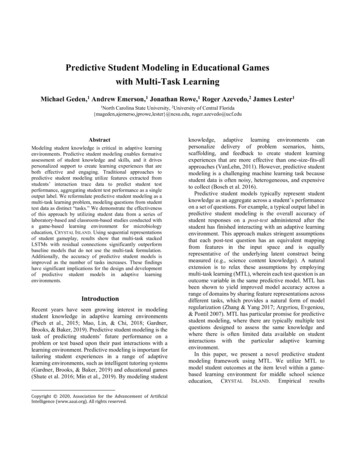
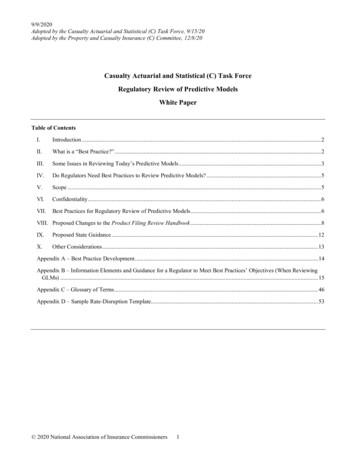
2. Related Work2.1Fire Inspection PrioritizationAs described in Section 1, the number of inspectable properties (i.e. non-residential) in urban areasfar outstrips the capacity of most municipal fire departments to conduct regular fire inspectionsof all such properties. For a clear visualization of this disparity, see Figures 2.1 and 2.2 to see,respectively, the distribution of currently inspected properties in Pittsburgh (in green), and the fullset of potentially inspectable (i.e. non-residential) properties in Pittsburgh (in blue). However, notall of these non-residential properties require inspection, and certainly not all with the same level ofpriority.Figure 2.1: Inspected properties in Pittsburgh (in 2016)Therefore, municipal fire departments face a choice about how to best prioritize their inspectionefforts. To do this, many fire departments rely on stipulations in their municipal fire codes, typically
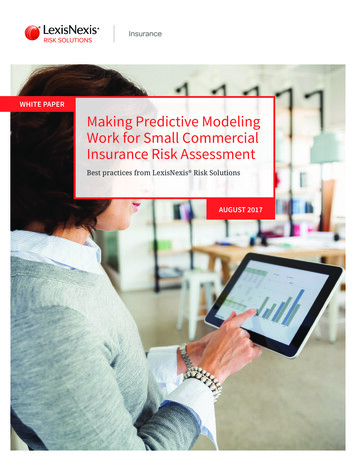
10Chapter 2. Related WorkFigure 2.2: Non-residential properties (Commercial, Governmental, Industrial, Utility) in Pittsburghan adaptation of the National Fire Protection Association (NFPA)’s fire code, which identifies theproperty usage types (e.g. restaurants, apartments, etc) or the characteristics (e.g. contains flammableor explosive materials, etc) of the properties requiring inspection [12]. However, the fire code doesnot provide inspectors with a method for determining which properties from those usage typesrequire inspection at greater priority or frequency. As a result, municipal fire departments are oftenleft with a legacy inspection protocol where properties are inspected only after they have previouslyhad fire incidents, or where inspectors have some reason to believe they may have some fire safetyviolations [11].Prior work from Garis and Clare (2014) has developed a set of heuristics for determining thefrequency of commercial property fire inspections, using characteristics about properties underconsideration [9]. They scored each property by its level of compliance on prior inspections andby a set of risk metric components such as building classification, age, and presence of sprinklers.However, as they acknowledge, the weights and selection of those components were chosen by handbased on their fire code, and not based on historical data about features that were highly predictive offires, which we utilize in our work. This approach, while better than a legacy approach to inspection,or one without any frequency prioritization at all, may be subject to bias from the creators of thehandcrafted weights and rules, and is not likely to be flexible and improve over time with new data.2.2Urban Fire Risk AnalysisTo address this gap, several municipal fire departments have begun to adopt risk-based inspectionpractices, using available data of historical fire incidents and property conditions to build predictivemodels of structural fire risk through data science and machine learning methods. See Figure 2.3 fora visualization of the building fires in Pittsburgh over the last 8 years.Prior work in data-driven urban fire risk analysis, such as [5, 8], has often conducted theiranalyses at the regional or census block level, rather than the property- or address-level, which isthe level that most municipal fire inspectors are assigned to inspect. For instance, [5] undertook arandomized controlled trial of community fire risk education efforts, to experimentally determinerisk levels of residential communities. However, their method for identifying the high-risk areas
2.3 Risk-based Fire Inspections11Figure 2.3: 8 years of building fires in Pittsburgh (2009-2017)was to create a map of the distribution of residential structure fires and draw ellipses to capturethe areas of densest concentration of fire incidents. A more statistical approach, as seen in [8]’swork on optimizing smoke-alarm inspections, joins data from the American Community Survey andAmerican Housing Survey to predict census blocks most likely to have homes without functioningsmoke alarms, using a Random Forest algorithm.We differ from [8] in that our model generates a fire risk score instead of the likelihood of nothaving a smoke alarm, we generate a risk score for individual properties, rather than census blocks,and we target non-residential properties that are able to be inspected, rather than residential (seeSection 6 for a discussion about residential risk prediction efforts).2.3Risk-based Fire InspectionsThe nearest precedents for our work here are (1) the "Risk-Based Inspection System" developed bythe New York Mayor’s Office of Data Analytics with the Fire Department of New York (FDNY) [6]and (2) the "Firebird" fire risk prediction framework developed by the Data Science for Social Goodprogram in partnership with the Atlanta Fire Rescue Department (AFRD) [10, 11].In New York City, in response to high-profile fire incidents such as the Deutsche Bank fire, theMayor’s Office of Data Analytics launched a “risk-based inspection system” in 2013 using datafrom structural features and behavioral indicators to predict the fire risk of a building and prioritizethe property inspections appropriately [6]. They built a data-driven model to identify structuresat greatest fire risk, to better prioritize FDNY’s inspection process, using a set of structural andbehavioral information about those properties. However, because the model was proprietary, andno details about its model construction, accuracy, or other model performance metrics were madepublic, it is difficult for other municipalities to benefit from this work or to compare their workagainst a performance benchmark from FDNY.In 2015, the Atlanta Fire Rescue Department (AFRD) partnered with Georgia Tech’s Data Sciencefor Social Good (DSSG) program to develop “Firebird”, an open-source framework for identifyingand prioritizing commercial property inspections [10, 11]. Atlanta faced a challenge similar tomany municipalities – the need for a reliable, accurate method for prioritizing the commercial
Chapter 2. Related Work12properties requiring inspection, based on the Fire Code of Ordinances’ requirements and using datafrom their Office of Buildings’ business licenses, among other sources. Such a database wouldprovide a foundation for prioritizing the necessary commercial property inspections. The DSSGteam developed a predictive risk model based on 1) historical fire incident data from 5 years of fires,and 2) commercial property data collected from their Office of Buildings and a commercial realestate property data set (from the CoStar property group). This model was designed for AFRD’sCommunity Risk Reduction Section to use for human resource allocation and strategic inspectionplanning, as well as for their front-line fire inspectors to plan their monthly and daily commercialproperty inspections, based on the risk score assigned by the predictive model.However, their model was developed in summer 2015, and was not designed to operate ondynamic, temporal data, such as that included in other AFRD fire incident codes (i.e. fire incidentsnot of code 100 (building fires)), non-fire inspection violations (e.g. noise or sanitation violations), or311 requests, etc. Due to the highly dynamic nature of much civic data, even purportedly "static" datasuch as property size, assessed value, property condition, or even property usage data may changeover time as properties are bought, sold, renovated, and closed. Therefore, without incorporatingtemporal data, the Firebird model was unable to be updated on a regular basis, and as such providedmerely a snapshot in time of the risk levels of the summer 2015, which are likely to be out ofdate soon after generation. To address this, our model is deployed on the Pittsburgh Bureau ofFire’s server, taking in new data from various sources on a weekly basis and retraining the model,generating new risk scores every week.Other recent related work includes work from Jonathan Jay, who used open civic data to build apredictive model of residential fire risk in Baton Rouge1 and conducted analyses of fire incidentsin Boston2 . Others, like the Code for San Francisco’s data science brigade, have used the Cityof San Francisco’s open data about fire incidents to conduct analyses of fire data and visualize itusing CartoDB3 . The author of this report has been in discussions with researchers from both ofthose projects over the duration of this work, discussing best practices for model construction andevaluation. We are encouraged that researchers in other municipalities are developing predictivemodels for fire risk to improve public safety. However, both of these prior works have not had thebenefit of a partnership with their municipal fire safety department, as we have in Pittsburgh. Withoutthis partnership, their work provides insight into fire risk factors, but may not enable their work tohave the impact on municipal public safety efforts that it might otherwise have.1 on2 http://rpubs.com/jonjay/FPBH JJ3 sk-Project
3. Methodology3.1Data SetsWe start by acquiring data sets from a variety of sources that contain data we hypothesize (basedon prior work) to be relevant in predicting fire risk in non-residential properties. We start with fireincident and fire inspection data, provided by the Pittsburgh Bureau of Fire, from 2009-2017, updatedon a weekly basis, of which we include all fire incident codes that have an associated address. Fromthe Allegheny County Office of Property Assessments, we use the property assessment data, updatedon a monthly basis. From the Pittsburgh Department of Permits, Licenses, and Inspections (PLI), weuse their record of non-fire inspections and violations (e.g. noise or sanitation violations). Finally,from Allegheny County, we use the parcel database, which contains information about every parcelin the City of Pittsburgh. More detail about the data sets can be found in Table 3.1, with the numberof records, features, and dates up-to-date as of the time of this writing.3.2Data Pre-ProcessingTo obtain the most complete set of information about the non-residential properties, we joined theabove data sets for each non-residential address in our dataset. Each address may align with a singleparcel, or one address may contain multiple parcels, as in, for example, a condominium, or universitywith multiple buildings at the same address.Table 3.1: List of data sources used in building the risk modelData SetFire IncidentsFire InspectionsNon-Fire ViolationsParcelsNon-Residential PropertiesSourceBureau of FireBureau of FirePLIAllegheny CountyAllegheny 7UpdatedWeeklyWeeklyDailyWeeklyMonthly
Chapter 3. Methodology14Although the most granular unit of analysis would be the parcel, the fire incidents were logged atthe address level, and thus, to predict fire risk, all of the other data first needed to be aggregatedacross the individual parcels in each address. See Figure 3.1 for a visualization of the unit of analysisassociated with each data set.Figure 3.1: Data aggregation levelsTo do this, we start with the Allegheny County property assessment data set, which we obtainedfrom the Western Pennsylvania Regional Data Center (WPRDC)1 . We first drop all of the data listedas Residential class properties, since we focus in this work on non-residential property inspections.We then merge the PLI non-fire inspection violations dataset with the non-residential properties (bywhich we mean Commercial, Industrial, Governmental, or Utility), at the parcel level. After minorcleaning such as stripping white spaces from text values, dropping duplicate columns, and droppingrows with significant (85%) missing values for data, we aggregate the parcel data at the address level.We aggregate by taking the mean of the following features: Lot area Sale price Fair market land value Fair market building valueThen, because many features are categorical in nature, we aggregated the following features by usingthe most frequently occurring category within each address: Class description (e.g. commercial, industrial, etc) Property usage description (e.g. restaurant, church, etc) Neighborhood School district Municipality Owner description Tax subcode description Non-fire inspection result (from PLI)1 www.wprdc.org
3.3 Model Construction15We then merged the resulting aggregated address-level dataframe with the fire incidents dataframe.We performed minor cleaning of the fire incident data (e.g. stripping white space, standardizinghyphens, standardizing street abbreviations, etc). We then removed some columns and some fireincident types not relevant for property risk analysis (e.g. overheated motor, authorized controlledburning, etc).3.3Model ConstructionAfter joining all of our data sets together at the address level, we were left with a single table whichwe used to train and test the risk model. For this analysis, we used all fire incidents of a 100-levelcode (i.e. building fires) as the outcome to predict, and all other features were used as predictivefeatures in the model. Because some of the features were events (e.g. fire incidents and non-fireinspection violations), we restructured the data so that only events that occurred prior to the firein question were used as a predictive feature. That is, each row of the dataframe was an address,which may have had a fire incident in any given year in the 8 years of our data. Each fire incidenthad an associated year, with some addresses having multiple fire incidents across the 8 years, andthus, multiple rows in the dataframe. For each address-incident, we only included the PLI violationsand non-100 incidents (e.g. smoke alarm activation, electrical wiring issues, etc) as an entry in thataddress-incident row if the datetime of that event occurred prior to the datetime of the code-100 fireincident to be predicted. We then one-hot encoded all of the categorical features as dummy variables,and divided our data into a training set (7.5 years of data) for cross-validation, and a test set (thefinal 0.5 years of data).3.4Model ComparisonAfter training, the model returns an evaluation of its performance on the held-out 6 months of thetest set, using the following metrics: Kappa score AUC score Recall PrecisionWe evaluated multiple model types (described in Table 3.2) along the metrics described above.Because of the substantial class imbalance in our data (44 fire incidents out of 20,806 addresses forthe test set, in July 2017), accuracy is not a useful measure of model performance. That is, because ifthe model simply assigns "no fire" to every instance, it will be correct 99.8% of the time. Therefore,the kappa score, which is, intuitively, the percent agreement accounting for the class imbalance, is amore useful metric. We also use the "recall" to evaluate the performance of our classifier.Before discussing the model evaluations, we will say a bit about how to evaluate a predictiveclassification model such as this. There are a certain number of actual events (fires), and a certainnumber of predicted events (predicted fires). A perfect classifier would predict all actual events(in the test set), while not erroneously predicting any other events (here, fires). In Figure 3.2, the(perhaps aptly named) "confusion matrix" shows the relationship of the actual to predicted events.Ideally, a predictive model will maximize the number of true positives (addresses that the modelpredicted would have a fire, and actually had a fire in the test set) and true negatives, while minimizingthe false positives and false negatives. However, in some prediction cases, like fire prediction, for
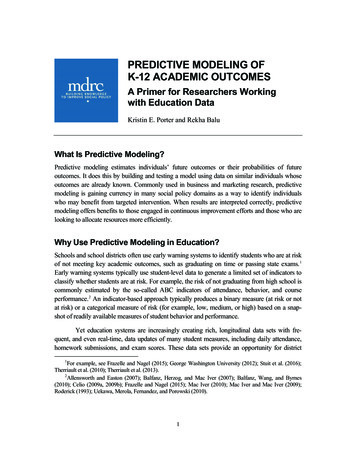
Chapter 3. Methodology16Figure 3.2: Example confusion matrixinstance, false negatives (where the model predicts there will not be a fire, and there actually was)are worse than false positives (model predicted fire, but there was not a fire in the 6 months of thetest set). Therefore, we want to evaluate our model not just by how many true positives and truenegatives it correctly classifies, but by how few false negatives it returns.Figure 3.3: Recall: a metric to evaluate classificationsOne metric for this is called the "recall." Intuitively, the recall can be thought of as the ratio of thetrue positives the model predicted to all of the positive instances. See Figure 3.3 for a visualizationof how to think about the "recall." This evaluation measure penalizes a model for having too manyfalse negatives. Because for fire prediction, we care more about correctly classifying more of thepositive class than minimizing the false positives, it is a more useful evaluation measure for thisapplication than the "precision" (which penalizes the model for having more false positives). Forthoroughness, we show four evaluation measures (Kappa, AUC (or, area under the curve), recall, andprecision. However, we ultimately use the kappa (percent agreement, accounting for chance), andrecall as our two main evaluation measures.Due to the significantly larger kappa score out of all the models we evaluated, we decided to usethe XG Boost model as our final model type, which is a variant on the random forest model type.From manual tuning, we determined the optimal hyperparameters were a learning rate of 0.13, 1500
3.4 Model Comparison17Table 3.2: Evaluation of 4 different model types using a 7:1 train-test split, as of July, 2017Model TypeLogistic RegressionAda BoostRandom ForestXG rs, max depth of 5, 27 seeds, 4 threads, and a binary logistic objective. Future work will usea grid search to identify the optimal hyperparameters.We then output the prediction probabilities for every address in our data, which is the probabilitythat that address will be the positive class (i.e. fire incident of code 100) in the final 6-monthwindow. A larger probability means that it is more likely that that property will have a code 100 fireincident. In order to have a more interpretable fire risk score for the Bureau of Fire, we convert theseprobabilities into integers from 1-10. In the following chapter, we discuss how this model comparesto other prior work, discuss some preliminary findings from analysis of these risk scores, and discusssome predictive features that wer
Predictive Modeling of Building Fire Risk: Designing and evaluating predictive models of fire risk to prioritize property fire inspec-tions. Metro21 Research Publication. For inquiries about the contents of this report or