Transcription
PREDICTIVE MODELING OFK-12 ACADEMIC OUTCOMESA Primer for Researchers Workingwith Education DataKristin E. Porter and Rekha BaluWhat Is Predictive Modeling?Predictive modeling estimates individuals’ future outcomes or their probabilities of futureoutcomes. It does this by building and testing a model using data on similar individuals whoseoutcomes are already known. Commonly used in business and marketing research, predictivemodeling is gaining currency in many social policy domains as a way to identify individualswho may benefit from targeted intervention. When results are interpreted correctly, predictivemodeling offers benefits to those engaged in continuous improvement efforts and those who arelooking to allocate resources more efficiently.Why Use Predictive Modeling in Education?Schools and school districts often use early warning systems to identify students who are at riskof not meeting key academic outcomes, such as graduating on time or passing state exams.1Early warning systems typically use student-level data to generate a limited set of indicators toclassify whether students are at risk. For example, the risk of not graduating from high school iscommonly estimated by the so-called ABC indicators of attendance, behavior, and courseperformance. 2 An indicator-based approach typically produces a binary measure (at risk or notat risk) or a categorical measure of risk (for example, low, medium, or high) based on a snapshot of readily available measures of student behavior and performance.Yet education systems are increasingly creating rich, longitudinal data sets with frequent, and even real-time, data updates of many student measures, including daily attendance,homework submissions, and exam scores. These data sets provide an opportunity for district1For example, see Frazelle and Nagel (2015); George Washington University (2012); Stuit et al. (2016);Therriault et al. (2010); Therriault et al. (2013).2Allensworth and Easton (2007); Balfanz, Herzog, and Mac Iver (2007); Balfanz, Wang, and Byrnes(2010); Celio (2009a, 2009b); Frazelle and Nagel (2015); Mac Iver (2010); Mac Iver and Mac Iver (2009);Roderick (1993); Uekawa, Merola, Fernandez, and Porowski (2010).1
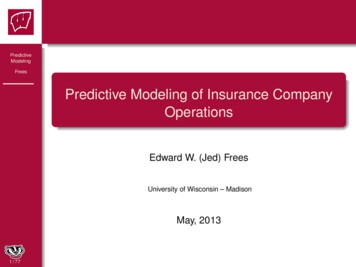
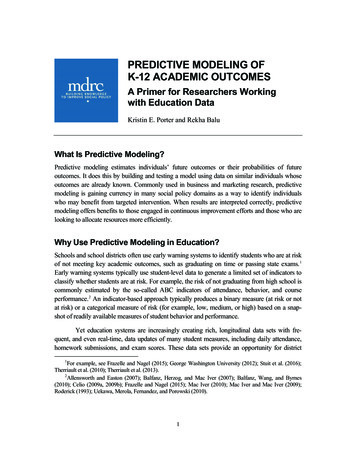
and school staff members to move beyond an indicators-based approach and instead employnew methods to compute more frequent, more accurate, and more nuanced predictions ofstudent risk.For these reasons, MDRC has been exploring the value of predictive modeling. MDRCresearchers have developed and implemented a comprehensive predictive modeling frameworkthat allows for rapid and iterative estimation of a continuous measure of risk (a probabilitybetween 0 and 1 of not achieving an outcome) for each student at a point in time. The framework was developed during a partnership with New Visions for Public Schools (NVPS), anonprofit organization that works with more than 200 public schools in New York City. Theframework has so far been implemented with data from its network of 70 high schools toestimate students’ risk of not graduating on time and of not passing the state algebra examrequired for graduation.Consider an example in which midway through ninth grade, district administrators andeducators want to know each student’s risk of not graduating from high school on time. With thecommon ABC indicators approach, a student with a low attendance rate, behavior incidents, orcourse failures may be designated as having moderate or high risk of not graduating at the end oftwelfth grade, depending on how the student’s first-semester outcomes (and possibly eighth-gradeoutcomes) compare with district-specified thresholds of these ABC indicator measures.With a predictive modeling approach, instead of a parsimonious set of summarymeasures (the indicators), hundreds of measures can be considered for determining students’risk. Not only students’ overall first-semester attendance rates but their attendance pattern canbe considered — good attendance on average could be masking a drop-off later in the semesteror a large gap at some point. Nonacademic measures, such as involvement in the child welfareor justice system, if available, can also be taken into account. The information from a largenumber of measures can be extracted with machine learning (though sometimes a simpleregression model may work just as well) and summarized in a single, continuous estimate ofrisk. Instead of a student being designated as at moderate or high risk, she is determined to have,for example, a 70 percent chance of not graduating on time, plus or minus 5 percentage points(with values closer to 70 percent being more likely).Such estimates allow students to be ranked by their risk levels, and thresholds can bedetermined for particular interventions. Figure 1 illustrates results that could be presented for ahypothetical school. It shows each student’s predicted probability (indicated by a circle) of notachieving a particular milestone, such as on-time graduation from high school. The figure alsoshows the estimated uncertainty interval around each prediction (the vertical line). The studentshave been ranked by their predicted probabilities. Such a plot reveals the variation acrossstudents in the school and the risk levels around which students may cluster.2
Looking at the distributions of risk across and within schools may provide new insightsabout variation in students’ needs. For example, among those students classified as “high risk”by an indicators approach, the estimates from predictive modeling may reveal substantialvariation in risk levels. This can be combined with descriptive analyses of students’ academicprogress within different ranges of risk to reveal particular factors that correlate with risk level.Finally, at the end of ninth grade, all students’ risk estimates can be updated with new information — both the model and the predictions are updated. Administrators and educators canthen track students’ changes in risk on dashboards or other communication systems.3
What Is MDRC’s Approach to Predictive Modeling?MDRC’s approach to predictive modeling of student risk has the following features: It relies on close partnership with practitioners. Because policy and practice can change during and between school years, researchers need to workwith practitioners to deepen their understanding of how to use and createmeasures from existing data sets, interpret results correctly, and maximizethe usefulness of results. It produces results that capture important variation between students inlevels of risk and allows for students to be ranked by their risk estimates.A predicted likelihood between 0 and 1 of not achieving an outcome provides more information about a student’s risk than a category can. Also, assessing students by a continuous measure of risk better allows administratorsto rank them in priority for different types of interventions. It uses an analytic framework with specified decision rules and fieldtested statistical code. The framework includes analytic steps focused on(1) identifying the best samples for training the statistical model and computing predictions; (2) processing data (for example, handling missing values,creating aggregate measures that extract useful information such as changesin daily attendance, and identifying and creating measures that have the samemeaning over time); (3) selecting measures to include in modeling (relyingon a combination of substantive knowledge and data-adaptive algorithms);(4) identifying the best modeling methodology; (5) estimating uncertainty inpredictions; and (6) summarizing and interpreting results. It extracts as much information as possible from data, allowing for hundreds of measures to be considered as potential predictors in modeling.In MDRC’s framework, the modeling incorporates both standard regressionbased approaches and machine learning algorithms, which can search verylarge numbers of measures and let the data determine what form a statisticalmodel should take. MDRC’s approach compares multiple models and selectsthe best one based on its predictive performance in new samples (that is, datathat were not used to train the model; this helps avoid overfitting, in whichthe model does not adequately capture underlying relationships in the dataand therefore does not generalize well to new data). These comparisons aredone with cross-validation, a data resampling method that mimics repeatedlyfitting a model in one sample and then evaluating it in a different sample.4
When researchers consider multiple models or multiple machine learning algorithms, it is known as “ensemble learning.” The way that MDRC researchers employ ensemble learning draws on both substantive expertise —through the parametric models specified by researchers based on theirknowledge of which predictors matter — and the data-adaptive techniquesused by machine learning algorithms. The researchers assess predictive performance in a variety of ways, emphasizing model performance measuresthat align with partners’ priorities for how the results will be used. For example, by focusing on the metrics of sensitivity and specificity, MDRC aims tomaximize identification of truly at-risk students while minimizing falsealarms. It allows for rapid iteration and replication. As described above, MDRChas developed a repeatable multistep framework that allows one to updatepredictive models as new information becomes available and to easily replicate the process to predict additional milestones. The ability to rapidly iterateis an advantage over indicator-based systems. Districts creating such systemstend to combine indicators from published literature and descriptive analysesand use subjective decisions linked to district priorities to determine the finalset of indicators. Such an approach makes updating time-consuming, especially when changing the outcome to a different milestone (for example,from failure to graduate to course failure). It estimates uncertainty in prediction results. As with any statistical procedure, the estimates of students’ likelihoods of not achieving milestoneshave uncertainty, which is typically ignored in indicator-based approachesand even other predictive modeling frameworks. MDRC uses a nonparametric bootstrap procedure to estimate uncertainty and provide lower and upperbounds of predicted likelihoods. The nonparametric bootstrap procedureresamples data in order to mimic repeated draws from a population, and theentire analytic process can be repeated in each draw so that variation acrosssamples can be estimated. It guides practitioners in maximizing use of results. After producing individual predictions of whether each student will fail to meet a particular milestone, and estimates of uncertainty in those predictions, MDRC works withpartners to provide post-hoc analyses of predicted likelihoods that summarizevariation across schools and subgroups of students. MDRC also guides practitioners in understanding the value and limitations of the predictions and incommunicating results to school leaders and teachers.5
What Are MDRC’s Future Directions in Predictive Modeling ofAcademic Outcomes?Researchers at MDRC are investigating ways to improve its predictive modeling of student risk.They are investigating whether different types of data — both from the education system andbeyond — could improve the accuracy of predictions, especially predictions of long-termoutcomes made early in students’ careers. In particular, they are investigating whether nonacademic data, such as students’ receipt of social services, or additional academic data that districtsare increasingly collecting, such as homework completion and other course-level metrics, canimprove predictive models for a variety of outcomes. MDRC researchers are also working tomake iteration of the framework more efficient, by streamlining data processing steps andspeeding up computing. In addition, MDRC is investigating methodological questions such asthe extent to which and under what circumstances machine learning adds value, as well aswhich machine learning algorithms might be most valuable.MDRC can support district partners in several ways: First, its researchers can help assess whether districts have the organizational capacity and the data to support predictivemodeling and whether it is worthwhile for their particular needs. Where predictive modeling issuitable, MDRC researchers can help districts make the most of the results to guide decisionmaking. Districts interested in this approach might benefit from incorporating the results —both individual predictions and summaries across students, grades, and schools — into theirdashboards and other data visualization and data sharing systems. MDRC can also provideanalyses to help educators decide what to do next — how best to intervene and for whom.Definitions of Technical TermsMachine learning: Machine learning refers to methods that automate model building usingiterative algorithms — that is, a series of steps that continuously adjust for better predictiveperformance — rather than relying on functional forms (specifications of the independentvariables and the types of relationships between the variables and the outcome) specified by ananalyst. Examples of machine learning algorithms that MDRC researchers have employedinclude decision trees, random forests, stepwise regression, k-nearest neighbors, support vectormachines, and others.Cross-validation: The MDRC framework uses v-fold cross-validation in which the data withknown outcomes (for example, whether students graduated or not) are partitioned into a certainnumber (v) of subsamples (or folds). A common value for v is 5, but other values are used too,often driven by the sample size. A model is fit in all but one of the folds, and measures ofperformance are computed in the remaining, “validation” fold. The process is repeated v timessuch that each fold takes a turn as the validation fold. The averages of the performance6
measures are computed across all validation folds. The entire process can be repeated multipletimes in order to reduce the variance of the cross-validated estimates.Ensemble learning: Ensemble learning allows an analyst to consider multiple models ormachine learning algorithms in a systematic and prespecified way so that the optimal model oralgorithm, according to a performance measure of interest, is selected and used for prediction.Sensitivity and specificity: When the outcome of interest is failing to achieve a milestone,sensitivity is the proportion of those who actually fail to achieve it who are correctly predictedas failing (based on a predetermined threshold in estimated continuous likelihood to fail). Thespecificity is the proportion of those who actually do achieve the milestone who are correctlypredicted as doing so. The false positive rate is equal to 1 – specificity. Often it may make senseto find a model that makes the best trade-offs between sensitivity and specificity. Plotting andcomputing the area under receiver operating characteristic (ROC) curves is a useful way tosummarize the trade-offs across all possible thresholds for designating at-risk students.Nonparametric bootstrap: With a nonparametric bootstrap, the data are resampled withreplacement (that is, observations in the first draw are eligible for selection in subsequentdraws) a large number of times (say, 1,000), and analyses are repeated within each resample.The resulting set of 1,000 estimates provides an approximation of the sampling distribution ofthe estimators of interest. When MDRC researchers apply the nonparametric bootstrap topredictive modeling, it produces 1,000 predicted likelihoods for each student. The percentilesfrom 2.5 to 97.5 provide a range with a 95 percent chance of containing a student’s true likelihood, with values closer to the center of the distribution being more likely.For more information, contact:Kristin Porter, Senior Research Associatekristin.porter@mdrc.orgRekha Balu, Senior Research Associaterekha.balu@mdrc.org7
AcknowledgmentsFunding for this work was provided by New Visions for Public Schools, the Laura and JohnArnold Foundation, the Edna McConnell Clark Foundation, the Charles and Lynn SchustermanFoundation, the JPB Foundation, the Kresge Foundation, the Ford Foundation, and the JoyceFoundation.Sara Staszak and David Roy provided excellent research assistance. Joshua Malbin,John Hutchins, and Gordon Berlin provided invaluable guidance on this brief. MDRC thanksNew Visions for Public Schools for their partnership in this project.Dissemination of MDRC publications is supported by the following funders that helpfinance MDRC’s public policy outreach and expanding efforts to communicate the results andimplications of our work to policymakers, practitioners, and others: The Annie E. CaseyFoundation, Charles and Lynn Schusterman Family Foundation, The Edna McConnell ClarkFoundation, Ford Foundation, The George Gund Foundation, Daniel and Corinne Goldman,The Harry and Jeanette Weinberg Foundation, Inc., The JBP Foundation, The Joyce Foundation, The Kresge Foundation, Laura and John Arnold Foundation, Sandler Foundation, and TheStarr Foundation.In addition, earnings from the MDRC Endowment help sustain our dissemination efforts. Contributors to the MDRC Endowment include Alcoa Foundation, The Ambrose MonellFoundation, Anheuser-Busch Foundation, Bristol-Myers Squibb Foundation,Charles StewartMott Foundation, Ford Foundation, The George Gund Foundation, The Grable Foundation, TheLizabeth and Frank Newman Charitable Foundation, The New York Times Company Foundation, Jan Nicholson, Paul H. O’Neill Charitable Foundation, John S. Reed, Sandler Foundation,and The Stupski Family Fund, as well as other individual contributors.The findings and conclusions in this report do not necessarily represent the official positions or policies of the funders.For information about MDRC and copies of our publications, see our website: www.mdrc.org.Copyright 2016 by MDRC . All rights reserved.8
ReferencesAllensworth, E. M., and Easton, J. Q. (2007). What matters for staying on-track and graduatingin Chicago public high schools: A close look at course grades, failures, and attendance inthe freshman year. Research report. Chicago: Consortium on Chicago School Research.Balfanz, R., Herzog, L., and Mac Iver, D. J. (2007). Preventing student disengagement andkeeping students on the graduation path in urban middle-grades schools: Earlyidentification and effective interventions. Educational Psychologist, 42(4), 223-235.Balfanz, R., Wang, A., and Byrnes, V. (2010). Early warning indicator analysis: Tennessee.Baltimore, MD: Johns Hopkins University.Celio, M. B. (2009a). Getting to graduation: Kent School District cohort study. PowerPointpresentation to Kent School District. Retrieved August 3, 2016, /08/EWIs Kent-Schools-2009-CohortStudy.pdf.Celio, M. B. (2009b). Seattle School District 2006 cohort study. PowerPoint presentation to Bill& Melinda Gates Foundation. Retrieved August 3, 2016, from EWIs lle, S., and Nagel, A. (2015). A practitioner’s guide to implementing early warningsystems. Washington, DC: U.S. Department of Education, Institute of Education Sciences,National Center for Education Evaluation and Regional Assistance, Regional EducationalLaboratory Northwest. Retrieved from http://ies.ed.gov/ncee/edlabs.George Washington University. (2012). Evidence based resources for keeping students on trackto graduation. Arlington, VA: George Washington University, Center for Equity andExcellence in Education.Mac Iver, M. A. (2010). Gradual disengagement: A portrait of the 2008-09 dropouts in theBaltimore City Schools. Baltimore, MD: Baltimore Education Research Consortium.Mac Iver, M. A., and Mac Iver, D. J. (2009). Beyond the indicators: An integrated school-levelapproach to dropout prevention. Arlington, VA: George Washington University, Centerfor Equity and Excellence in Education.Roderick, M. (1993). The path to dropping out: Evidence for intervention. Westport, CT:Auburn House.Stuit, D., O’Cummings, M., Norbury, H., Heppen, J., Dhillon, S., Lindsay, J., and Zhu, B.(2016). Identifying early warning indicators in three Ohio school districts. Washington,DC: U.S. Department of Education, Institute of Education Sciences, National Center forEducation Evaluation and Regional Assistance, Regional Educational Laboratory Midwest.9
Therriault, S. B., Heppen, J., O’Cummings, M., Fryer, L., and Johnson, A. (2010). Earlywarning system implementation guide: For use with the National High School Center’sEarly Warning System Tool v2. 0. Washington, DC: American Institutes for Research,National High School Center.Therriault, S. B., O’Cummings, M., Heppen, J., Yerhot, L., and Scala, J. (2013). High schoolearly warning intervention monitoring system implementation guide: For use with theNational High School Center’s Early Warning System High School Tool. Washington, DC:American Institutes for Research, National High School Center.Uekawa, K., Merola, S., Fernandez, F., and Porowski, A. (2010). Creating an early warningsystem: Predictors of dropout in Delaware. Rockville, MD: Mid-Atlantic RegionalEducation Labratory.10
Predictive modeling estimates individuals’ future outcomes or their probabilities of future outcomes. It does this by building and testing a model using data on similar individuals whose outcomes are already known. Commonly used in business and marketing research, predictive modeling is ga