Transcription
www.allitebooks.com
Data Visualization with D3 andAngularJSBuild dynamic and interactive visualizations fromreal-world data with D3 on AngularJSChristoph KörnerBIRMINGHAM - MUMBAIwww.allitebooks.com
Data Visualization with D3 and AngularJSCopyright 2015 Packt PublishingAll rights reserved. No part of this book may be reproduced, stored in a retrievalsystem, or transmitted in any form or by any means, without the prior writtenpermission of the publisher, except in the case of brief quotations embedded incritical articles or reviews.Every effort has been made in the preparation of this book to ensure the accuracyof the information presented. However, the information contained in this book issold without warranty, either express or implied. Neither the author, nor PacktPublishing, and its dealers and distributors will be held liable for any damagescaused or alleged to be caused directly or indirectly by this book.Packt Publishing has endeavored to provide trademark information about all of thecompanies and products mentioned in this book by the appropriate use of capitals.However, Packt Publishing cannot guarantee the accuracy of this information.First published: April 2015Production reference: 1230415Published by Packt Publishing Ltd.Livery Place35 Livery StreetBirmingham B3 2PB, UK.ISBN om
CreditsAuthorProject CoordinatorChristoph KörnerIzzat ContractorReviewersProofreadersMichael AlexanderSafis EditingAmin ArianaPaul HindleAthos DemetriIndexerVictor MejiaHemangini BariAaron NielsenJeremy ZerrGraphicsCommissioning EditorPramila BalanDisha HariaProduction CoordinatorAcquisition EditorShaon BasuNilesh R. MohiteCover WorkContent Development EditorNilesh R. MohiteAkashdeep KunduTechnical EditorsVijin BorichaHumera ShaikhCopy EditorRelin Hedlywww.allitebooks.com
About the AuthorChristoph Körner is the CTO of GESIM, a Swiss startup company, where heis responsible for its simulation software and web interface that is built usingAngularJS and D3. He studied electrical engineering and information technology atVienna University of Technology, including a 1-year exchange program at the SwissFederal Institute of Technology, Lausanne.Christoph is a passionate, self-taught software developer, coworker, and webenthusiast with more than 7 years of experience in designing, developing, andimplementing customer-oriented web-based IT solutions. He has always beenenthusiastic and curious about new technologies and started to use AngularJS andD3 since the very first version. Christoph is not only fascinated by technology, but healso aims to push cutting-edge technologies to production services.I would like to thank my colleagues and close friends, Firat Özdemirand Vidor Kanalas, and my girlfriend, Laura Andrea Rojas Padilla,for all their input, support, and motivation during all stages ofthe book. I also want to offer special thanks to the whole PacktPublishing team for doing an outstanding job in supervising andsupporting me.www.allitebooks.com
About the ReviewersMichael Alexander is an Australian FOSS developer who is the author of popularAngular-D3—a D3.js directive for AngularJS. He is currently employed withHRMWEB Pty Ltd. and works on several web applications involving a range oftechnologies including AngularJS.Michael also founded Miniand Pty Ltd, a company that helped the mini PC anddeveloper board market grow in recent years in China through consultation anddevelopment directly with manufacturers.Amin Ariana is an ex-Google and ex-Microsoft software entrepreneur in SanFrancisco and the cofounder and chief technology officer at Sponsorbrite Inc.He has combined the use of AngularJS and D3.js since the earliest days of theiradoption at Google.As a Carnegie Mellon University recipient of Director's Return on Education Award,Amin continues to be an ambassador of change for professionals and technologyorganizations alike. He combines his computer science foundations from theUniversity of Waterloo with the disciplines of engineering, design, business, andinnovation to create products and write entrepreneurial career roadmaps.His advisory essays on scalable software engineering, entrepreneurship, innovation,and management are published in Forbes, Quora, and his personal blog atwww.aminariana.com.www.allitebooks.com
As the technical cofounder and CTO at Sponsorbrite, Amin leverages big datawith insight-transferring solutions such as AngularJS and D3.js to bring corporatesponsorship to social institutions and communities that were left underfundedby the federal government. His team's fundraising and community relationshipmanagement platform is a prime example of how books similar to this can be toolstoward multibillion-dollar social values.Amin's upcoming book, The Rise of The Rainmaker, is about carving a career path fromengineering to entrepreneurship. He is still writing the book and hopes to publish itdigitally next year. The completed chapters of this book are accessible to membersof his blog.Special thanks to my wife, Abby Denzin, for keeping me saneenough to review this exciting book while managing a startupcompany and to my reviewer buddies, Izzat Contractor and NehaThakur, for helping me reach the finish line.Athos Demetri works as a freelance developer and technical consultant for anumber of local businesses. He mostly enjoys bringing the power of the Web totechnophobes. In those rare moments when he isn't working, he likes good food,yoga, techno music, cats, and enjoys laughing with friends.I'd like to thank my mum and dad for always telling me that there'sno such word as "can't" and for always being right the first time. I'dalso like to thank Anja, without whose support, I'd have given up onprogramming years ago.Finally, I'm also grateful to my friends for their patience andconfidence in my curveball ideas about virtually everything.www.allitebooks.com
Victor Mejia is a full stack web developer. He has been a part of differentindustries and enjoys working with full stack JavaScript and data visualization. Inhis spare time, you will find him coding, reading, in Bible study, and spending timewith family and friends. He and his wife, Jessica, are in love and happily married.They are expecting a beautiful baby girl.Jeremy Zerr is a web software entrepreneur and an experienced web developer,currently imparting his web application development skills to the world as asoftware consultant, educator, and product creator. Changing the world withwell-crafted software is his passion. He writes about web development topics onhis blog at http://www.jeremyzerr.com and offers his web software developmentservices through his company Zerrtech at http://www.zerrtech.com.www.allitebooks.com
www.PacktPub.comSupport files, eBooks, discount offers,and moreFor support files and downloads related to your book, please visit www.PacktPub.com.Did you know that Packt offers eBook versions of every book published, with PDFand ePub files available? You can upgrade to the eBook version at www.PacktPub.com and as a print book customer, you are entitled to a discount on the eBook copy.Get in touch with us at service@packtpub.com for more details.At www.PacktPub.com, you can also read a collection of free technical articles, signup for a range of free newsletters and receive exclusive discounts and offers on Packtbooks and n/packtlibDo you need instant solutions to your IT questions? PacktLib is Packt's online digitalbook library. Here, you can search, access, and read Packt's entire library of books.Why subscribe? Fully searchable across every book published by PacktCopy and paste, print, and bookmark contentOn demand and accessible via a web browserFree access for Packt account holdersIf you have an account with Packt at www.PacktPub.com, you can use this to accessPacktLib today and view 9 entirely free books. Simply use your login credentials forimmediate access.www.allitebooks.com
Table of ContentsPrefaceChapter 1: The Magic of SVG, D3.js, and AngularJSvii1Chapter 2: Getting Started with D3.js27Building a real-time dashboard to visualize server logsTerminology and definitionsDocument Object ModelVector graphics and Scalable Vector GraphicsPixel graphicsUnderstanding Data-Driven DocumentsWhy do we use D3.js?The killer feature – data joinsFinding resourcesD3.js meets AngularJSTestable and maintainable componentsCustom directivesCustom filtersCustom loading and parsing serviceA brief overview of visualization tools for the WebJava and FlashRaphaël (JavaScript – SVG/VML)Protovis (JavaScript – SVG)D3.js (JavaScript – HTML/SVG)Canvas API (JavaScript – Canvas)Three.js (JavaScript – WebGL)SummaryBuilding a simple scatter plot applicationCreating an HTML template for 20202223232425252829
Table of ContentsSelecting and modifying DOM elementsA closer look at Selectionsselection.attr(name[, value])selection.style(name[, value[, priority]])selection.property(name[, e)selection.insert(name[, before])selection.remove()Finding elements in the DOM with on.each(function)selection.call(function[, arguments ])3033353536363737373839394040Binding data to DOM elementsselection.data(values[, key])Using dynamic properties in SelectionsTracking changes of data with data joins41414345The update patternCreating a simple scatter Chapter 3: Manipulating Data464755Manipulating datasets in arraysBuilt-in JavaScript array k)array.reduce(callback [, initialValue])585859More array manipulation with D3.js60Grouping elements with d3.nest65d3.min(array[, accessor])d3.max(array[, accessor])d3.sum(array[, accessor])d3.mean(array[, accessor])d3.median(array[, accessor])d3.shuffle(array)d3.permute(array, indexes)d3.merge(array)d3.range([start, ]stop[, step)d3.zip(array, array, 3.entries(object)6161616262626363636464646565[ ii ]
Table of ContentsFormatting numbers and datesSpecifying a number format6768Customizing date and time formatsWorking with scalesQuantitative scales for continuous data (numbers)717274Types of formattingPrecisionThousands separatorWidthZero paddingThe currency symbolSignsThe align propertyThe fill cks([count])scale.tickFormat(count [,specifier])686969697070707071757576767677Ordinal scales for discrete data (strings)77Time scales for time data (date and time)All about axesDrawing the axisAdding axes to the scatter chartSummary7980818387scale.rangePoints(interval [, padding])scale.rangeBands(interval [, padding [, outerPadding ]])scale.rangeBand()scale.rangeExtent()Predefined ordinal color scalesChapter 4: Building a Chart DirectiveSetting up an AngularJS applicationOrganizing the directoryInstalling AngularJSBootstrapping the index fileAdding a module and a controllerIntegrating D3.js into AngularJSOrganizing the directoryWrapping D3.jsA chart directiveA directive for SVGImplementing a custom compile function[ iii ]7878787979899090909192939394959598
Table of ContentsDrawing charts99Axis, scale, range, and domainJoining the data points99101Advantages of directives102Generalizing the chart directive103Testing the directiveSetting up the testing environment105106Unit testing the chart directiveE2E testing of the chart directiveSummary110113115Getting started with KarmaGetting started with Protractor106108Chapter 5: Loading and Parsing DataLoading external dataXHR – the native XMLHttpRequestd3.xhr – the XHR wrapper of D3.jsUseful wrappers for common file typesCreating a simple D3 data loading componentTesting the simple D3 data loading componentSummary of D3.js as a data loading service http – the Angular wrapper for XHRCreating an AngularJS data loading componentTesting the AngularJS data loading componentSummary of AngularJS as a data loading serviceParsing log files to JavaScript objectsParsing log files step by stepParsing the custom date format to a JavaScript dateA reusable data parsing serviceTesting the data parsing serviceGrouping log 34135137139Testing the classifier141Displaying logsSummaryChapter 6: Drawing Curves and ShapesCommon shapes and primitivesCurved lines with the SVG pathDrawing straight linesBézier curvesDrawing ellipses and elliptical arcsGenerating arcs142144147148151154155159164Summary169[ iv ]
Table of ContentsChapter 7: Controlling Transitions and Animations171Chapter 8: Bringing the Chart to Life with Interactions193Chapter 9: Building a Real-time Visualization to MonitorServer Logs227AnimationsTimer in D3.js with d3.timerInterpolation with D3.jsEasy animations with transitionsStaggered transitionsChaining transitionsCreating plausible transitionsInterpolate anything with tweensRealistic animations with easingTransitions in chartsSummaryListen for eventsType of EventsGetting event coordinatesCursorsA simple cursorSnappy cursorsLabeling the cursor positionCustomizing events in D3.jsDisplaying self-updating cursor valuesZooming and panningA simple zoomAn x axis zoomInteractive filtersAdvanced filtering using brushesCreating a simple brushBuilding a custom date filter directiveSummaryBuilding a real-time monitoring serverSetting up a Node.js applicationSetting up a web server that serves static filesAdding server push with WebSocketsReading logs and pushing them to the clientWatching files for 228229231232
Table of ContentsProcessing and visualizing logs on the clientBootstrapping a template with AngularJS and Socket.IOUsing Socket.IO with AngularJSProcessing log filesThe dashboard applicationSummaryIndex[ vi ]234234235237242244247
PrefacePrefaceThe question of how I could better visualize my application server's log files hasalways hovered around in my mind. In this book, we'll materialize this idea. Afterreading the book, you'll be able to analyze the log files of your application server anddisplay them as a time series chart on a web page—a real-time autoupdating chart.I picked my two favorite JavaScript libraries—AngularJS and D3.js—to develop sucha visualization.AngularJS is a web application framework that facilitates the development of modernweb applications with concepts such as the MVC/MVVM pattern, two-way databinding, testable modules, and dependency injection. I especially like the idea that onecan declare templates to extend the HTML language; this enables a whole new worldof applications and the sharing of work between designers and frontend engineers.D3.js is a visualization toolkit that facilitates the generation and manipulationof web-based vector graphics with full access to the underlying SVG standard.Moreover, animations and interactive visualizations change how users perceiveweb applications; D3.js offers everything you need to make a visualizationinteractive out of the box.In this book, I will teach you how to create an interactive real-time visualization forthe Web with AngularJS as the application framework and D3.js as the visualizationtoolkit. I will explain the basic concepts of D3.js, when and why we use it, and whyit's so much better than other DOM-transforming libraries, with a focus on its datadriven approach. Also, I will show you best practices to manipulate datasets andpreprocess data—an everyday job if you want to display data from different sources.Then, we will spend more time on seeing how a visualization library can be bestintegrated into an AngularJS application using modules, directives, and services tomake the components testable and maintainable. Later, we will focus on developingthe visualization.[ vii ]
PrefaceFirst, we need to load real data in the application and parse the text data to aJavaScript array of objects. Then, we need to preprocess and group the dataaccording to the way we want to display it. Now, we can generate a curve or shapein the chart that represents our data. Next, we want to animate this curve—to showa transition between the old and the new state—whenever we update the data ofthe chart. We also want to zoom and pan inside the charts and create filters in orderto clamp the chart to a certain range, for example, a starting time and an endingtime for the time series data. Finally, we want to put everything together on to adashboard and feed it with real server logs of a web server.Displaying data on the web is a common task for developers. This books walks youthrough an exciting project, explaining best practices and common pitfalls in thisdomain using the two most amazing JavaScript libraries: AngularJS and D3.js.What this book coversChapter 1, The Magic of SVG, D3.js, and AngularJS, introduces you to the world ofvector graphics on the web and points out the advantages of D3.js.Chapter 2, Getting Started with D3.js, explains how to draw vector graphics with D3.jsand its data-driven approach.Chapter 3, Manipulating Data, walks you through the important task of manipulatingand preprocessing datasets in JavaScript and D3.js.Chapter 4, Building a Chart Directive, lets you implement a first scatter chart directivein order to integrate the visualization into a simple AngularJS application with afocus on modularization and testability.Chapter 5, Loading and Parsing Data, explains how to load files and parse realdata using AngularJS and D3.js. It also explains how to aggregate informationfor the visualization.Chapter 6, Drawing Curves and Shapes, helps you understand lines, curves, and shapesin SVG and D3.js in order to create different chart types, such as line charts, areacharts, and bar charts.Chapter 7, Controlling Transitions and Animations, shows how animations can be usedto better visualize changes in the dataset and the visualization. You will learn aboutanimations in D3.js and how to create plausible transitions to update chart directives.Chapter 8, Bringing the Chart to Life with Interactions, explains how to add interactionsto the chart directive, which is a big advantage of web-based visualizations. You willalso see how to combine and encapsulate the interactions of the D3 chart and theAngularJS application.[ viii ]
PrefaceChapter 9, Building a Real-time Visualization to Monitor Server Logs, walks you throughan exciting example where you will use all the acquired knowledge of the book tobuild a visualization dashboard to analyze server logs.What you need for this bookTo get started, all you need is a web browser and a text editor, such as Sublime Text.However, I recommend that you install Node.js (http://nodejs.org/) that includesthe npm package manager and the Bower (http://bower.io/) module in order torun the tests. I will walk you through the installation of the required packages in thecorresponding chapters.Starting from Chapter 4, Building a Chart Directive, we will use the http-server module(https://www.npmjs.com/package/http-server) to run the examples from a localweb server. An internet connection is only required for installing tools and libraries,but not for running the examples.Who this book is forData Visualization with D3 and AngularJS is intended for web developers withexperience in AngularJS who want to implement fully customizable interactivevector graphics for all platforms. Whether you already know a bit about SVG andvector graphics in the browser or have never used any visualization library inJavaScript before, you will be able to master the data-driven techniques of D3. Ineither case, this book will get you up and running quickly and also challenges you ifyou have already worked with D3.ConventionsIn this book, you will find a number of text styles that distinguish between differentkinds of information. Here are some examples of these styles and an explanation oftheir meaning.Code words in text, database table names, folder names, filenames, file extensions,pathnames, dummy URLs, user input, and Twitter handles are shown as follows:"The .exit() function will return all elements of the Selection because the datasetcontains no elements."[ ix ]
PrefaceA block of code is set as follows: html head title My App /title /head body h1 class "header My Application /h1 p class "content" Lorem ipsum dolor sit amet, . /p /body /html When we wish to draw your attention to a particular part of a code block, therelevant lines or items are set in bold: html . body object id "vis" width "50" height "30" param name "movie" value "vis.swf" embed src "vis.swf" type "application/x-shockwave-flash" /object /body /html Any command-line input or output is written as follows:npm install --save expressnpm install --save serve-staticNew terms and important words are shown in bold. Words that you see on the screen,for example, in menus or dialog boxes, appear in the text like this: "The t parameterin the range 0 to 1 defines the position on the curve between the starting point P0(in the figure P1) and the end point P3 (in the figure P2); P1 (in the figure C1) and P2(in the figure C2) are called control points and are used to model the shape betweenthese points."Warnings or important notes appear in a box like this.Tips and tricks appear like this.[x]
PrefaceReader feedbackFeedback from our readers is always welcome. Let us know what you think aboutthis book—what you liked or disliked. Reader feedback is important for us as it helpsus develop titles that you will really get the most out of.To send us general feedback, simply e-mail feedback@packtpub.com, and mentionthe book's title in the subject of your message.If there is a topic that you have expertise in and you are interested in either writingor contributing to a book, see our author guide at www.packtpub.com/authors.Customer supportNow that you are the proud owner of a Packt book, we have a number of things tohelp you to get the most from your purchase.Downloading the example codeYou can download the example code files from your account at http://www.packtpub.com for all the Packt Publishing books you have purchased. If youpurchased this book elsewhere, you can visit http://www.packtpub.com/supportand register to have the files e-mailed directly to you.Downloading the color images of this bookWe also provide you with a PDF file that has color images of the screenshots/diagrams used in this book. The color images will help you better understand thechanges in the output. You can download this file from: oads/8484OS Graphics.pdf.ErrataAlthough we have taken every care to ensure the accuracy of our content, mistakesdo happen. If you find a mistake in one of our books—maybe a mistake in the text orthe code—we would be grateful if you could report this to us. By doing so, you cansave other readers from frustration and help us improve subsequent versions of thisbook. If you find any errata, please report them by visiting http://www.packtpub.com/submit-errata, selecting your book, clicking on the Errata Submission Formlink, and entering the details of your errata. Once your errata are verified, yoursubmission will be accepted and the errata will be uploaded to our website or addedto any list of existing errata under the Errata section of that title.[ xi ]www.allitebooks.com
PrefaceTo view the previously submitted errata, go to https://www.packtpub.com/books/content/support and enter the name of the book in the search field. The requiredinformation will appear under the Errata section.PiracyPiracy of copyrighted material on the Internet is an ongoing problem across allmedia. At Packt, we take the protection of our copyright and licenses very seriously.If you come across any illegal copies of our works in any form on the Internet, pleaseprovide us with the location address or website name immediately so that we canpursue a remedy.Please contact us at copyright@packtpub.com with a link to the suspected piratedmaterial.We appreciate your help in protecting our authors and our ability to bring youvaluable content.QuestionsIf you have a problem with any aspect of this book, you can contact us atquestions@packtpub.com, and we will do our best to address the problem.[ xii ]
The Magic of SVG, D3.js,and AngularJSIn this book, we will develop an application that combines both frameworks D3.jsand AngularJS into a stunning interactive visualization, an interactive dashboard tovisualize server logs in real time. First, I will discuss the outline and the purpose ofthis application. Then, I will explain how to modularize the visualization so that allcomponents can be seamlessly embedded into one single application.In the second section, we will talk about the terminology and definitions that areused in this book to introduce you to this topic or to refresh your knowledge of somebasics in computer graphics. It will help you to understand why we are using vectorgraphics—especially SVG for the Web—for the visualization that we will develop inthis book (and not, for example, Canvas or WebGL).The next part of the chapter will give an introduction to D3.js and its data-drivenapproach. It will help you to understand the similarities and fundamental differencesof D3.js and other DOM transforming libraries such as jQuery. Then, we will seean introduction to AngularJS and discuss its strengths for modern applicationdevelopment as well as the integration of D3.js into an AngularJS application.The last section of this chapter will help you to understand why we prefer D3.jsover other visualization libraries. It will give a brief outline and comparison of webvisualization tools emphasizing on libraries to create and manipulate vector graphicsand the evolution of web standards. We will discuss the main ideas and advantagesof using D3.js in web applications and the differences between it and other tools forweb visualizations (such as Raphaël or Three.js).[1]
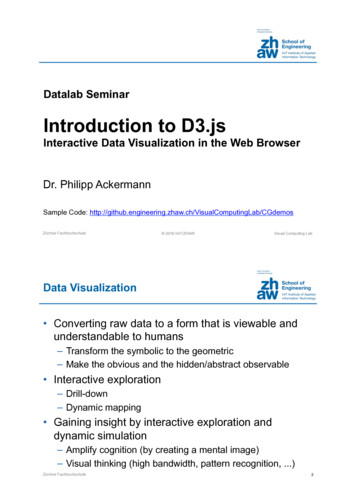
The Magic of SVG, D3.js, and AngularJSIn this chapter, you will learn: How to distinguish vector and pixel graphics and to know theirapplication areas When and why to use vector graphics, especially SVG Why D3.js is superior to other common graphical toolkits When and why to use D3.js for creating graphical content The advantages of integrating D3.js into an AngularJS application How to structure and encapsulate a visualization library written in D3.js touse with an AngularJS applicationBuilding a real-time dashboard tovisualize server logsDid you ever wonder how many users visit your web application or how manyexceptions your server application raised in the last month? The solution to varioussimilar problems is to simply analyze and visualize the log or access files of theparticular application.In this book, we will develop a real-time dashboard to visualize application logsand the server's system status in the browser. Thus, we will build a custom GoogleAnalytics-like visualization dashboard for our own server (see the following figure).Additionally, we want to add custom animation and user interactions—such asselecting data ranges, zooming, and panning—to the visualization.[2]
Chapter 1Google Analytics dashboardThe dashboard (frontend) will be capable of loading, parsing, and grouping log filesof different formats, filtering data based on selected data ranges and displaying,updating, and animating multiple chart types. We will build the visualization librarywith D3.js and the application with AngularJS.While developing this application, we will see all the advantages, problems, andbest practices of D3.js and AngularJS in action. Also, you will learn to combine bothframeworks to one single application.During most of the chapters, we will focus on loading log data from static resources.In the last chapter, we will implement a simple web server (backend) using Node.js and Express to detect log file changes in real time and push these changes to thedashboard using WebSockets and the Socket.IO library.Besides implementing all the functionality, you will also learn how to design andtest (we will use unit and integration tests) the frontend components with the testrunners, Karma and Protractor.[3]
The Magic of SVG, D3.js, and AngularJSTerminology and definitionsLet's start from the beginning. In the following chapters, we will discuss computergraphics and visualizations for the Web. Therefore, it's important to understand thebasic terminology of this domain. In this section, I will refresh your knowledge ofthe two most common image representations (vector and pixel graphics). I will alsodiscuss the web standards that are relevant for graphical applications (DOM, SVG,and so on). If these definitions are not new for you, then nothing can stop you fromjumping directly to the next section.Document Object ModelThe Document Object Model (DOM) is the tree representation of the hierarchicalelements of an HTML document and it was specified by the World Wide WebConsortium (W3C). These elements in the DOM are called nodes (for example, html,head, body, and so on), which can have attributes (for example, class "header")and content (for example, "My Application" is the content of the h1 node). TheDOM provides a public JavaScript interface with which we can access nodes andmanipulate them.Let's look at the source code of a simple HTML page to see an example of theDOM tree: html head title My App /title /head body h1 class "header My Application /h1 p class "content" Lorem ipsum dolor sit amet, . /p /body /html Downloading the example codeYou can download the example code files for allPackt books you have purchased from your accountat http://www.packtpub.com. If you purchasedthis book elsewhere, you can visit h
Setting up an AngularJS application 90 Organizing the directory 90 Installing AngularJS 90 Bootstrapping the index file 91 Adding a module and a controller 92 Integrating D3.js into AngularJS 93 Organizing the directory 93 Wrapping D3.js 94 A chart directive 95 A direc