Transcription
District Data Coordinator Toolbox:Implementing Database Connections in SPSSJason Schoeneberger, Ph.D.Senior Researcher & Task Lead
Data, data, everywhereThe volume of and the push tomake use educational data isgrowing: More people must becomedata savvy (teachers,coordinators, etc.) Leadership may requestcyclical reporting to establishand monitor trends Little time to documentbusiness rules or standardizedata storage practices Quality control can take time orbe difficult to manageTeachers, principals,administrators and analysts oftenhave difficulty keeping pace.2
Some familiar scenarios(using data stored in SQL, Oracle, Access, etc.) The same data points arenecessary acrossreporting cycles Process to acquire andreport data is repetitiveacross reporting cycles A non-technical personmay be tasked withreporting responsibility Lack of documentation Analysts report shortageof storage space onnetwork or external harddrives Analysts are maintainingidiosyncratic versions ofvarious data elements(e.g. test score files,student attendance files,etc.) Idiosyncratic versionshave commonalitiesacross analyst versions Separate data requestscompleted by differentanalysts yield conflictingresults (e.g. a schoolmean test score)3
Database connections Databases (e.g., SQL, Oracle, Access, etc.) allowfor basic data base connectivity:– Open Database Connectivity (ODBC)– Object Linking and Embedding Database(OLEDB)– These are often standard on computers ODBC/OLEDB connections are frameworks toallow data manipulation software (e.g. Excel,SPSS, SAS) to communicate with databases4
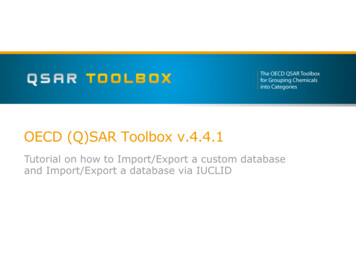
Road map to data connectivityStep 4.Summarize raw dataStep 3.Retrieve raw dataStep 2.Connect to ODBCData SourceStep 1.Create new ODBCData Source5
Traveling the road by example To follow the steps in our road map to connectivity,let’s assume the following example:– District leadership has asked us to examine readingachievement as measured by reading assessmentachievement levels– Leadership is specifically interested in 6th grade studentperformance– They want to examine performance by student LimitedEnglish Proficient (LEP) status.– The data we need to obtain are stored in an Accessdatabase6
Creating an ODBC data source The first step is to create an ODBC Data Sourcecentered on an existing database such as Access,SQL, or Oracle. ODBC Data Sources areframeworks, or linkages for software packagessuch as SPSS to communicate with databases7
Open ODBC administrator window Type ‘ODBC’ in Search Box and press Enter8
Add a new data source Click ‘Add’ to begin adding a new ODBC datasource9
Choose a driver for the data source1. Choose driver for connection to a source (in thisexample, we connect to an Access database)2. Click Finish1210
Name the database connection1. Name the connection to the database2. Click ‘Select’ button under Database1211
Select source database1. Navigate to location of the database (the Accessdatabase we want to connect to in this example)2. Select source database13. Click OK3212
Click OK for data source name Click OK button under Database13
New data source appears in ODBC directory1. New data source listed in ODBC directory2. Click OK1214
Connecting to a Database Now that our ODBC data source exists forcommunicating with the database, the informationin the database can be extracted directly into othersoftware packages (e.g. SPSS) for furthermanipulation15
Connect to database using SPSS1.2.3.4.Open an instance of SPSS (screenshots use SPSS 22.0)Navigate to the File menu in SPSSClick on ‘Open Database’1Select ‘New Query’24316
Choose your data source1. Select the data source of interest (in this example,the relma access connect data source)2. Click Next1217
View available tables in data source Now we can view data tables in the database– student assessments– student demographics Press ‘ ’ buttonto list variables instudent demographics table18
Select demographic variables1. Click on variables in student demographics table2. Click arrow to move variables to query windowa) Student id(studentidentificationnumber)1b) Student grade (student gradelevel)c) Student lepdesc (studentLEP statusdescription)3. Click Next2319
Select assessment variables1. Press ‘ ’ to list variables in student assessments1table2. Selectreading achmnt lvlfromstudent assessments table3. Clickarrow tomove variable toquery window4. Click Next32420
Adding/deleting relationships1. Auto Join willfind variablesin commonamong tablesand join themautomatically2. Un-Check theAuto JoinTables button(all joins areremoved)1221
Join types1. Change type of join using drop-down buttona)b)c)Inner Join returns onlyrecords with matchingstudent ids in bothtablesRight Join returns all 2arecords fromstudent assessmentsand records withmatches instudent demographics2bLeft Join returns allrecords fromstudent demographics2cand records withmatches instudent assessments122
Specifying join types1.2.3.Click and hold onvariable in onetable, drag mouseto correspondingfield in other table(in this example,createrelationship fromstudent id-tostudent idBe sure that‘Inner’ is specifiedin the Joint Typedropdown boxClick Next1223
Filter data during data retrieval Returned data can be filtered during retrieval21. Selectstudent gradefrom Columnto filter window2. Use dropdown to selectcriteriaoperation (‘ ‘)3. Enter ‘06’ toreturn only 6thgrade studentdata4. Click Next31424
Define variables during data retrieval The query can recode character string data tonumeric during retrieval1. Check the boxto recodechosenvariables tonumeric (not inthis example)2. Change widthfor characterstringvariables (orminimizebased onobservedvalues)3. Click Next21325
Retrieving results The query wizard generates SQL code for use insideSPSS syntax windows1. First optionwill pull datadirectly intoSPSS2. Secondoption willpaste inSPSS syntaxwindow23. Click Finish1326
Retrieved data in table form Resulting data returned to SPSS, ready foranalysis27
Summarize data retrieved from connection If we want something that is more friendly forleadership, we may want to summarize the rawdata For this example, we will use a Crosstabs analysisto summarize the data28
Generating crosstabs Let’s create a Crosstabs table using the returned data– We’ll specify reading achievement levels as columns andstudent LEP status as rows1. Click Analyze2. Click Descriptive Statistics3. Click Crosstabs21329
Crosstabs – Specify rows & columns1. Clickreading achmnt lvl2. Click arrow next toColumn(s) box3. Click1student lep desc4. Click arrow next toRow(s) box5. Click Cells box345230
Crosstabs – Specify summaries1. Check the Row box underPercentages(this will show us thedistribution within LEPcategory across1achievement levels)2. Click Continue231
Crosstabs – Generate table1. Click OK togenerate tableimmediately(Clicking Paste willinsert Crosstabssyntax into anSPSS syntax file)132
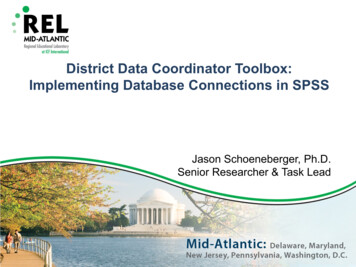
PivotTable – Finished product Now we have counts and percentages within eachLEP Status across Reading achievement levels Should the parameters of the request change, or newdata become available, the data can quickly berefreshed using the connection33
Pasting the syntax Pasting the syntax can be advantageous for repetitivetasks1.2.Syntax for retrieving data from databaseSyntax for generating crosstab table1234
Editing the query syntax Maybe leadership wants data for 6th and 7th graders1. Edit SQL syntax to pull both grade levels (comparehighlighted sections135
Retrieved data from edited query Resulting data, with 6th and 7th graders, returned toSPSS, ready for analysis36
Questions/Need helpContact:Jason Schoeneberger, Ph.D.Senior Researcher and Task LeadREL Mid-Atlantic at ICF 395Please visit www.relmidatlantic.org for other datatools!37
District Data Coordinator Toolbox: Implementing Database Connections in SPSS Jason Schoeneberger, Ph.D. Senior Researcher & Task Lead. Data, data, everywhere The volume of