Transcription
Introduction to statistical modelingIllustrated with XLSTATJean Paul Maaloufwebinar@xlstat.comNovember 30, 2017www.xlstat.com1
PLAN XLSTAT: who are we? Statistics: categories Reminder: statistical testing Principles of statistical modeling Simple linear regression / ANOVA PrinciplesXLSTAT demo & interpretation of outputs: coefficients, p-values, R²Assumptions about residuals and graphical verificationMultiple linear regression Principles & warnings: overfitting & multicolinearityXLSTAT demo & interpretation of outputs What statistical modeling method to choose? Appendix: residuals-alternative verification methods Appendix: alternative modeling toolsAll the data in this webinar were made up unlessotherwise specified2
XLSTAT: Who arewe?XLSTAT is a user-friendlystatistical add-on softwarefor Microsoft Excel 3
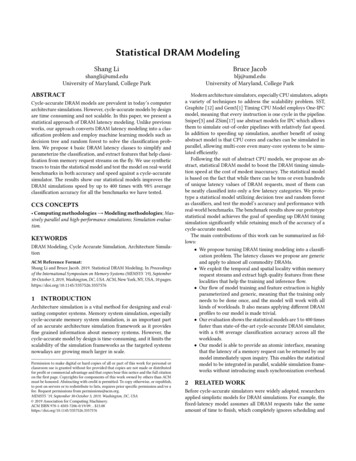
XLSTATA growing software and team1993Thierry Fahmydevelops a userfriendly solutionfor dataanalysis:XLSTAT is bornXLSTATrealizes itsfirst sale onthe Internet19962000The companyAddinsoft iscreatedNew version,VBA interface,C computations, 7languages20062009New offersadapted tobusiness needsNew products,new website,growing anddynamic team20152016XLSTAT 365Cloud versionfor Excel 365XLSTAT-FreeR integration2017R4
XLSTAT in a few numbers200 statistical features100k usersGeneral or field-oriented solutionsAcross the world. Companies, education, research22 employees220k visits/month on the websiteAlways receptive to the needs of usersEasy tutorials available in 5 languages7 languages10k downloads/month5
Statistics: 4categories6
Statistics: 4 categoriesDescriptionExplorationTestsModelingI want to summarizeI want to easily extractI want to accept / rejectI want to understanddata using simpleinformation from aa very precisethe way a variablestatistics or chartslarge data set withouthypothesis assumingevolves according to a(mean, standardnecessarily having aerror risks. (t-tests,set of other variables.deviation,precise question toANOVA, correlation(regression, ANOVA,boxplots.)answer. (PCA, AHC.)tests, chi-square.)ANCOVA.)7
Webinars: upcoming ModelingRecordingANOVA12-7-2017Subscribe here8
Reminder onstatistical testingI want to accept / reject a veryprecise hypothesis assumingerror risks.9
Reminder on statistical testing?QuestionAre averages A & B the same?Null HypothesisH0Generally implies an idea of equalityH0: Average A Average BThe test computes anumber called p-value.0 p-value 1Decision : If p-value alfa, werejectH0andacceptHaassuming a risk proportional to p-Alternative HypothesisHavalue of being wrong.Generally implies an idea of differenceHa: Average A Average B10
Principles ofStatisticalmodelingI want to understand the wayvariables evolve according toother variables.11
Principles of Statistical Modeling DefinitionA statistical model is a simplified representation of a phenomenon using numbers. Itallows to better understand reality and to do predictions.12
A very simple exampleSomebody asks you: what is theheight of French people?First way of answeringRecite the whole table, row after rowSecond way of answeringCompute the mean and the standard deviationover the 200 values, and use these twonumbers as an answerYou have this table that contains heightinformation (cm) of a representativesample of 200 French 71162.Representing French people height by a mean and a standard deviation is a way tomodel this height13
Principles of Statistical Modeling DefinitionA statistical model is a simplified representation of a phenomenon using numbers. Itallows to better understand reality and to do predictions. How models work technicallyA model allows to explain one or several dependent variables using one or severalindependent variables through mathematical equations that involve parameters.The mean and standard deviation model does not imply explanatory variables14
Simple linearregressionPrinciples, XLSTAT demo,interpretation of outputs,hypotheses on residuals15
Data set: online shoe selling platformIndividualsVariablesQuestion: How does invoice amount vary according to time spent on site?16
Example: modeling invoice amount according to timespent on website17
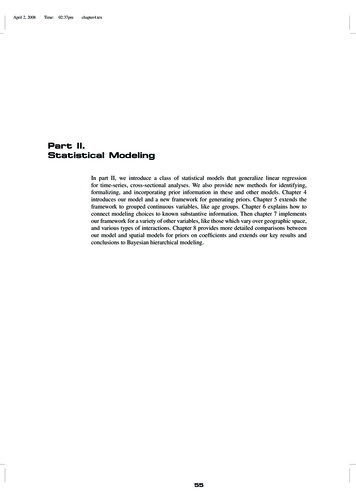
Example : modeling invoice amount according to timespent on website – We could try simple linear regression(y a*x b)Our way to simplify reality: a« straight line » modelparametersInvoice amount a*Time spent on site bDependentvariableWhat we wereunable tocapture withour model residualsExplanatoryvariableErrors (Residuals)PS: we chose linear modeling, but this was absolutely not mandatory.18
ANOVA may also be perceived as a statistical model (qualitativeexplanatory variables)modelModelSalary SalaryOne parameteraverage(reference level) distance(average of the considered level) residualsTwo parametersEarthReferencelevelPlutoOriginMarsErrors (Residuals)ANOVA, linear regression & ANCOVA are linear models19
Modeling – parameter estimation. The case of simple linearregressionThe best parameter values are those thatminimize the residuals sum of squares:𝑛𝑆 𝑎, 𝑏 𝑦𝑖 𝑎𝑥𝑖 𝑏2𝑖 1Errors oiceamount (line)This is what we call Least Squareestimation20
Example: modeling invoice amount according to timespent on website - XLSTAT21
Example: modeling invoice amount according to timespent on website – simple linear regression, XLSTAToutputsParameter estimations(least squares)Confidence intervalsaround the estimationbaP-values related to:H0 : parameter 0Ha : parameter 0Equation could be used to predict invoice amountaccording to new values of time spent on website22
Example: modeling invoice amount according to timespent on website – simple linear regression, XLSTAToutputsR² reflects goodness-of-fit (preferAdjusted R²). 0 R² 1Confidence interval ofthe model (based onparameter estimations)Confidence interval of thepredictions (95% of newpredictions will lie inside)23
Linear model –Assumptionsabout residualsA linear model is only reliableunder certain conditionsassociated to residuals24
Linear model: assumptions about residualsIndependenceNormalityNo autocorrelation. One measurementResiduals should follow a normalper individual.distribution.Not too many outliersHomoscedasticityIn general, no more than 5% of outliersResiduals should have a homogeneousamong residuals.variance.25
Graphical examination of the assumptionsabout residuals Residuals vs explanatory variables chartDots are homogeneously distributed around the y 0 line model is reliable26
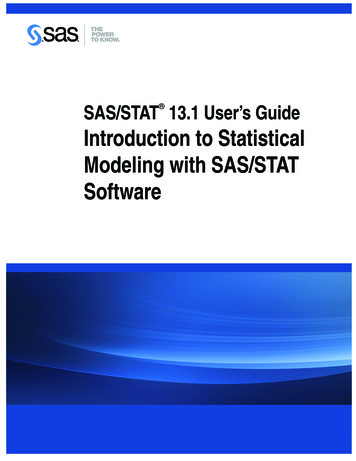
Assumptions about residuals: common patterns of violationViolating the homoscedasticityassumption ( varianceheterogeneity)Normalized residualsNormalized residualsViolating the independenceassumption ( autocorrelatedresiduals)TimeFrequently occurs in time seriesimplying periodicityAgeFrequently appears when variance isa function of the mean27
Assumptions about residuals: solutions when violated Think about outliers (eliminate them?) Transform y or x data (log, square root, Box-Cox ) Use a more convenient model (non-linear, Poisson ) Autocorrelation: use the Cochrane-Orcutt model (XLSTAT-Forecast)28
Multiple linearregressiony a*x1 b*x2 .29
Multiple linearregression principlesInvestigate the linear influence ofseveral explanatory variables onthe dependent variable; increasepredictive quality30
Multiple linearregression warningsIn addition to the assumptionsabout residuals: beware ofoverfitting & multicolinearity31
Adding explanatory variables – Multiple linearregression – warnings Adding explanatory variables will increase the R² Warning: do not add too many of themTo avoid obtaining models that are too fitted on your particular data, and that willconsequently be less generalizable.The AIC model quality index builds a compromise between:A good fitting to the data.A low number of parameters.AIC is a relative quality index that should only be used to compare models with eachother. The model with the lowest AIC is the best model in the model set. Warning: beware of redundant variablesSome correlated explanatory variables may hide each other in terms of effects on thedependent variable. This is called multicolinearity (VIF index 5).Examples : day temperature & night temperature; weight & height32
Linear modeling of invoice amount according to a set ofvariables – Multiple linear regressionQuestion: which variables (D-G columns) have the strongest linear influence on invoice amount? Can wepredict invoice amount of two new clients?33
Linear modeling of invoice amount according to a set ofvariables – Multiple linear regression - XLSTAT34
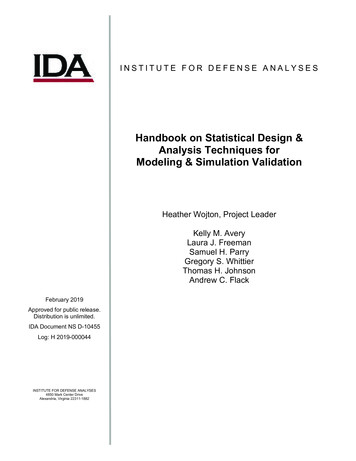
Linear modeling of invoice amount according to a set ofvariables – Multiple linear regression – ExaminingMulticolinearityHigh VIF ( 5) Redundant variablesSolution: exclude one of these 2 variables and re-launch the model35
Linear modeling of invoice amount according to a set ofvariables – Multiple linear regression excluding heightInterpretation : Weight as a significant positive effect on Invoice amount36
Linear modeling of invoice amount according to a set ofvariables – Prediction37
According to the type andnumber of dependent andexplanatory variables,several solutions areavailableWhat statisticalmodeling methodshould you choose?Link: choose an appropriatemodeling tool according to yoursituation38
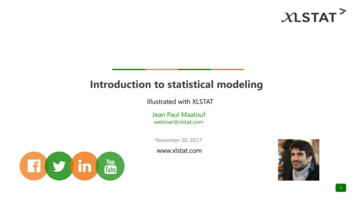
Conclusion: Let’s get back to this question about height.Different models to answer the same questionSomebody asks you: what is theheight of French people?123It depends linearly on age and origin4Height of French people: dependent variableANCOVATheir height has this average and thatstandard deviationIt depends linearly on age and father’sheight5Normal distribution modelMultiple linear regressionIt depends on geographic originIt depends on origin and genderOne-way ANOVAIt depends linearly on ageSimple linear regression62-way ANOVAEtc. etc.7Quantitative explanatory var.Qualitative explanatory var.39
In summary 40
Introduction to statistical modeling - summary Statistical modeling allows to:– Investigate how dependent variables evolve according to explanatory variablesusing a mathematical equation that involves parameters.– Predict using this equation Linear models are reliable only under certain assumptions related toresiduals: normality, homoscedasticity, absence of autocorrelation & nottoo many outliers Beware of problems related to the introduction of too many explanatoryvariables: overfitting & multicollinearity. According to variable types, different models are available.41
Thanks for attending!All the tools we saw are available in all XLSTAT solutions (except XLSTAT-Free)Download 30-DaytrialDiscover ourproductsSurvey time 42
Appendix: Alternative modeling tools Tables with a high number of explanatory variables ( nb. Ofobservations) with potentially important multicollinearity: PLSregression Supervised Machine Learning: KNN, Naïve Bayes, SVM (especially forprediction); classification / regression trees43
Appendix: residuals-alternative verificationmethodsIndependenceNormalityRun a Durbin-Watson test on std.Run a normality test on std. Residuals.Residuals (XLSTAT-Forecast).Not too many outliersHomoscedasticityCheck that not more than 5% of std.Run a heteroscedasticity test (Breusch-residuals are higher than 1.96.Pagan or White) on std. residuals.44
14 Principles of Statistical Modeling Definition A statistical model is a simplified representation of a phenomenon using numbers. It allows to better understand reality and to do predictions. How models work technically A model allows to explain one or several dependent variables using one or several independent variable