Transcription
Lecture Notes on Statistical Methods(by Tom Co 9/23/2007, 10/15/2007)Charateristics of a Good Engineering Experiment1. Necessity.a) objective is well formulatedb) economicalc) results are needed for decision, understanding and process improvement2. Scope.a) significant variables are tested within important rangeb) (boundary and initial) conditions are properly set upc) results are representative of general case, e.g. scalable3. Reproducibility and Statistical Significancea) enough trials need to be taken to assess confidenceb) results must be reproducible for accuracy and precision of prediction4. Realizationa) results can be applied to real process or systemb) data are relevant to the real problem5. Analysisa) statistical analysis of data can and are appliedb) the quality and confidence of the results including models areproperly assessedGeneral Concepts1. Random Variable-a measured variable that takes on a range of possible values which are random ( i.e. lackingexact predictability)Two types of random variables:a. discreteExample:b. continuousExample:2. (Statictical) Event- number of ceramic rasching rings per cubic feet of absorption column the void fraction per cross section area of the absorption columnan occurence of the random variable taking on some specified values or range of values. 200Example: the number of ceramic rasching rings per cubic feet is greater than 2001
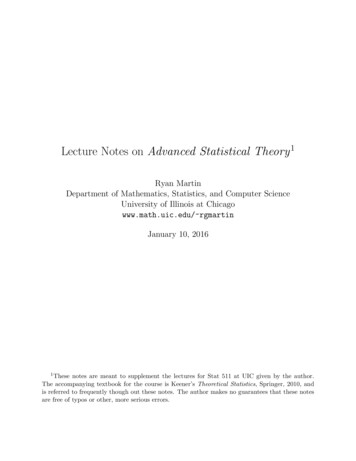
0.25 0.5Example: the void fraction per unit per cross section area is between 0.25 and 0.53. Probability-The likelihood (normalized frequency) for the occurence of an event.Example:Pr 0.25 0.5 0.25Special case: When random variable is discrete, then discrete probability is the ratio of the[number of cases favorable to an event] to the [number of all possible cases]also known as the frequency of the event.( For a list of properties of probabilities, see Appendix 1. )4. Probability Distribution-a function ( or mapping ) of events to probabilitiesMotivation:Using historical data and experience (or assumptions), we want a convenient way to estimateor predict probabilities of eventsMethods:a. Using histogramsoa grouping of collected data into categorized bins (e.g.\ range of values)Figure 1.2
Pr 1.4 1.8 0.2105 0.1053 0.1579 0.0526 0.5263( See Appendix 7 for details on using Excel to create histograms.)b. Using probability density functions ( pdf )oa continuous approximation of a frequency histogramFigure 2.Pr !For a list of important probability distributions, see Appendix 2 and 3.ofor discrete random variables, the function becomes the probability mass function(pmf) which has relevance only at the discrete points.Pr " ( Examples of these are given in Appendix 2.) They are usually represented as acurve with dots at the discrete points; or, if the discrete random variables are spreadevenly, the pmf can be represented by bar-charts.c.Using cumulative distribution functions (cdf)oa distribution that yields the probabilities of a one-sided range of random variables# Pr 3! %
Area % !aoaFor discrete random variables, the cumulative probabilities are given byPr & " '(!Measures of Central Tendency:Let and " be the probability density function and probability mass function,respectively, of the population:a) Population Mean ( “Expected Value of x” )%) * #*,-.,/*/0 , *" 1 . 230 %or) & %('(%b) Sample Mean ( Average )Measures of Variabilitya) Population Variance: " * .0# 3-3 , *" 1 . 230 7689 6 4 ,%: ; ) ; * #*,-.,/*/0 , *" 1 . 230 %or4
:; & ) %('(%;b) Sample Variance:0; " * .0# 3-3 , *" 1 . 230 7689 6 4, 1;The population standard deviation and sample standard deviation are given by σ and s,respectively.Other Measures:Pr ?@A6!7 0.5i. Median: 50% of the population is less than the median pointththii. The first quartile ( 25 percentile) and third quartile ( 75 percentile ) can be used toidentify outliers ( see appendix 6 for details ).iii. Mode: peak points of the probability distribution functions, 0 ,;B0 ;Some Important Properties:21. The binomial distribution has: mean: µ np and variance: σ np(1-p).2. As n becomes large, the binomial distribution approaches a normal distribution3. The mean of a normal distribution is µ while the standard deviation is σ. ):4. Define a new variable z, known as the standard scores, asC If x is normally distributed with mean µ and standard deviation σ,z will follow a standard normal distribution with mean equal to zero and standard deviationequal to one.5. Let x1, x2, , xn be n samples taken independently from the same population with a fixedprobability distribution, then the sum7D & 6689will approach a normal distribution as n approaches infinity.6. In particular, the sample average, i.e. 4 D/,, will be normally distributed with a mean equalto that of the original population. This is also known as the Central limit theorem.5
7. Another result of the Central limit theorem is that the standard deviation of the distribution ofthe sample averages will be equal to F: ,I. (See Appendix 5 for derivation of this fact.)8. If n is small (e.g. 20), a correction to the Central limit theorem is to use a t-distributioninstead, with degree of freedom, v (n-1), where the t-scores are used instead of z-scores 4 )- 0J , 9. Let Y1, Y2, , YN be independent N random variables, each following a standard normaldistribution. Then the sum of squares given byMK & L6;689will follow a Chi-square distribution with the degree of freedom, ν N . (For every constraintimposed on the N random variables, the degree of freedom is reduced accordingly. Forinstance, if the sum of random variables has to be equal to a fixed number, say 120, then thedegree of freedom is reduced by 1.)6
Application 1: Generating Confidence Intervals for Sample MeansMain Problem:-The sample mean 4 is supposed to estimate the population mean µ. This will yield only a“point”-estimate, which has a very low probability of being exactly equal to µ.Instead, we want to generate an interval, e.g. 4 N, P N such that we are confident, withina prescribed confidence level, that the real value of µ is inside this interval.Procedure:Example: Consider a 10-sample set given 1. Determine the value of t-score that would yield the required confidence level based on tdistribution.Example: For a confidence level of 95%, we want to find the value of - from the tdistribution in which the two-tail probability is equal to 5%. Since , 10, thedegree of freedom is 9. Using the Excel function, we find-conTidence interval TINV 0.05,9 2.26222. Calculate sample average 4 and sample standard deviation s.Example: (from above data) 4 7689 6 1.2219,,0 7689 6 4, 1; 0.0081983. Calculate the interval estimate based on t-scores : (Note: the value 0/ , is also known as the“standard error”. ) 4 )- 0J , aN 4 ) -conTidence intervalExample: (continuing from above)N 2.26220.008198 100 , 0.005865Thus, with 95% confidence, the population mean can be estimated as) b 1.2219 0.005865, 1.2219 0.005865 1.2160, 1.22787
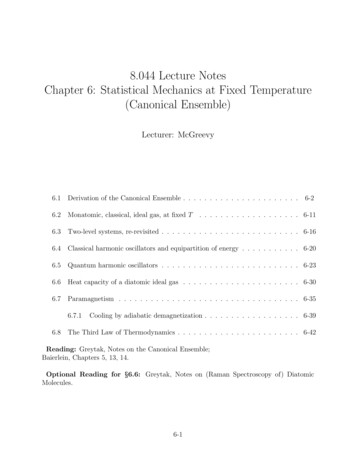
Application 2: Calculating Sample SizesMain Problem:-We want to estimate the population mean µ to within a specified precision.-Assuming we have a reasonable idea of the standard deviation σ of the population, we needto determine how many samples are needed in order to satisfy the required precision.Procedure:Example: The recipe of a batch process is known to yield products that have astandard deviation of 0.02 g/liter of impurities.We want to determine how many batch samples to measure such that within a 95%confidence interval, the measured concentration of impurities will be 0.015 g/liter of thesample mean.1. Since we have not yet done the actual measurements, we assume that the sample standarddeviation s is the same as the population standard deviation σ. This assumption will allow usto calculate the critical values based on the t-distribution. For a 95% confidence interval, 4 )N- 0 :J ,J , a, c-conTidence interval: ;: ;d c d eTINV 0.05, , 1 f;NNExample: Based on the given values above, i.e. :and N 0.015 g/liter,, g0.020 ;h eTINV 0.05, , 1 f;0.015 0.02 g/liter Eqn 1Note that n appears on both sides of the equation. One approach is assume a standardnormal distribution instead of the t-distribution. However, this is valid only if the samplesize is large. A more accurate method is to use computational tools such as an Excelspreadsheet to solve the equation. Build the spreadsheet shown below: ( B1/B2 *TINV(0.05,A5-1 ) ) 2 A5-B5Where RHS stands for the right hand side of equation (1). Then obtain the smallestvalue of n (must be integer) such that the value of n-RHS is positive. As shown below,we need n 10 batch samples.8
9
Application 3: Hypothesis Testing : Whether Two Sample Means are SignificantlyDifferentMain Problem:-Given two sample groups of size n1 and n2, each yielding sample means 49 andstandard deviations, 09 and 0; . 4; , andAssuming both samples are obtained from the same populations with the same standarddeviation σ, we want to determine whether the two sample means are significantly different(based on a desired confidence level.)Procedure:Example: Two sets of samples of the distillate concentrations were collected one weekapart, yielding the following calculations:Week 1k10Pl0.9220.012Week 2200.9030.015mWe want to know if the mean of week 2 is significantly different from the meanof week 1 using a 99% confidence interval.1. Set up the null hypothesis Ho and the alternative hypothesis Ha.HoHa 49 4; 49 n 4;2. Calculate the critical value of t-distribution needed for a confidence interval of 99%confidence interval, with a degree of freedom equal to : ,9 ,; 2.Example: From our given values, the degree of freedom is 20 10-2 28. With a 99%confidence interval, we find:-critical TINV 0.01,28 2.7633. Next, calculate a pooled standard deviation given by the formula:0o ,9 1 09; ,; 1 0;;,9 ,; 2Example: From our given values, we find:0o 9 0.012; 19 0.015; 0.014102810
4. Calculate the t-score for the difference of the sample means- 49 4;0o p11 ,9 ,;Example: From our given values, and the calculated sp:- 0.922 0.903 3.478110.01410p10 205. Compare t score with tcritical. If the t score is beyond the confidence interval, then we rejectthe null hypothesis and accept the alternative hypothesis.Example: Since - -critical , i.e. 3.478 2.763, we reject the null hypothesis andconclude that the sample mean of week 2 is significantly different from thesample mean of week 1.Remarks:a. There are two types of errors that are possible when using hypothesis testing. Type 1error is the error when the null hypothesis was true but was rejected. Type 2 error occurswhen the null hypothesis was false but was accepted.b. The hypothesis testing method can be used in several other comparisons. Appendix 4lists some of the important cases together with the type of distributions used to determineconfidence intervals.c.The table in Appendix 4 shows two entries when comparing two sampled means. Entry 8considers the case in which the standard deviations of the populations used for eachsample group are the same (this was discussed in this section). Entry 9, however,considers the case when the standard deviation may have been different for thepopulation that yielded the sample means. In this case, the degree of freedom requires amore complicated evaluation that may yield a non-integer result. When this happens, thefractional part is simply dropped.11
Appendix 1. Properties of ProbabilitiesLet A and B be events. Pr q s is the conditional probability, i.e. the probability of eventA on the condition that event B has occurred.1. General relationships:Pr all events 1Pr no events 0Pr not q 1 Pr qPr q u s Pr q s Pr s Pr s q Pr qPr q v s Pr q Pr s Pr q u s12342. Special Cases:12Events A and B are independentEvents A and B are mutuallyexclusive, i.e. q u s 03. Bayes’ Formula:Pr s q Pr q s Pr qPr s q Pr sPr q u s Pr q Pr sPr q v s Pr q Pr sPr q s Pr sPr q12
Appendix 2. Some Discrete Probability Distributions1. Binomial DistributionLet n be the number of independent trials, k be the number of successful occurrence and pbe the probability of success for a single trial, thenPr w ,, ,!y 1 w! , w !9 yAvailable Excel functions:BINOMDIST( k, n, p, cum )Binomial probabilitydistribution function 0 w ,k number of successn number of trialsp probability of single trialcum TRUE (for cumulative)and FALSE (forprobability)2. Poisson DistributionLet k be the number of successful occurrence in τ time units, λ be the expected numberof successful occurrences, i.e. let -4 be the average time for a successful occurrence, then{z -4zyPr w z 3 w!13
Available Excel function:POISSON( k, λ, cum )Poisson probabilitydistribution function 0 w, z14k number of successλ expected number of successcum TRUE (for cumulative)and FALSE (forprobability)
Appendix 3. Some Continuous Probability Distributions1. Uniform Distribtuion 1 } 3 3 0 12. Normal Distribution ( also known as Gaussian distribution and denoted N( µ,σ ) ) 1: 2 9 ' c3 ; dSpecial Case: standard normal distribution mean: µ 0, standard deviation :σ 1Remarks:a. The normal distribution function is symmetric around the mean µ.b. Available functions in Excel are:NORMDIST( x, µ, σ, cum )NORMSDIST( z )NORMINV( Pr, µ, σ )NORMSINV( Pr )Normal distribution(if cum FALSE, then yieldnormal pdf)Standard normal cumulativedistributionInverse normal cumulativedistributionInverse standard normalcumulative distribution15where,x random variablez standard score' µ meanσ standard deviationPr probability
Example 1: Suppose the random variable x is known to be normally distributedwith a mean of 3 and standard deviation of 0.6. Determine Pr 2 5 .Solution:NORMDIST(5, 3, 0.6, TRUE)-NORMDIST(2, 3, 0.6, TRUE) 0.952Or with C9 3.3333 and C; 1.6667. . NORMSDIST(3.3333)-NORMSDIST(-1.6667) 0.952 ; Example 2: Suppose the random variable x is known to be normally distributed,determine the mean and standard deviation such that Pr 7 0.3 and Pr 10 0.8.Solution:9 C9 NORMSINV(0.8) 0.8416 ; C; NORMSINV(0.3) -0.5244 Solving simultaneously for mean and standard deviation, we get)1 0.841610cd c d c d µ 8.1517 , σ 2.1962:1 0.52443. Chi-Square ( χ 2) Distribution1 g h27 J;1 F J; 9I 3 J; ΓF J2IAχ(a,ν)aDefine the right tail area by:%q , ; !where ; is the ; pdf16
Available Excel functions:CHIDIST( x, ν )Right-tail probability of a Chisquare distributionCHIINV( Pr, ν )Inverse of the right-tailprobability of a Chi-squaredistributionwhere,x random variableν degree offreedom4. t – Distribution 1 Γ 1 J2 ΓF J2I ; 1 9 J;Available Excel functions:TDIST( x, ν, 1)TDIST( x, ν, 2)TINV( Pr, ν )Right-tail probability of at distribution( x is nonnegative )Two-tail probability of at distribution( x is nonnegative )where,x random variableν degree offreedomInverse of the two-tailprobability of a t distributionOther Important Probability Distributions:5. Log Normal Distribution 1 2 17 9 ' h g 3 ;
6. Exponential Distribution ( Note: discrete version is a Poisson distribution ) 3 '7. Beta Distribution Γ 9 1 Γ Γ 18 9; Γ · gamma function
8. Gamma Distribution gh 9 3 'Γ 9. Weibull Distribution g h exp g g h h 19
Available functions in Excel:LOGNORMDIST( x, α, β )Log normal cumulativedistribution( x is nonnegative )LOGINV( Pr, α, β)Inverse log normalcumulative distributionEXPONDIST( x, γ, cum)Exponential distribution( x is nonnegative)BETADIST( x , α, β, A, B)BETAINV( Pr, α, β, A, B)GAMMADIST( x, α, β, cum )where,x random variableBeta cumulative distributionα,β, γ parameters(q s )Pr probabilityA lower boundInverse beta cumulativeB upper bounddistributioncum TRUE( cdf ) orFALSE( pdf )Gamma distribution( x is nonnegative )GAMMAINV( Pr, α, β )Inverse Gamma distributionWEIBULL( x, α, β, cum )Weibull distribution20
Appendix 4. Table of Hypothesis TestsGiven/CalcTest12345x significantly differentfrom µx significantly lowerthan µx significantly higherthan µx significantlydifferent fromµ ( σ known )x significantlydifferent fromµ ( σ unknown )6Two sample meanssignificantly different( σ same for both )7Mean for pairedcomparison of samples,xi yi-zi , is onx µ2 x µ LeftσN(0,1) x µ n2N(0,1)x µx µns2t (n-1)x µ2N(0,1)x1 x22t (n-1)µ 02t (n1 n2-2)x1 x 22 2 ()δ δ2 t 12 δ1δ22 n 1 n 1 12 x1 x 2σ x µx µRight Hox1 x 2 1 1n1 n 2σxns x1 x21n1S8x1 x2( σ same for both ) 1n2withS q s1 (1 q )s 2q n1 1n1 n 2 2x1 x 29x1 x2 s1 2s 2 2n1n2withδk 10s12 s 2 2 11s σ s12s2(n 1)212s2σ2sk 2nkLeftF ( n1 1 , n 2 1 )2χ 2 (n 1)s12 s 2 2s σ
Appendix 5. Some Important Formulas for Means and Variances1. Let E(x) be the “expected value” of x, with respect to a probability distribution functiongiven by p(x), defined by the integral% %2. The expected values of a sum of random variables is the sum of expected values:% § %%%%% % % % % 3. The expected value of a product of independent random variable is the product ofexpected values:% § %%% % % 4. The mean of the population, ), is the expected value of random variable x,) 5. The variance of a random variable x is the expected value of ;, i.e.; : ; cF I d )6. The variance of a sum is the sum of variances:;;% ) %; ; cF I d c )' F ) Iª d c )';; 2 )' F ) I F ) I d; )' ; 2 )' F ) I cF ) I d 22
7. Variance of a scaled random variable, kx is w ; :;; w cFw w I d cFw w I d w w) w ; ) ; w ; ) ; w ; 8. The expected value of the sample mean is the population mean:77689689; 7689 6111 4 & 6 & ) ,) ),,,,Thus, the sample mean is an “unbiased” estimator of the population mean.;9. The variance of sample means is : J, :776897689 7689 6 6 6 4 & & c d,,,7 &689111 6 ; & : ; ; ,: ;;,,,689; : J,10. The expected value of the sample variance is population variance: 6 ; 6 ) ) ; 6 ) ; 2) 6 ) ) ; 6 ) ; 2) 6 ) ) ; : ; ); 4 ; 4 ) ) ; 4 ) ; 2) 4 ) ) ; 4 ) ; 2) 4 ) ) ;:; );,777; 4166890; & 6; 2 4 & 6 , 4 ; , 1, 171 & 6; , 4 ; , 1689 0 ;7689689711 & 6; , 4 ; & 6; , 4 ; , 1, 16896891: , : ; ) ; , ) ; : ;, 1,Thus, the sample variance is the “unbiased” estimator of the population variance. ;23
Appendix 6. Quartile Method for Determination of Outliers(tbco 10/16/2007)Method:Let K9 be the first quartile and K be the third quartile.1. Compute the difference, called the inter-quartile range: K K K9 .2. Then calculate the inner fence:Minimum value:K9 1.5 K Maximum value:K; 1.5 K and the outer fence:Minimum value:K9 3 K Maximum value:K; 3 K 3. The values outside inner fence are considered “mild outliers”, while the valuesoutside the outer fence are considered as “extreme outliers”.Example: QUARTILE(B3:B24,1) QUARTILE(B3:B24,1) G4-G3 G31.5*G5 G4 1.5*G5 G33*G5 G4 3*G5 IF(OR(B17 G 8,B17 H 8),"out","in") IF(OR(B21 G 7,B21 H 7),"out","in")24
Appendix 7. Histogram Macro in Excel(tbco 10/17/2007)Purpose of histograms:To visualize the count or frequency of data inside chosen intervals known as bins.Histogram MacroNote: We have built a macro for the construction of histograms based on intervals. Excelhas a built-in function for making histograms but require adjustment of the bar chart toobtain standard histograms.DownloadingA zipped version of the file histogram.bas is available for download using thelink: www.chem.mtu.edu/ tbco/cm3215/histogram.zipActivation1. With an open excel worksheet, click [Alt-F11] to open the VBA (visual basic forapplications) editor.2. Click [Ctrl-M] and import the file histogram.bas.3. Click [Alt-F11] to return to the Excel worksheet.Using the Macro1. Make sure data is available in the worksheet.2. Invoke the histogram macro using [CTRL-h].( Alternatively, you can select[VIEW] [Macro] [View Macros ] menu item then select [histogram] and click [Run].3. Follow the instructions prompted by the input boxes:a. Data range: click-drag to select cells.b. Minimum bin value: can be less than the minimum data valuec. Maximum bin value: can be greater than the maximum data valued. Bin interval width: must be a fraction of the rangee. Select 1 (Frequency count) or 2(relative frequency)f. Cell to store results: row location must be greater than row 2.4. Change the graph if desired, e.g. axis titles and range.25
Example:Remarks:1. For the results shown, we used the following input:a. Cell range: A 2: A 23b. Minimum bin value: 1.1c. Maximum bin value: 1.4d. Interval width:0.02e. Type:2f. Cell to store results: D 22. The columns labeled bins, frequency count and relative frequency are histogramanalysis results.3. The columns labeled xbins and yrelative frequency are just used for plotting thehistogram.4. The axis range and titles of the plot were then modified manually.26
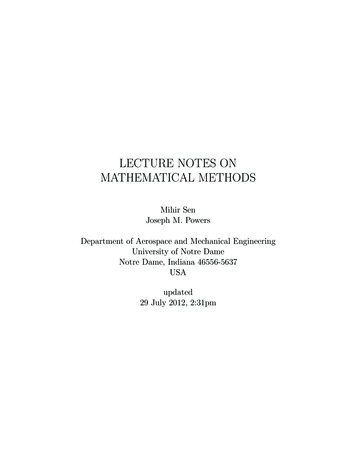
Appendix 8. Normal Quantile Plots(tbco 10/18/2007)Purpose:To check whether a data is normally distributed.(Remark: histograms of small data sets can be very sensitive to the choice of bin width,but cumulative frequency information is more robust.)Method:1. Arrange the data in ascending order: 9; 7 . . 0.5 J2. Calculate the corresponding quantile: 6 ,.3. Determine the normal score zi that would yield this cumulative frequency.C6 NORMSINV 6i.e., the inverse standard normal cumulative distribution function of qi.4. Plot data versus the normal score, e.g. zi vs di5. If the plot lie close to a line that passes through z 0, then the data is considered close tonormally distributed.Example:Consider the following 23.20Then a spreadsheet could be constructed as follows: (D2-0.5)/30 NORMSINV(E5)273.333.373.603.343.46
and then plot column F vs column c:The data fall pretty much on a line, thus we can conclude that the data is normallydistributed.28
Appendix 9. Plotting Normal Distribution Curve Using Excel(tbco 10/19/2007)Purpose:To plot a normal distribution curve (probability distribution function) based on the givenvalues of mean and standard deviation.Procedure:1. First set up cells containing mean and standard deviation2. Calculate a range of values of the random variable. For example, you can first evaluatethe values ranging from three sigma below the mean and three sigma values above themean.3. Use the Excel function NORMDIST( x, mean, sd, FALSE) to calculate the pdf values.(Note: the FALSE value is to set the mode to pdf, otherwise it yields cumulativefrequencies)4. Plot the pdf vs. the random variable. NORMDIST(D2, B 2, B 3,FALSE) B2-3*B3 B2 3*B329
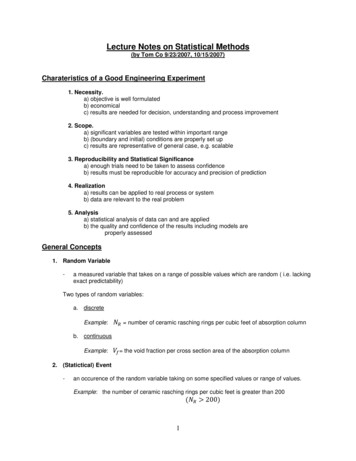
Appendix 10. Confidence Intervals Using Excel(tbc 10/20/2007)Purpose:Using built-in functions, we can obtain the confidence interval of the population mean basedon small samples using the t-distribution.Method:1. Calculate the mean, 4 , and standard deviation, 0, using the built-in functions AVERAGEand STDEV.2. Calculate the standard error (SE),0¶ ,3. Determine the scaling factor of the standard error that would yield the desired confidencelevel.For example, for a 95% confidence interval:a. Small sample size ( , B 20 ):scaling factor -· TINV 0.05, , 1b. Large sample size:scaling factor ,· NORMSINV 0.0254. Evaluate the lower limit and upper limit of the confidence interval,Lower limit 4 scaling factor ¶ Upper limit 4 scaling factor ¶ 5. If desired, plot the mean together with the confidence limits using error bars.Caution:The usual convention for error bars is to plot: 4 º ¶ . This means a 68.3% confidenceinterval based on normal distributions. For small samples, this leads to even lowerconfidence levels since t-distributions are needed. However, due to the difficulty ofobtaining inverse t-distributions in the past (requiring interpolations from table of tdistribution data), the practice of just using the standard error SE is common and accepted.Below, we show an example of plotting the 95% confidence interval in terms of error bars.When doing so, please indicate that these are “estimates with 95% confidence intervals”.Otherwise, most scientists and statisticians will probably misinterpret your plots.30
Example:31
How error bars were included in the plots above:1. Do an x-y (scatter) plot mean vs. temperature.2. In the toolbar, select [Chart Tools] [Layout] [Error Bars] [More Error BarsOptions ]3. In the pop-up window, choose the [custom] selection, then click [Specify Value] button.For the t-distribution case, we selected the range [ D 9: D 11] for both positive andnegative errors values. The error bars should now appear.32
References1. L. Gonick and W. Smith. “Cartoon Guide to Statistics”. Harper Collins PublishersInc. New York, NY. 1993.2. C. Mack. “Essentials of Statistics for Scientist and Technologists”. Plenum Press.New York, NY. 1966.3. G. Geoffrey Vining. “Statistical Methods for Engineers”. Brooks Cole Publishing Co.Pacific Grove, CA. 1998.4. S. Meyer. “Data Analysis for Scientists and Engineers”. J. Wiley and Sons, Inc. NewYork, NY. 1975.33
b. Using probability density functions ( pdf ) o a continuous approximation of a frequency histogram Figure 2. ˆ ! For a list of important probability distributions, see Appendix 2 and 3. o for discrete random variables, the function becomes the probability mass functi