Transcription
12Qualitative Data,Analysis, and DesignOutlineOverviewQualitative Inquiry and Basic PrinciplesQualitative DataWorldviewGeneral ApproachesThe Qualitative MetaphorText as Data: Basic StrategiesRecap: The Qualitative ChallengeCodingRelational StrategiesHierarchyTypologyNetworksTables and Cross TabulationsInseparable Data Collection andAnalysisEmergent MethodologyReliability and Validity: TrustworthinessCredibilityPattern MatchingResearch DesignsCase StudyPhenomenologyEthnographyNarrativeMixed MethodsQualitative Research in the LiteratureClassroom ClimateThe Art of TeachingMinority TeachersLearning Disability Coping StrategiesDyslexiaParental InvolvementDetrackingImmigrant NewcomersScaffoldingData Analysis SoftwareSummaryKey TermsApplication ExercisesStudent Study SiteReferencesOverviewRecall from the two previous chapters that researchers seek the guidance of a research design,a blueprint for collecting data to answer their questions. Those chapters described experimental and non-intervention designs, often incorporating statistical analysis, that are commonlyused in educational research. This chapter continues a sampling of research designs with a342342
Ch ap ter 12: Qu al i t ati ve Dat a, A n alys i s , an d Des i g nfocus on common qualitative research. The orientation of qualitative researchers contrastssharply with that of quantitative researchers on many dimensions. Their thinking generatesquestions that are answered with an emergent methodology, and their approach to rich sourcesof data requires creativity for its analysis. Such divergent (“outside the box”) thinking is apparent in the tasks of designing and analyzing qualitative research. This will become clear in thischapter when we focus on how researchers analyze qualitative studies to extract the mostmeaning while ruling out alternative explanations.“Emergent” designs in the tradition of qualitative research suggest a process that is notpredetermined. A design that emerges is one that is not finalized at the outset. Strategies fordata collection are open and depend on context. Revisions are made until the researcher issatisfied that the direction taken affords the greatest potential for discovery, meaningfulanswers to questions posed, or the generation of new hypotheses (or questions). Of course,qualitative researchers begin with an interest or guiding question, but early decisions aboutwhat type of data should be collected and how it should be collected will undoubtedly be revisedas the research progresses. A qualitative research design evolves and is likely not clarified untildata collection ends. What may start as a case study may indeed develop into a design that moreclosely resembles a phenomenological study (described later). For this reason, this chapter isorganized somewhat differently. Qualitative research designs are described after types ofqualitative data and methods of analysis are described. The type of data collected and theapproach to its analysis are more relevant to a researcher’s compelling argument and soundconclusion than a category name placed on a general approach to data collection.After describing qualitative data and strategies for analysis, this chapter examines fivebroad classifications of designs: case study, phenomenological, ethnographic, narrative, andmixed methods. These designs require complex collection of data as sources of evidence forclaims about the meaning of the data. Qualitative researchers become skilled at coding andpattern seeking using analytic induction. Making sense of data in the form of graphics, video,audio, and text requires clear thinking that is aided by theory, models, constructs, and perhapsmetaphor. Because qualitative data analysis is less prescribed than statistical analysis and onegoal is the discovery of new ideas and their associations, many would argue that it presents agreater challenge. Fortunately, techniques, strategies, and procedures have been developed tohelp qualitative researchers extract meaning from their data (including software) and interpretit in ways that enhance our understanding of complex phenomena.Qualitative Inquiry and Basic PrinciplesWhile there is general consensus about classification systems among researchers who use quantitative research designs—how they are distinguished and what to call them—there is lessconsensus among qualitative researchers about designs. The same can be said for quantitativeand qualitative worldviews. One leader in the field of qualitative research in education, SharanMerriam, notes that “there is almost no consistency across writers in how [the philosophical]aspect of qualitative research is discussed” (2009, p. 8). She also adds that, in true qualitativefashion, each writer makes sense of the field in a personal, socially constructed way. The field ofqualitative research is indeed fragmented with confusing language in regard to its orientationand methodological principles of data collection and analysis. Because there is little consensus3 4 3
344 P a r t I V: D e s i g nandA n a ly s i sabout the classification of qualitative research, Merriam (2009) uses a term that guides thefollowing general discussion: basic qualitative research. This chapter discusses the basic “qualities” of qualitative research, followed by a description of common designs defined by thesequalities. Despite the lack of consensus on types of qualitative research, I believe all qualitativeresearch shares certain characteristics regarding making sense of data. Therefore, the chapterbegins by examining how qualitative researchers approach their data.Qualitative DataMost qualitative researchers would agree with Snider’s (2010) observation that numbers impress,but unfortunately, also conceal far more than they reveal. They would also agree with Davis’s (2007)observation that “good qualitative research has equaled, if not exceeded, quantitative research instatus, relevance, and methodological rigor” (p. 574). Several principles guide the thinking andplanning stages of most qualitative researchers. Qualitative research, in all of its complex designsand methods of data analysis, is guided by the philosophical assumptions of qualitative inquiry:To understand a complex phenomenon, you must consider the multiple “realities” experienced bythe participants themselves—the “insider” perspectives. Natural environments are favored fordiscovering how participants construct their own meaning of events or situations. The search foran objective reality, favored by quantitative researchers, is abandoned to the assumption thatpeople construct their own personalized worlds. For example, the experiences of high schooldropouts, how beginning readers think about their comprehension, how an at-risk school transformed into a high-achieving school, what motivated first-generation women college graduatesin Appalachia, how creativity is fostered in schools—these are all topics suited for qualitativeinquiry. Questions like these yield complex data, although the sources and formats vary.The most common sources of qualitative data include interviews, observations, and documents (Patton, 2002), none of which can be “crunched” easily by statistical software. The description of people’s lived experiences, events, or situations is often described as “thick” (Denzin,1989), meaning attention is given to rich detail, meaningful social and historical contexts andexperiences, and the significance of emotional content in an attempt to open up the word ofwhoever or whatever is being studied. The goal of qualitative data analysis is to uncover emerging themes, patterns, concepts, insights, and understandings (Patton, 2002). Qualitative studiesoften use an analytic framework—a network of linked concepts and classifications—to understand an underlying process; that is, a sequence of events or constructs and how they relate. Hereis one example (an abstract provided by Moorefield-Lang [2010]) of a study that uses commonsources of data to answer (“explore”) a research question under the qualitative paradigm:This study explores the question “Does arts education have a relationship to eighth-grade ruralmiddle school students’ motivation and self-efficacy?”Student questionnaires, focus-group interviews,and follow-up interviews were data collection methods used with 92 eighth-grade middle schoolstudents. Strong emphasis was placed on gathering personal narratives, comments, and opinionsdirectly from the students. Content analysis was used to analyze the student interviews. (p. 1)WorldviewA perspective that favors the social construction of reality described above is usually referred toin education as constructivism, falling clearly under the philosophical orientation called interpretivism. This orientation honors the understanding of a whole phenomenon via the perspective ofthose who actually live it and make sense of it (construct its meaning and interpret it personally).
Ch ap ter 12: Qu al i t ati ve Dat a, A n alys i s , an d Des i g nA clear alternative,and sharply contrasted,paradigm to interpretivism is positivism,closely alignedwith objective measures and quantitative research designs. Quantitative researchers, in contrast toqualitative researchers, are comfortable with an orientation toward understanding the objective worldvia experimental designs that test hypotheses born from theories and result in statistical generalizations that apply to a population at large. The researcher in this case often administers standardized measuring instruments in controlled settings, such as tests of cognitive skill, achievement,and attitudes, and analyzes data using statistical software. The general understanding favored byquantitative, positivist researchers comes from empirical verification of observations, not subjective experiences or internal states (emotions, thoughts, etc.) of research participants.In contrast, the qualitative researcher often is the instrument, relying on his or her skillsto receive information in natural contexts and uncover its meaning by descriptive, exploratory,or explanatory procedures. Qualitative researchers value case studies (or multiple-case studies),for example, whereas quantitative researchers tend to value large sample sizes, manipulationof treatments and conditions, and true experiments or quasi-experiments.Both approaches to research in education have yielded valuable, influential knowledge, and itis clear that debate will continue over which approach is more useful in education. Compelling arguments are offered by advocates of both orientations. Given that many qualitative researchers favorcase studies of a single “unit” (person, school, etc.), the oft-cited criticism of qualitative research islack of generalization. Pioneer qualitative researchers Lincoln and Guba (1985) remind us that “thetrouble with generalizations is that they don’t apply to particulars” (p. 110). The quantitativeresearcher might critically evaluate the qualitative researcher by noting, “What? Your conclusion isbased on only one participant?” And the other would respond, “What? Your conclusion is based ononly one experiment?” Suffice it to say that understanding educational effects and processes mayarise from many different approaches to research, including the mixing of both qualitative andquantitative approaches. There is no need to identify strictly with one orientation or the other.The division in beliefs about knowledge described above has created very differentresearch paradigms, splitting many researchers into quantitative (positivist) and qualitative(interpretivist) “camps.” Both, however, value rigorous data collection and analysis coupled withsound, logical arguments that characterize scientific reasoning, namely a compelling chain ofevidence that supports conclusions. Both camps are keenly aware of rival hypotheses andalternative explanations for their findings, and both attempt to eliminate the plausibility ofcounterhypotheses and their propositions. Further, interpretivist models of qualitative research,such as original grounded theory (Glaser & Strauss, 1967), whereby emerging themes arediscovered and modeled into theory, have evolved into more objective, positivistic approachesto describing the external world, such as that advocated by Charmaz (2000).General ApproachesThe type of understanding sought by qualitative interpretivists demands great flexibility in the dataanalysis process, as it does in the design and data collection phase. Qualitative research methodsare not “routinized,” meaning there are many different ways to think about qualitative research andthe creative approaches that can be used. Good qualitative research contributes to science via alogical chain of reasoning, multiple sources of converging evidence to support an explanation, andruling out rival hypotheses with convincing arguments and solid data. Sampling of research participants in qualitative research is described as purposive, meaning there is far less emphasis ongeneralizing from sample to population and greater attention to a sample “purposely” selected forits potential to yield insight from its illuminative and rich information sources (Patton, 2002, p. 40).3 4 5
346 P a r t I V: D e s i g nandA n a ly s i sMost mindful qualitative research questions are “How” or “What” questions (e.g., “Howdid this happen?”“What is going on here?”) and geared toward complex processes, exploration,and discovery. The analysis itself, naturally, becomes complex. Schram (2006) describesqualitative research as “contested work in progress” (p. 15) and the qualitative predispositionas “embracing complexity, uncovering and challenging taken-for-granted assumptions” (p. 7)and being “comfortable with uncertainty” (p. 6). The aim of qualitative research is closer toproblem generation (“problematizing”) than problem solution (Schram, 2006).Qualitative data collection and analysis usually proceed simultaneously; ongoing findingsaffect what types of data are collected and how they are collected. Making notes, referred to asmemos, as the data collection and analysis proceed is one important data analysis strategy. Thenotes, or possibly sketches, trace the thinking of the researcher and help guide a final conceptualization that answers research questions (or related ones) and offers a theory as an explanation for the answers. These memos support all activities of qualitative data analysis as suggestedby Miles and Huberman (1994): data reduction (extracting the essence), data display (organizing for meaning), and drawing conclusions (explaining the findings). They noted, “Fieldworkis so fascinating, and coding usually so energy absorbing, that you can get overwhelmed withthe flood of particulars—the poignant remark, the appealing personality of the key informant,the telling picture on the hallway bulletin board, the gossip after a key meeting” (p. 72).As noted previously, the entire process of making sense of qualitative data requires creativity. Patterns and themes among complex data don’t usually pop out. The challenge is lessenedby following suggestions provided by Patton (2002, p. 514), including being open to multiplepossibilities or ways to think about a problem, engaging in “mental excursions” using multiplestimuli, “side-tracking” or “zigzagging,” changing patterns of thinking, making linkagesbetween the “seemingly unconnected,” and “playing at it,” all with the intention of “opening theworld to us in some way” (p. 544).The validity of qualitative research is often referred to as trustworthiness or credibility.Common methods of assessing validity include consistency checks. Independent coders cansample raw data and create codes or categories so that the consistency of data reduction methods can be assessed. Also common is the use of stakeholder checks. The research participantswho generated the raw data, often called informants, may be asked to evaluate the interpretations and explanation pulled from the data (e.g., “Does this represent your experience?”“Have I captured the essence of this event?”). Other stakeholders, especially those affected bythe research, may also provide commentary on the results.Qualitative researchers become skilled at coding using procedures as simple as handwrittennote cards or a copy/paste function in Microsoft Word or a similar program as an aid to discovering recurring patterns. They may also use an array of software designed specifically for the purposeof reducing data into manageable, but meaningful, chunks. They are also skilled at forming categories, linking categories using a meaningful system or network, creating themes, and interpreting derived frameworks with reference to theory. Visual models play an important part indescribing the meaning of the data and conveying an understanding to others. The model mayportray a hierarchy or perhaps a causal chain. Process (sequence of events) models are common,as are models related to the arts and humanities (e.g., portraiture or plays). Models must accuratelyreflect the data, of course, but their creation is only limited by the imagination of the researcher.Qualitative data analysis often follows a general inductive approach (as opposed to ahypothetical-deductive one) in the sense that explicit theories are not imposed on the data ina test of a specific hypothesis. Rather, the data are allowed to “speak for themselves” by theemergence of conceptual categories and descriptive themes. These themes are usually embedded
Ch ap ter 12: Qu al i t ati ve Dat a, A n alys i s , an d Des i g n3 4 7in a framework of interconnected ideas that “make sense.” The conceptual framework is theninterpreted by the researcher with reference to the literature on a topic in an attempt to explain,with a theory (or a revision of one), the phenomenon being studied. Many different interpretations are typically considered before the researcher builds a coherent argument in the mosttransparent way possible (revealing how the conclusion was reached) so that others may judgethe validity of the study. This is not to say that qualitative researchers never use deductivereasoning. On the contrary, if a very specific hypothesis can be deduced from a more generaltheory, qualitative researchers may explore this hypothesis using common data collectionmethods (interview, observation, retrieval of documents) to determine whether the predictedoutcomes are evident. Yin (2009), in fact, recommends that theoretical propositions be in placeprior to data collection and analysis in most case studies.Fundamental differences between quantitative and qualitative research are summarizedin Table 12.1. It becomes clear that these different orientations lead to very different strategiesfor answering research questions.Table 12.1 Key Differences Between Quantitative and Qualitative Approaches to Inquiry That Guide DataCollection and AnalysisQuantitative ResearchQualitative ResearchTests hypotheses born from theoryGenerates understanding from patternsGeneralizes from a sample to the populationApplies ideas across contextsFocuses on control to establish cause or permit predictionFocuses on interpreting and understanding a social construction ofmeaning in a natural settingAttends to precise measurements and objective data collectionAttends to accurate description of process via words, texts, etc., andobservationsFavors parsimony and seeks a single truthAppreciates complexity and multiple realitiesConducts analysis that yields a significance levelConducts analysis that seeks insight and metaphorFaces statistical complexityFaces conceptual complexityConducts analysis after data collectionConducts analysis along with data collectionFavors the laboratoryFavors fieldworkUses instruments with psychometric propertiesRelies on researchers who have become skilled at observing,recording, and coding (researcher as instrument)Generates a report that follows a standardized formatGenerates a report of findings that includes expressive language anda personal voiceUses designs that are fixed prior to data collectionAllows designs to emerge during studyOften measures a single-criterion outcome (albeitmultidimensional)Offers multiple sources of evidence (triangulation)Often uses large sample sizes determined by power analysis oracceptable margins of errorOften studies single cases or small groups that build arguments forthe study’s confirmabilityUses statistical scales as dataUses text as data(Continued)
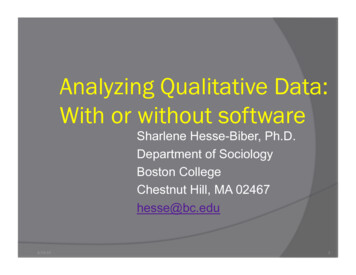
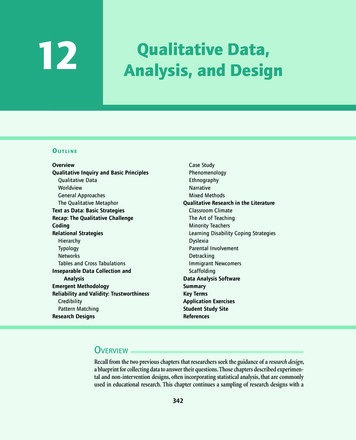
348 P a r t I V: D e s i g nandA n a ly s i sTable 12.1 (Continued)Quantitative ResearchQualitative ResearchFavors standardized tests and instruments that measure constructsFavors interviews, observations, and documentsPerforms data analysis in a prescribed, standardized, linear fashionPerforms data analysis in a creative, iterative, nonlinear,holistic fashionUses reliable and valid dataUses trustworthy, credible, coherent dataThe Qualitative MetaphorGenerally, qualitative data analysts face the task of recording data via a variety of methods(interviews, observation, field notes, etc.), coding and categorizing (using a variety of clustering and classification schemes), attaching concepts to the categories, linking and combining(integrating) abstract concepts, creating theory from emerging themes, and writing an understanding. Metaphors are useful as interpretive tools in this process, serving a heuristic (guiding)role or explaining the elements of a theory.One useful metaphor is a kaleidoscope (Dye, Schatz, Rosenberg, & Coleman, 2000) forthe purpose of describing qualitative data analysis. They refer to grouping similar data bitstogether, then comparing bits within a pile. Differentiation creates subpiles, which eventuallybecome connected by a pattern they share. This process requires continual “back and forth”refinement until a grand concept emerges. For Dye and colleagues, the loose pieces of coloredglass represent raw data bits, the angled mirrors represent categories, and the flat platesrepresent the overarching category. An adaptation of this metaphor appears in Figure 12.1.Another metaphor is a jigsaw puzzle (LeCompte, 2000). Assembling data into an explanation is akin to reassembling puzzle pieces. One strategy is grouping all pieces that lookalike, sky for example, and placing these pieces near the top. Other sketchy-looking objectsmay be grouped together using any dimension (e.g., color) whose properties make conceptual sense. Puzzle pieces will have to be rearranged many times before the reassembled piecesemerge into a coherent pattern. If successful, a whole structure will eventually be built, heldtight by the interconnected pieces. The structure is the model or theory that explains thephenomenon of interest. If a qualitative researcher is studying the high school dropoutphenomenon, for example, the structure that surfaces might be a model of alienation, onederived from the puzzle pieces that link to achievement, socioeconomic status, home environment, self-esteem, social status, and bullying. The puzzle pieces might include sources ofdata such as conversations, observations, school documents and records, and journals, toname a few. Good qualitative analysis in this case would generate a rich and accurate description of alienation as experienced by high school dropouts—their world, why they hold aspecific view, and how it came to be.Yet another metaphor was introduced by Seidel (1998): Qualitative data analysis isbest understand as a symphony based on three elegant but simple notes—noticing, collecting, and thinking. Clearly not linear, the process is described as iterative (a repeatingcycle), recursive (returning to a previous point), and “holographic” (each “note” containsa whole) with “swirls and eddies.” When one notices, one records information and codesit using an organizing framework. When one collects, one shifts and sorts information.
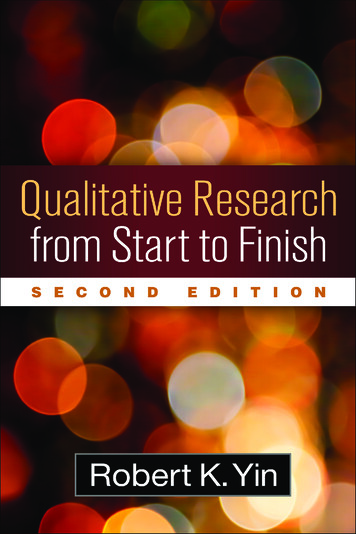
Ch ap ter 12: Qu al i t ati ve Dat a, A n alys i s , an d Des i g n3 4 9Disorganized raw data bitsCategory formation (based onexplicit rule). Note the emergenceof a pattern (clustering)RefinementFinal constellationWhen one thinks, one finds patterns, makes sense of them, and makes discoveries(including “wholes” and “holes”). Seidel also explains these three notes using a threadedDNA analogy as well as a topographic map and landscaping analogy (including usingyour right brain for off-road investigation). As you might expect, this process is made fareasier by software developed by John Seidel and others (Ethnograph) that manages your“notes” as you collect data, code data, write memos about your thinking, and completeyour analysis and writing.Whatever the metaphor, data analysts are frequently “in conversation” with their data(Shank, 2006). Potentially useful conversations may begin with questions such as “What areyou telling me?” “Are you hiding anything?” “Is there anything you want to say?” “How do youexplain that contradiction?” or “Will others believe what you say?” These questions reveal thatqualitative analysis requires becoming immersed in data. There are no superficial or rigidprescriptions for making sense of it all.Source: Adapted from Dye, J. F., Schatz, I. M., Rosenberg, B. A., & Coleman, S, T. (2000, January). Constant comparative method:A kaleidoscope of data. The Qualitative Report, 4(1/2). Retrieved from http://www.nova.edu/ssss/QR/QR4-1/dye.htmlFigure 12.1 A kaleidoscope metaphor describing one approach to analyzing qualitative data.
350 P a r t I V: D e s i g nandA n a ly s i sText as Data: Basic Strategies Triangulation: Amethod used inqualitative researchthat involves crosschecking multipledata sources andcollectionprocedures toevaluate the extentto which allevidence converges. Saturation: Inqualitative research,the point incontinuous datacollection thatsignals little need tocontinue becauseadditional data willserve only to confirman emergingunderstanding.Much qualitative data exists in the form of narrative (text) scripts, commonly gathered frominterviews, survey questions, journals, recorded observations, or existing documents, amongother sources. Words combine into meanings, but meanings must be sorted, interpretationsconsidered, and conclusions reached. One begins with a sharp but flexible focus, recognizing thatrefocusing may be required to extract the greatest meaning and most trustworthy conclusionsfrom the data. For example, I may focus on the literal meaning of a person’s story, only to find apattern in deeper meanings, details not mentioned, an emphasis on time, avoidance of emotionalcontent, or any number of other subtle clues that help identify a coherent theme, and realize thatI should be focusing on the hidden meanings of the story.As noted previously, the sampling plan for gathering text is often purposive, meaningthat participants are selected to serve a specific purpose (not randomly to allow generalization across a population). The purpose of this sampling plan is to maximize the value ofdata for theory development by gathering data rich enough to uncover conceptual relationships. Each sampling unit (person, classroom, school, etc.) may be distinctive by deliberateselection (e.g., two students who rose to the challenge; one succeeding, one not succeeding;and one who didn’t try). Or they may be selected because they share a common characteristic (e.g., first-year teachers); perhaps one participant’s data will help develop a theory, thesecond will refine it, and the third will evaluate it. Perhaps only one school is selectedbecause it defies prediction (e.g., school characteristics suggest poor achievement, yet itconsistently ranks high on all achievement measures—why?). Simply, the sample selecteddepends on its purpose.Qualitative analysis of text is often supplemented with other sources of information tosatisfy the principle of triangulation and increase trust in the validity of the study’s conclusions. It would not be uncommon, for example, to analyze transcribed interviews along withobservational field notes and documents authored by the respondents themselves. The purposeof multiple sources of data is corroboration and converging evidence.Qualitative researchers often keep journals that describe their approaches to data analysis.Being able to retrace your thinking may contribute to the emergence of new ideas, an interpretive path not yet taken, or possibly connections between an early (discarded) idea and a newerdeveloping theme that explains previously noted inconsistencies. A recording of ideas anddecisions also enables another person to evaluate the conclusions reached based on its logicalconsistency. Retracing your thinking is important; for example, describing the reasons youbegan with preestablished categories for initial coding is useful for building an argument toexplain why your conclusion is based on categories that emerged only after older theories ormodels did not fit the data. This is why qualitative researchers rely on memos, or written ideas,as they occur to help sort data into categories, define their properties, and make sense of themby discovering the relationships among categories.Qualitative data analysis eventually reaches a point called saturation, often signalingcompletion of the study when there is a judgment of diminishing returns and little need formore sampling. This is the point where new data and their sorting only confirm the categories(often numbering between three and six or so), themes, and conclusions already reached.Perhaps data analysis yields a conclusion that is best described by reference to a metaphor(e.g., teachers as orchestra leaders, contractors, or mediators). This conclusion will be strengthened by a description of how and why saturation was reached. For example, journal recordings
Ch ap ter 12: Qu al i t ati ve Dat a, A n alys i s , an d Des i g nof the reasoning behind major decisions over time and evidence that supports both the saturation and the concluding argum
A qualitative research design evolves and is likely not clarified until . and methods of data analysis, is guided by the philosophical assumptions of qualitative inquiry: To understand a complex phenomenon,