Transcription
Limnol. Oceanogr., 56(3), 2011, 829–8402011, by the American Society of Limnology and Oceanography, Inc.doi:10.4319/lo.2011.56.3.0829EEffects of changing pCO2 and phosphate availability on domoic acid production andphysiology of the marine harmful bloom diatom Pseudo-nitzschia multiseriesJun Sun,a,b David A. Hutchins,a Yuanyuan Feng,a,b Erica L. Seubert,a David A. Caron,a and Fei-Xue Fua,*a Departmentb Collegeof Biological Sciences, University of Southern California, Los Angeles, Californiaof Marine Science and Engineering, Tianjin University of Science and Technology, Tianjin 300222, ChinaAbstractSome members of the diatom genus Pseudo-nitzschia produce the toxin domoic acid (DA), which throughtrophic transfer causes mass mortalities of wildlife, shellfish harvesting closures, and risks to human health.Nutrient and micronutrient limitation have been shown to regulate DA production. This study tested thehypothesis that changing partial pressure of CO2 (pCO2) can interact with nutrient limitation to help determinecellular DA levels, an environmentally relevant issue in light of current increases in atmospheric pCO2. Cultures ofthe toxic species Pseudo-nitzschia multiseries were incubated using semicontinuous methods under a matrix ofthree pCO2 conditions: , 22 Pa (220 ppm), , 41 Pa (400 ppm), and , 74 Pa (730 ppm), and two phosphateconcentrations: 20 mmol L21, P-replete; and 0.5 mmol L21, P-limited. DA production was regulated by both pCO2and phosphate availability. DA concentrations were 30–50 times higher in P-limited cultures compared to Preplete ones, at the same pCO2 levels. Increasing CO2 levels stimulated DA production under both nutrientconditions, but especially in P-limited cultures, where DA levels increased approximately four times over thepCO2 range examined. Growth rates, primary productivity, photosynthesis vs. irradiance parameters, and cellularelemental ratios also responded interactively to the availability of both CO2 and phosphate. Our results raise thepossibility that growth rates and toxicity of the diatom Pseudo-nitzschia multiseries could increase substantially inthe future high-CO2 ocean, suggesting a potentially escalating negative effect of this harmful algal bloom specieson the future marine environment.Harmful algal blooms have major negative effects onhuman and ecosystem health and on coastal economies.Worldwide, thousands of people are sickened or killed eachyear as the result of ingesting algal toxins, mostly throughconsumption of contaminated seafood (Anderson et al.2002). Some species of the planktonic diatom genus Pseudonitzschia produce the neurotoxin domoic acid (DA), whichcauses amnesiac shellfish poisoning (ASP) in humans. Thistoxin is a glutamate analog that causes serious human andwildlife intoxication events (Colman et al. 2005). DA istransferred through food-web interactions, and can affectthe ecosystem over large spatial and temporal scales. DA hasbeen detected in marine consumers ranging from copepodsto mollusks, fish, and mammals (Doucette et al. 2006; Caronet al. 2010), and ASP toxicity events have greatly increased inboth frequency and intensity over the last decade along theU.S. West Coast (Scholin et al. 2000; Trainer et al. 2000). InCalifornia waters, outbreaks of DA poisoning from toxicPseudo-nitzschia spp. blooms have been responsible forthousands of sea lion and seabird deaths, and recently theseblooms appear to have intensified significantly in areas suchas the San Pedro Channel and Los Angeles harbor(Schnetzer et al. 2007).Although many factors affect the trophic transfer oftoxins, the environmental health risk posed by these bloomsis first of all a function of the levels of DA produced by thecells. High cellular toxin content poses a risk of human andanimal exposure through potentially high accumulations ofDA through the food chain. Consequently, a number ofstudies have attempted to determine the factors that cause orstimulate DA production by toxic Pseudo-nitzschia. Circumstantial evidence points to natural mechanisms ofaggregation (due to currents and tides) and enrichment ofcoastal waters with nutrients as possible contributing factors(Bates et al. 1998). Experiments with various Pseudonitzschia species have indicated that DA production can bestimulated when growth is limited by the major nutrientsphosphate or silicate (Bates et al. 1991; Pan et al. 1998), andby the micronutrient iron (Maldonado et al. 2002; Trick etal. 2010), or by shifts between different nitrogen sources(Howard et al. 2007).Today, we recognize that fossil fuel combustion ismodifying both the seawater chemistry and climate of thecoastal environment where Pseudo-nitzschia blooms occur,through CO2-induced ocean acidification and greenhousewarming. Current levels of atmospheric CO2 are predicted tomore than double by 2100 (Intergovernmental Panel onClimate Change [IPCC] 2007). Enrichment with CO2 ingeneral accelerates the carbon fixation rates of somephytoplankton groups (Riebesell 2004). CO2 acquisitioncan be limiting for some algae at present atmospheric CO2concentrations, depending on the efficiency of their inorganiccarbon concentrating mechanisms (CCMs). Consequently,some algal groups including harmful algal bloom (HAB)species can potentially be carbon dioxide–limited, and maypreferentially benefit from future higher CO2 levels inseawater (Fu et al. 2008b; Hutchins et al. 2009). Thus, itappears that future ‘CO2 fertilization’ of the ocean andassociated potential hydrogen ion concentration (pH) changes could result in more frequent or more intense toxic algalblooms. The concentration of CO2 in seawater and associatedpH changes could, therefore, directly influence Pseudo-* Corresponding author: ffu@usc.edu829
830Sun et al.nitzschia growth and physiology, and so possibly its cellulartoxicity. Two recent culture studies have shown that elevatedseawater pH (lowered pCO2) inhibited growth and alsoinduced DA production by two strains of Pseudo-nitzschiamultiseries (Lundholm et al. 2004; Trimborn et al. 2008).In addition to ocean acidification, modeling work alsopredicts that warming and surface-seawater fresheningfrom melting ice and increased precipitation will intensifyoceanic stratification and, thus, reduce vertical nutrientsupply to the euphotic zone. These changes in nutrientsupplies, in concert with changing pCO2 and temperature,could have a strong effect on the physiology of marinephytoplankton, including coastal HABs (Hutchins et al.2009; Boyd et al. 2010).Expanded research effort is now being directed towardunderstanding global change effects on marine phytoplankton. For instance, interactive effects have been documentedbetween changing pCO2 and various permutations ofnutrients, iron, light, and temperature on the physiologiesof coccolithophorids such as Emiliania huxleyi (Feng et al.2008) and the cyanobacteria Trichodesmium (Hutchins etal. 2007), Crocosphaera, and Synechococcus (Fu et al. 2007,2008a). However, relatively few studies have so faraddressed harmful algal species (Moore et al. 2008). Recentwork has shown that the physiological characteristics ofparticular dinoflagellate and raphidophyte HAB speciesmay cause them to be particularly favored by increasingseawater CO2 and temperature (Fu et al. 2008b). Otherwork has also suggested that bloom-forming dinoflagellatescould benefit from higher pCO2, due in part to theirrelatively inefficient carbon-fixing enzyme, a Type IIRubisco (Rost et al. 2003).Previous studies have suggested that both nutrientavailability and pH can affect toxin production by HABspecies, but questions remain about how toxin productionmay be influenced by the combination of changing pCO2levels with altered nutrient availability. Phycotoxin biosynthesis is directly linked to the autotrophic metabolism ofmost HAB algae, so it is perhaps not entirely surprising tofind that CO2 and nutrient availability can interactivelyaffect cellular toxicity. One recent study showed that thedinoflagellate Karlodinium veneficum responds to thecombination of increased CO2 and reduced P availabilitywith greatly increased cellular toxicity (Fu et al. 2010).Here we present the results of culture experimentsexamining the combined effects of CO2 and phosphateconcentration on the growth, elemental composition,photosynthesis, and toxin production of the marine HABdiatom Pseudo-nitzschia multiseries. The aim of this studywas to gather basic information on DA production andgrowth rates of Pseudo-nitzschia under potential futureconditions of elevated CO2 and P availability, in order tocontribute toward understanding how damaging blooms ofthis toxic diatom species may respond to likely futureconditions in the changing coastal ocean.MethodsCultures and growth conditions—Stock cultures of themarine diatom Pseudo-nitzschia multiseries (Hasle; theProvasoli-Guillard National Center for Culture of MarinePhytoplankton 2708, originally isolated from EasternCanada) were maintained at 17uC in 0.2-mm-filtered,microwave-sterilized natural seawater, enriched with levelsof phosphate, nitrate, silicate, vitamins, and trace nutrientsas in Price et al. (1988). Light was provided on a 12 hdark : 12 h light cycle using cool white fluorescent bulbs at120 mmol photons m22 s21.Experimental design and determination of growth rates—Semicontinuous culturing methods were used in order tomeasure the effects of P availability or pCO2 levels duringacclimated, steady-state growth (Fu et al. 2008a,b; Hutchins et al. 2007). Cultures were diluted daily with mediumthat was previously adjusted to the appropriate temperature and pCO2. Each bottle was diluted back to the samecell density present in that bottle directly after the previousday’s dilution. In this way, each replicate was allowed toindependently reach its own steady-state growth rate undera given experimental treatment. Thus, unlike a chemostatculture in which growth rates are determined by thedilution rate, in this semicontinuous method dilution ratesare instead adjusted to the growth rate. In this way, growthrate is a dependent variable that is a function of theindependent variables chosen for the experiment, in thiscase pCO2 and P availability. Many previous studies of theeffects of pCO2 and other variables on algal growth andphysiology have used this same technique with other algae(Fu et al. 2007; Hutchins et al. 2007; Feng et al. 2008).Cultures were harvested following , 4–6 weeks ofsemicontinuous incubation when they were fully acclimatedto the experimental conditions, after statistically invariantgrowth rates were recorded for 4–6 consecutive dilutions.Samples from each culture bottle were always taken atthe same time in the diel cycle (Fu et al. 2008a), between09:00 h and 10:00 h in the morning, to measure cell densityand, thus, determine changes in growth rate. Dilutions weredone in real time using biomass estimates made by in vivofluorescence, and were subsequently validated using preserved cell-count samples. Chlorophyll a (Chl a) per cell inPseudo-nitzschia multiseries was not affected by theavailability of CO2 (data not shown), suggesting that theuse of in vivo fluorescence was a valid and practical way tomonitor the biomass of Pseudo-nitzschia multiseries.Unchanged cellular Chl a in response to changingavailability of dissolved inorganic carbon (DIC) or pCO2has been reported in both cyanobacteria and eukaryoticalgae (Fu et al. 2008a,b). Growth rates were calculatedbased on the equation: m 5 lnNb 2 lnNa/tb 2 ta, where Naand Nb are the average cell density at times ta (directly aftera dilution) and tb (directly before the next day’s dilution).For cell counts, whole-culture samples were fixed withglutaraldehyde (2.5% v to v final concentration) andcounted in triplicate. About 1000 cells per replicate wereenumerated in a 1-mL Sedgewick–Rafter counting chamber, using an Olympus BX51 epifluorescence microscope at100-fold magnification.Triplicate bottles at two conditions of phosphate availability were equilibrated at three different CO2 concentrations by gentle bubbling with commercially prepared
CO2 and P effects on domoic acid831Table 1. Measured pH, dissolved inorganic carbon (DIC), concentrations (mmol L21), and calculated CO2 concentration (mmol L21),and pCO2 (Pa) on the final sampling day of the incubation. Numbers in parentheses are the standard deviations of triplicate samples.TreatmentMeasured pHMeasured DICconcentration (mmol L21)Calculated [CO2](mmol L21)Calculated pCO2 (Pa)P-limited, 22 PaP-limited, 41 PaP-limited, 74 PaP-replete, 22 PaP-replete, 41 PaP-replete, 74 3.9(0.4)23(2)42(2)75(2)22(2)40(3)73(1)certified standard air and CO2 gas mixtures (Praxair Gas).CO2 concentrations examined included preindustrial atmospheric levels (, 22 Pa), near present-day concentrations (,41 Pa), and values predicted to occur before the end of thiscentury (, 74 Pa; IPCC 2007). In-line high-efficiencyparticulate air filters were used to avoid contaminationfrom particles in the gas tanks or lines. Phosphate levels usedwere 20 mmol L21 (P replete) and 0.5 mmol L21 (P limited).Six different phosphate and CO2 conditions were used in thisstudy: 20 mmol L21 P and , 22 Pa CO2; 20 mmol L21 P and, 41 Pa CO2; 20 mmol L21 P and , 74 Pa CO2; 0.5 mmol L21P and , 22 Pa CO2; 0.5 mmol L21 P and , 41 Pa CO2; and0.5 mmol L21 P and , 74 Pa CO2.Carbonate buffer system measurements and pCO2 treatments—The pH in each bottle was monitored daily using ahigh-sensitivity microprocessor pH-meter (Orion EA 940),calibrated with pH 4, 7, and 10 buffer solutions. Therelative precision of this instrument is , 0.01 and accuracyis , 0.03 pH units. For the analysis of total DIC, DICsamples were stored in 2-mL capped borosilicate vials freeof air bubbles and were preserved with 20-mL saturatedHgCl2 L21, and stored at 4uC until analyzed. Total DICwas measured by acidifying 2-mL 10% of H3PO4 andquantifying the CO2 trapped in an acid sparging column(model CM 5230) with a model CM 140 UIC carboncoulometer (Beman et al. 2010; King et al. 2011). Certifiedreference materials obtained from Andrew Dickson (University of California, San Diego; ,http://andrew.ucsd.edu/co2qc/index.html.) were measured periodically during therun and used for calibration. pH values remained invariantbefore and after the dilution, suggesting that bubbling rateswere sufficient to maintain the target CO2 equilibrationlevels in the medium, regardless of diel changes inphotosynthesis and respiration. Based on the daily measurements of pH and DIC, pCO2 stabilized during the earlypart of the semicontinuous growth period and thenremained steady throughout the latter part of the incubation period. Calculated pCO2 values for the three CO2treatments in both P treatments ranged from 22 Pa to 23 Pa,40 Pa to 42 Pa, and 73 Pa to 75 Pa (Table 1), very close tothe certified standard gas mixture values. For convenience,these values were averaged and rounded to 22 Pa, 41 Pa,and 74 Pa when referring to the three pCO2 treatmentsthroughout the paper.Determination of P–E curves and primary production—Photosynthesis vs. irradiance (P–E) curves were performedby measuring 14C fixation rates at a range of lightintensities using a photosynthetron (Composite HighPressure Technologies), following the method described inFu et al. (2008a,b). Five mL of scintillation cocktail wasadded and the filters were stored in the dark overnight, andthen counted using a Wallac System 1400 liquid scintillation counter.All 14C uptake rates were corrected for dark uptake andcarbon assimilation values were subsequently normalizedto Chl a. The initial slope of the P vs. E curve (i.e., thephotosynthetic efficiency a [mg C (mg Chl a)21 h21 (mmolquanta m22 s21)21]) and the maximum chlorophyll-specificcarbon fixation rate P Bmax [mg C (mg Chl a)21 h21] werecalculated from least-squares nonlinear regression using theexponential function of Platt et al. (1980). Ek (mmol quantam22 s21), the light-saturation point and index of lightadaptation, was calculated as P Bmax : a.Primary production was measured in triplicate using 24-hincubations with H14CO3 under the appropriate experimental growth conditions of light and temperature for eachtreatment (Fu et al. 2008b). A final concentration of0.037 MBq 14C sodium bicarbonate was added to 20-mLculture samples prior to incubation. All carbon fixation ratesfor both primary productivity and P–E curves werecalculated using measured initial experimental DIC andChl a concentrations for each treatment.Analysis of POC, PON, POP, and BSi—Samples for theanalysis of particulate organic carbon (POC) and particulate organic nitrogen (PON) were collected on precombusted GF/F glass-fiber filters (450uC for 5 h) under lowvacuum and dried at 55uC. The samples were then analyzedon an Elemental Analyzer (Costech Instruments, model4010) as described in Fu et al. (2007). Particulate organicphosphorus (POP) was measured followed by the protocolin Fu et al. (2005). Cellular biogenic silica (BSi) wasanalyzed according to the spectrophotometric method ofBrzezinski and Nelson (1995).Analysis of DA concentrations—Particulate and dissolved DA was measured using ASP-enzyme–linkedimmunosorbent assay (ELISA) kits available from Biosense Laboratories. This method has been validated withchemical methods (i.e., liquid chromatography–mass spectrometry), and the results indicate that the ASP ELISA kitcan be applied to the routine determination and monitoringof DA (Kleivdal et al. 2007). Particulate DA samples werecollected on uncombusted Whatman GF/F filters and
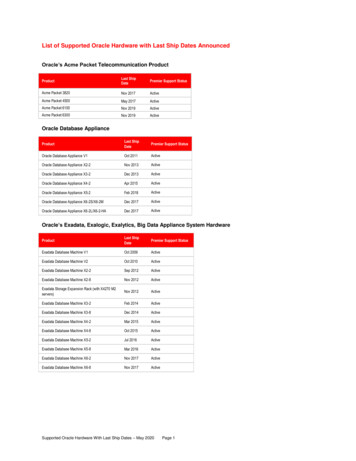
832Sun et al.frozen at 220uC until analyzed. The filtrate from eachsample was also collected, frozen, and later analyzed fordissolved DA. Sample preparation and ELISA tests werecarried out following the protocol of Biosense Laboratories(2005 version). The limit of detection for the ELISAmethod for particulate DA is 6.8 ng L21. Total DAproduced per cell (including the sum of both particulateand dissolved DA) was calculated by dividing the DAcontent of the whole-culture sample by the cell density.Statistical analysis—Growth rates, photosynthetic parameters, and cell quotas and elemental ratios in differentexperiments were assessed using a two-way ANOVA.Differences between treatment groups were tested by Tukeyhonest significant difference multiple comparisons. Differences are termed significant when p , 0.05. All dataanalyses were conducted using the Software packageStatistica.ResultsDA production—DA production occurred to varyingdegrees in all treatments (Fig. 1). The toxin cell quotas weremuch higher in P-limited cultures relative to P-replete ones,consistent with previous work (Pan et al. 1998; Fehling etal. 2004). P-limited cultures at corresponding pCO2 levelshad cell-normalized DA contents that were 30–50-foldhigher (Fig 1A; P-limited vs. P replete: 22 Pa: F1,12 5 53.4,p , 0.001; 41 Pa, F1,12 5 90.6, p , 0.001; 74 Pa, F1,12 51436, p , 0.001) than those of the P-replete cultures. Thedissolved DA normalized to cell abundances (Fig. 1B; Plimited vs. P replete, 22 Pa, F1,12 5 426.2, p , 0.001; 41 Pa,F1,12 5 146.8, p , 0.001; 74 Pa, F1,12 5 281.6, p , 0.001)and total cell-normalized DA contents (dissolved particulate, Fig. 1C; 22 Pa: F1,12 5 66.4, p , 0.001; 41 Pa:F1,12 5 100.8, p , 0.001; 74 Pa: F1,12 5 120.8, p , 0.001)showed similar trends to the cell-normalized particulateDA contents.Cellular DA toxin content (Fig. 1A) also increased withincreasing pCO2 regardless of P availability. This trend wasespecially evident at 74 Pa CO2, where values weresignificantly higher than those at 22 Pa and 41 Pa (Plimited: 22 Pa vs. 74 Pa: F1,12 5 957, p , 0.0001; 41 Pa vs.74 Pa: F1,12 5 819, p , 0.001; P-replete: 22 Pa vs. 74 Pa:F1,12 5 27.6, p , 0.001; 41 Pa vs. 74 Pa: F1,12 5 13.4, p 50.003). This effect was, however, much more pronouncedunder P-limited conditions, where cellular DA content in Plimited cultures (Fig. 1B) increased by , four-fold (74 Pa)relative to the cultures grown at 22 Pa CO2 levels. AlthoughDA production was greatly reduced in P-replete cultures,toxin levels were still a function of pCO2. Cellular DAcontent at 22 Pa CO2 was only 64% and 45% as high ascellular content in the P-replete 41-Pa and 74-Pa treatments, respectively.Dissolved DA levels in the cultures were nearly an orderof magnitude lower than particulate DA concentrations,but showed similar trends across the pCO2 treatments(Fig. 1B). Regardless of P conditions, dissolved DAconcentrations normalized to cell number were significantlyhigher in the 74-Pa pCO2 treatment than the two lowerFig. 1. Domoic acid production (DA) by Pseudo-nitzschiamultiseries CCMP 2708 (Hasle) in the six P and CO2 treatments.(A) Particulate DA, pg cell21; (B) dissolved DA, pg cell21; and (C)total DA (particulate dissolved), pg cell21. Open bars are the Plimited cultures, and cross-hatched bars are the P-repletetreatments; increasing grey shades represent increasing pCO2levels in the three treatments. Values are the means and error barsare the standard deviations of triplicate samples.pCO2 treatments (P-limited: 22 Pa vs. 41 Pa: F1,12 5 6.1, p5 0.03; 22 Pa vs.74 Pa: F1,12 5 13.7, p 5 0.003; 41 Pa vs.74 Pa: F1,12 5 5.3, p 5 0.04; P-replete: 22 Pa vs. 74 Pa: F1,125 369.5, p , 0.001; 41 Pa vs. 74 Pa: F1,12 5 82.1, p ,0.001). For the 22-Pa pCO2 P-replete cultures, the dissolvedDA level was less than the limit of detection of the ELISAassay (, 0.2 pg L21). A similar trend was observed with thetotal DA content normalized to cell abundance, in thathigher values were always found under higher pCO2 levels.For P-limited cultures, the values were significantly higherunder 74 Pa CO2 compared to those at 22 Pa CO2, andsignificantly higher values were found under 74 Pa and41 Pa CO2 compared to 22 Pa (Fig. 1C; P-limited: 22 Pa vs.41 Pa: F1,12 5 6.1, p 5 0.03; 41 Pa vs. 74 Pa: F1,12 5 3.8, p
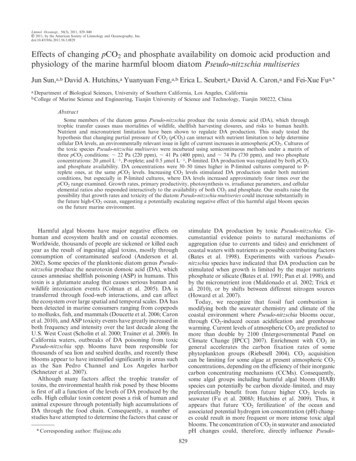
CO2 and P effects on domoic acid833P-replete medium increased significantly with increasingpCO2 across all three pCO2 treatments (22 Pa vs. 41 Pa:F1,12 5 57.3, p , 0.001; 41 Pa vs. 74 Pa: F1,12 5 33.1, p ,0.001; 22 Pa vs. 74 Pa: F1,12 5 177.6, p , 0.001).The influence of pCO2 on daily primary production byP. multiseries cultures was in general similar to thatobserved for growth rates (Fig. 2B). Increases in CO2 andphosphate together stimulated the 24-h primary productivity of P. multiseries under the experimental conditions(Fig. 2B). For the P-replete cultures grown under elevatedCO2, primary production increased substantially. Carbonfixation rates in the 41-Pa and 74-Pa pCO2 treatments were1.3–1.7-fold higher than in the P-replete 22-Pa treatment(22 Pa vs. 41 Pa: F1,12 5 15.4, p 5 0.002; 22 Pa vs. 74 Pa:F1,12 5 34.5, p , 0.001). However, in the P-limited culturespCO2 only affected primary production significantly at74 Pa (22 Pa vs. 74 Pa: F1,12 5 82.2, p , 0.001; 41 Pa vs.74 Pa: F1,12 5 256.5, p , 0.001), and no significantdifference was observed between the two lower pCO2treatments (F1,12 5 3.4, p 5 0.09).Fig 2. (A) Specific growth rates and (B) carbon fixation ratesof Pseudo-nitzschia multiseries CCMP 2708 (Hasle) in the six Pand pCO2 treatments (symbols and error bars as in Fig. 1).5 0.08; 22 Pa vs. 74 Pa: F1,12 5 14.4, p 5 0.003; P-replete:22 Pa vs. 41 Pa: F1,12 5 61.6, p , 0.001; 41 Pa vs. 74 Pa:F1,12 5 6.2, p 5 0.03; 22 Pa vs. 74 Pa: F1,12 5 17.9, p 50.001).In addition, there was a significant two-way interactiveeffect between pCO2 and phosphate availability on toxinproduction. For all forms (particulate, dissolved, and total)of cellular DA, by far the greatest enhancement of total DAlevels always occurred in the treatments combining higherpCO2 and decreased P availability (two-way ANOVA,interactions: cellular DA: F2,12 5 9.3, p 5 0.004; cellnormalized dissolved DA: F2,12 5 22.0, p , 0.001; cellnormalized total DA: F2,12 5 8.4, p 5 0.005).Growth rate and primary production—Growth rates ofPseudo-nitzschia multiseries scaled with pCO2 in bothP-replete and P-limited cultures (Fig. 2A). As expected,the growth rates of Pseudo-nitzschia multiseries were higherin P-replete cultures than under P-limitation, increasing by34% (22 Pa), 58% (41 Pa), and 65% (74 Pa) underequivalent CO2 conditions (Fig. 2A, 22 Pa: F1,12 5 16.9,p 5 0.001; 41 Pa: F1,12 5 43.5, p , 0.001; 74 Pa, F1,12 573.6, p , 0.001). For P-limited cultures, growth rates in the74-Pa pCO2 treatment were significantly higher than in thetwo lower pCO2 treatments (F1,12 5 28.4, p , 0.001; F1,12 510.3, p 5 0.007), but the latter two treatments were notsignificantly different from each other (F1,12 5 4.3, p 50.06). The effect of changing pCO2 on growth rates ofP-replete cultures was more dramatic. Growth rates in thePhotosynthesis vs. irradiance—Photosynthetic carbonfixation rates vs. irradiance (P–E curves) in both Ptreatments reached a plateau with no sign of photoinhibition at any light or CO2 levels (Fig. 3). Maximum lightsaturated carbon fixation rates (P Bmax ) were invariablylower in P-limited cultures than in P-replete ones at thesame levels of pCO2, with P Bmax values in P-replete culturesbeing 2.2-, 2.0-, and 1.8-fold higher at 22 Pa, 41 Pa, and74 Pa pCO2, respectively (Table 2).CO2 enrichment effects on P Bmax were dependent on Pavailability. P Bmax in P-replete cultures at 74-Pa pCO2cultures increased by 21% compared to 22-Pa CO2 levels(F1,12 5 5.5, p 5 0.037; Fig. 3; Table 2). The values of P Bmaxin the 74-Pa pCO2 treatment were not significantly differentfrom those in the 41-Pa pCO2 treatment (F1,12 5 4.3, p 50.06). The P Bmax values in P-limited cultures at 22-Pa pCO2were significantly lower than in the other two elevatedpCO2 levels (F1,12 5 11.1, p 5 0.006; F1,12 5 97.4, p ,0.001; compared with 41 Pa and 74 Pa CO2 respectively).The values of P Bmax in the 74-Pa cultures were alsosignificantly higher than the ones in the 41-Pa treatment(F1,12 5 117.4, p , 0.001).The slope of the light-limited portion of the photosynthetic curve (a) in P-replete cultures was significantlygreater than in P-limited ones under 41-Pa and 74-PapCO2 conditions (Table 2; 41 Pa: F1,12 5 9.3, p 5 0.01;74 Pa: F1,12 5 11.1, p 5 0.006). Under both P-limited andP-replete conditions, a values in the three pCO2 treatmentswere statistically invariant except for significantly increaseda values at 41 Pa relative to those at 22-Pa CO2 forP-limited cultures (F1,12 5 7.2, p 5 0.02).Ek, the ratio of P Bmax : a, represents the light saturationpoint at which light absorption is in balance with thecapacity of the photosynthetic system to process thisincoming energy. Regardless of P conditions, there wasno significant difference among the three pCO2 enrichments(P-limited: 22 Pa vs. 41 Pa: F1,12 5 3.7, p 5 0.08; 41 Pa vs.74 Pa: F1,12 5 4.3, p 5 0.06; 22 Pa vs. 74 Pa, F1,12 5 2.6, p5 0.14; P-replete: 22 Pa vs. 41 Pa: F1,12 5 0.64, p 5 0.44;
834Sun et al.Fig. 3. P–E curves (photosynthesis vs. irradiance curves) ofPseudo-nitzschia multiseries CCMP 2708 (Hasle) in the six P andCO2 treatments. (A) P-limited treatments and (B) P-repletetreatments. Symbols for the three pCO2 treatments are: circles,22 Pa pCO2; triangles, 41 Pa pCO2; squares, 74 Pa pCO2. Valuesare the means and error bars are the standard deviations oftriplicate samples.41 Pa vs. 74 Pa: F1,12 5 0.7, p 5 0.43; 22 Pa vs. 74 Pa: F1,125 0.8, p 5 0.4). Also, significant differences between thetwo P conditions were only found at 41 Pa CO2 (F1,12 59.0, p 5 0.01). The ratios of Ek to the culture irradiance(120 mmol photons m22s21) in P-limited cultures rangedfrom 0.9 to 1.4 regardless of different pCO2 levels or Pconditions, while the Ek values under P-replete conditionswere , 1.2 (data not shown).Elemental composition—The cellular quotas of silicon(QSi, pmol Si cell21) for the experimental P. multiseriescultures were affected by P or pCO2 conditions, or by bothTable 2. Photosynthetic parameters from P–E curve fitting,including P Bmax (mg C mg Chl a21 h21), alpha (mg C h21 [mg Chla]21 [mmol m22 s21]21), and Ek (mmol m22s21). Values are themeans of triplicate measurements (6SD).TreatmentP BmaxaEkP-limited, 22 PaP-limited, 41 PaP-limited, 74 PaP-replete, 22 PaP-replete, 41 PaP-replete, 74 Fig. 4A). Growth at the lowest experimental pCO2 resultedin a significant increase in QSi of the cells. QSi values at 22 PapCO2 were 66% and 52% higher in P-limited culturescompared to cells in the 41-Pa and 74-Pa CO2 treatments,respectively (22 Pa vs. 41 Pa: F1,12 5 15.4, p 5 0.002; 22 Pavs. 74 Pa: F1,12 5 8.7, p 5 0.01) and 25% and 46% higher inP-replete cultures (22 Pa vs. 41 Pa: F1,12 5 7.2, p 5 0.02; 22 Pavs. 74 Pa: F1,12 5 11.8, p 5 0.005) (Fig. 4A). However, QSiwas not significantly different between the two elevatedpCO2 treatments regardless of P conditions (P-limited: F1,125 0.6, p 5 0.45; P-replete: F1,12 5 3.4, p 5 0.09). Cellular Siquotas in P-limited cultures were always much higher than inP-replete cultures, within the same pCO2 levels (22 Pa: F1,125 105.3, p , 0.001; 41 Pa: F1,12 5 10.6, p 5 0.008; 74 Pa:F1,12 5 9.3, p 5 0.01).The cellular Si : C ratios showed similar trends to the QSivalues (Fig. 4B). At 22 Pa pCO2 under P-limited conditions,Si : C ratios were significantly higher compared to the othertwo elevated pCO2 levels (Fig. 4B; 22 Pa vs. 41 Pa: F1,12 55.5, p 5 0.04; 22 Pa vs. 74 Pa: F1,12 5 9.3, p 5 0.01). However,there was no significant difference in the ratios of Si : Cbetween these two higher CO2 levels (F1,12 5 0.8, p 5 0.4).Under P-replete conditions, cultures grown under the twolower pCO2 levels showed significantly higher ratios of Si : C(by 69% and 38% for the 22-Pa and 41-Pa levels, respectively)than cells grown at 74 Pa pCO2 (F1,12 5 7.84, p 5
b are the average cell density at times t a (directly after a dilution) and t b (directly before the next day's dilution). For cell counts, whole-culture samples were fixed with glutaraldehyde (2.5% v to v final concentration) and counted in triplicate. About 1000 cells per replicate were enumerated in a 1-mL Sedgewick-Rafter counting cham-