Transcription
Draft not to be quotedRegional Trade and Economic Development: Options for Pakistan1Muhammad Aamir Khan2ABSTRACTPakistan shares its northern border with China, while it shares part of its northern, eastern and southernborder with India: the second and seventh largest economies in the world respectively.3 Pakistan shouldtherefore be ideally positioned to gain from liberalization of trade. The Pakistan-China Free TradeAgreement (FTA) signed in 2006 came with expectations of exclusive concessions and advantages towardsPakistan, but the benefits from Pakistan-China FTA are considerably less than first anticipated. Pakistan’sdomestic producers suffered a huge blow as they could not compete with cheaper imports, particularly fromthe ASEAN economies who subsequently received more concessions from China as part of the ASEANChina FTA. This research also quantifies the Potential Pakistan-India Trade Normalization. Proponents ofPakistan granting India NDMA status maintain that both countries stand to gain increased access to oneanother’s vibrant markets after years of restrictive policies and disproportionately low trade relative totheir trade with other countries.Given this new backdrop we analyze the impact of the Pakistan-China FTA and the possibility of tradenormalization with India and consider what changes could be made to these agreements to improve theoutcome for Pakistan. A global economic trade model is adapted to include more detailed information onPakistan, India and China’s labor and household groups into the latest GTAP database using MyGTAPapproach (Walmsley and Minor, 2013). This is the first model of its kind to incorporate 3 comprehensiveSAM’s in GTAP framework. This allows for a more detailed analysis of the impact of the different regionalintegration scenarios at the household level. The current Pakistan-China FTA shows a negative impact onPakistan economy, however when the preferences are increased in line with the ASEAN-China FTA theoverall impact on Pakistan is positive, at both the macro and micro level. Normalizing trading relationswith India, through granting India NDMA status with better trade facilitation and full implementation ofSouth-Asian Free Trade Agreement (SAFTA), shows modest positive gains on the Pakistan economy,while also raising real GDP in India, thereby offering a win-win solution for both parties. The report1This Research was funded by World Bank.2Assistant Professor, Department of Economics, COMSATS University, Islamabad.3According to IMF data 2415/worlds-top-10-economies.asp), Jan10, 2019.1
Draft not to be quotedconcludes that the gains to Pakistan from normalizing relations with India with better trade facilitation aremuch larger than those from the FTA with China.1IntroductionRegional connectivity is an important element of the recently unveiled Vision 2025 of the Government ofPakistan. Pakistan considers regional trade an important component for economic growth. However, despitethe revival of interest in the regional trade or regionalism, intra-regional trade accounts for only 5 percentof the total trade of Pakistan (Ahmad, 2014). In 1988, the government of Pakistan implemented the maidenInternational Monetary Fund’s (IMF) Structural Adjustment Program (SAP) which led to a reduction intariffs. In 1995, trade liberalization received a further boost with Pakistan’s accession to the WTO and itsassociated agreements, resulting in further steps to reduce import duties and eliminate various subsidies.When the WTO negotiations failed to resolve, each issue regarding international trade, free tradeagreements surged in popularity around the world. As a developing country, Pakistan also started signingbilateral and regional trade agreements, as a potential means of continuing to liberalize trade. The objectivesof Pakistan in negotiating these preferential/free trade agreements has been to: a) strengthen its owneconomic development by further increasing and promoting trade and investment; b) bring about economicco-operation with trading parties; and c) maintain a high comparative export value or market share.Pakistan actively participates in many regional trading agreements such as South Asian Free TradeAgreement (SAFTA). Pakistan has also signed Free Trade Agreements (FTA) with China, Malaysia, SriLanka and other regional economies but none of these have been able to significantly improve the outcomefor Pakistan. Pakistan still follows somewhat restrictive trade policies compared to its regional counterparteconomies like India, Sri Lanka and Bangladesh. Talk of India receiving Most Favored Nation (MFN)4status or Non-Discriminatory Market Access (NDMA)5 from Pakistan has dominated the discourse onPakistan-India trade for several years. While India granted Pakistan MFN status in 1996, and both countrieshave been subject to the SAFTA since 2006, Pakistan is yet to grant India MFN/NDMA status after a seriesof false starts and delays. Many believe that this decisive move towards a normalized trading regime willhelp realize the massive potential for trade between the two countries that so far lies largely dormant.In the present era of globalization and the successive participation of economies in international trade andworld trade relations, most of the developing countries are still trying to identify the determinants ofeconomic growth. The evidence that trade liberalization can be a catalyst to higher economic growth iscompelling (Winters, McCulloch et al. 2004), and has caused large numbers of developing countries to4 “Most Favoured Nation” (MFN) status is a level of treatment accorded by one state to another in international trade.5 Non-Discriminatory Market Access (NDMA) is another name for Most Favoured Nation status used in recent years by both sides.2
Draft not to be quotedadopt liberalization policies in the hope of increasing economic growth. However, developing countries arenot well prepared to face the competition brought about by the liberalization of trade and hence specialconditions should be implemented for such countries; thereby allowing the trading rules to differ dependingon the stage of development (Freres & Mold, 2004).Multilateral Trade Liberalization and the welfare of households living in developing countries like Pakistanare the two prominent issues in global trade negotiations. A common question that arises is whether theliberalization of world trade benefits people who live in poverty? This question has motivated many policydebates, especially since the launch of the Doha Development Agenda (DDA) in 2001 (Corong, 2014).Trade liberalization is generally believed to increase the employment elasticity of economic growth relativeto import substitution or a closed economy, thereby reducing poverty. However, the impact of tradeliberalization on poverty and income inequality is less clear (Winters, McCulloch et al. 2004). Nevertheless,steadfast critics of Trade liberalization are of the view that benefits of trade induced economic growth havelittle chance of being evenly distributed, and thus, the distribution impacts of trade liberalization areexpected to adversely affect the poor.With this backdrop in mind, this study investigates the impact of several alternative trading agreementsavailable to Pakistan to improve its trading relations with China and India, the two economic giants in Asia.The analysis includes an examination of the impact of these agreements on the Pakistan, Chinese and Indianeconomies, including trade and production, as well as on poverty and households within Pakistan and India.Several agreements are considered including the current Pakistan-China FTA and a possible extension, thenormalization of trade between Pakistan and India via an MFN/NDMA scenario, and the fullimplementation of SAFTA.The rest of the study is organized as follows. First, we present an overview of Pakistan economy and thevarious Pakistan trade agreements. This is followed by a section on the Pakistan-China Free TradeAgreement (FTA) and an overview of Pakistan-India trade, followed by an examination of some of theissues hampering normalization of trade between Pakistan and India. Section 3 presents the methodologicalframework, data sets and measures of inequality used in this study. Results are then discussed in Section 4,sensitivity analysis are presented in Section 5, followed by concluding remarks in Section 6.2. Overview of Pakistan EconomyPakistan has a growing semi-industrialized economy that relies on manufacturing, agriculture andremittances. Pakistan’s economy remains vulnerable to high inflation, energy shortages and decliningforeign exchange reserves; as well as to political instability and a variable security environment.3
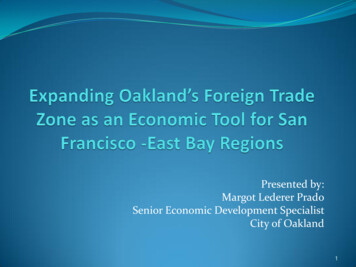
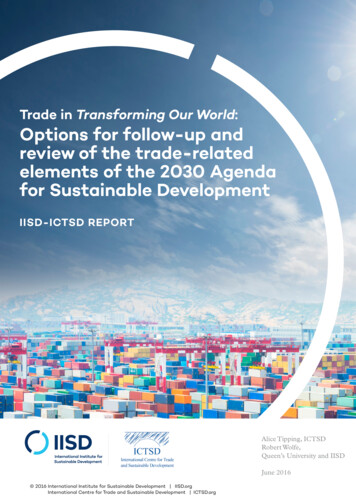
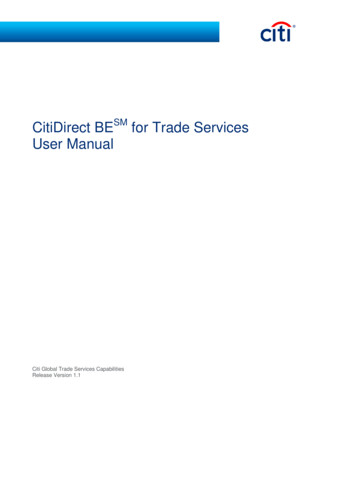
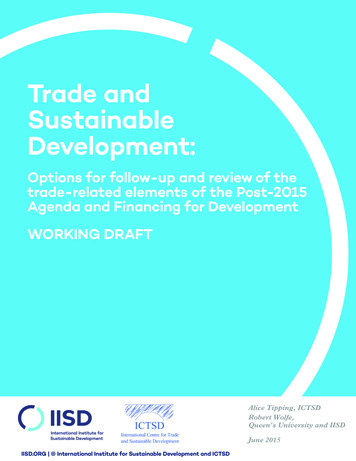
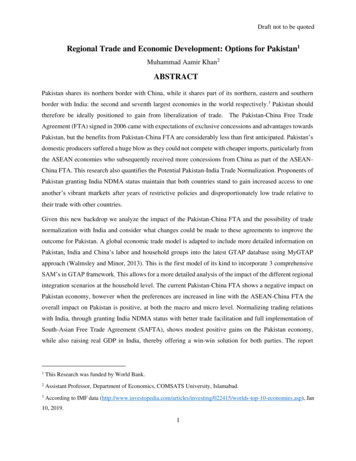
Draft not to be quotedAmidst the chaos, the real GDP growth has seen a slight increase in fiscal year 2016-17 to 4.7 as comparedto 4 percent last year (IMF,2018). Despite this modest increase Pakistan’s growth rate is still the lowest inSouth Asia as demonstrated in figure 1 Figure 2 shows Pakistan’s Real GDP growth over the last decade.Pakistan’s Real GDP growth clearly deteriorated after the signing of FTA with China in 2006, although thedecline in growth is also likely to have also been affected by a severe energy crisis and worsening securitythat occurred in Pakistan during this time. The negative impact of the global financial crisis on Pakistan canalso be seen in 2009. Overall average real GDP growth in Pakistan for the post-FTA period (2007 to 2014)was 3.3 percent per year, compared to an average annual growth rate of 5.07 percent, in the preceding periodleading up to the FTA (1999 to 2006).Figure 1: GDP Growth rate for South Asia and ChinaGDP Growth Rate for South Asia andChina(2016-17)7.26.37.47.1Percent kaChina6.37.25.84.77.47.1Source: International Monetary Fund, World Economic OutlookSouth Asia’s current economic performance across all macroeconomics indicator has been impressive. Theaverage aggregated growth in South Asia rose to 6.8 % in 2016 (IMF, 2017). China’s growth has also beenimpressive with growth rates in excess of 10 percent over the last decade, although it has declined in recentyears and is expected to continue to be lower. With such high growth rates across the region, Pakistan islikely to gain significantly from increased trading relations with its neighbors.4
Draft not to be quotedFigure 2: Pakistan Real GDP Growth RateSAFTAOperational9Pakistan-China FTAOperational7.55.85.554.73.63.83.74.142.60.42004 2005 2006 2007 2008 2009 2010 2011 2012 2013 2014 2015 2016Source: International Monetary FundSince independence, Pakistan has never observed surplus in its trade balance except during 1950’s. Sincethen, Pakistan has persistently faced deficit in its trade accounts. Table 1 explains the behavior of Pakistan’sbalance of trade which indicates that except 1950, Pakistan has been facing deficit in its trade accounts.This is due to increasing number of imports and declining export sectors. The trade deficit reached its alltime maximum of US 26680 million in 2017-18.Table 1: Historical overview of Pakistan Balance of Trade (US Million 7241,2804125548683Source: Pakistan Economic Survey ,20185Balance of 7-8259-10,427-17,191-19283-26680
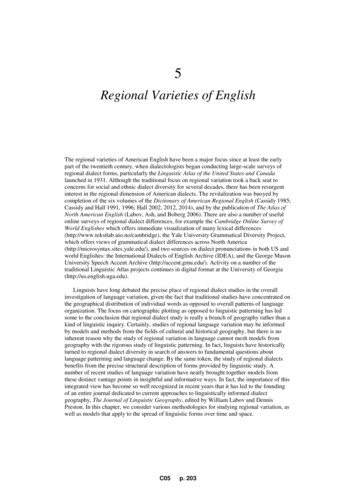
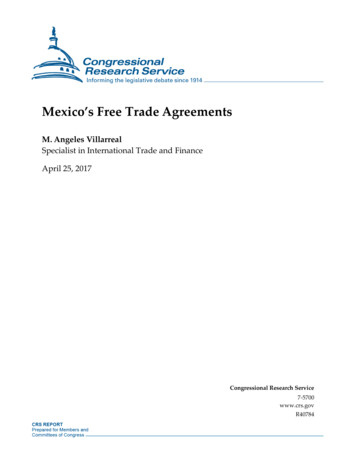
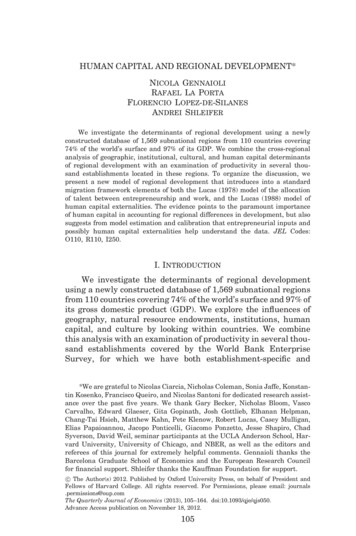
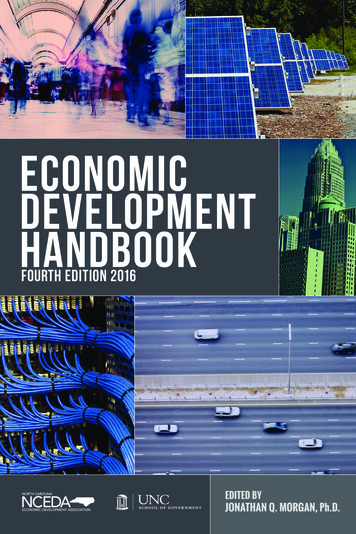
Draft not to be quoted2.1 Pakistan Trade AgreementsPakistan actively participated in many regional trading agreements. Pakistan has FTA’s with China, SriLanka and Malaysia. In this section we discuss the Pakistan-Sri Lanka and Pakistan-Malaysia FTAs. ThePakistan-China FTA and is discussed in section 2.1.1.Pakistan-Sri Lanka FTA has been operational since 2005. At the beginning, the FTA coverage wassufficiently broad that covered some major export items. However, trade volumes between the two partnershas not been meaningful. This is evident from the negligible share in each other import market. Pakistanexports to Sri Lanka in 2015 is US 296 million and imports from Sri Lanka is US 73.60 million (figure3) percent (2014). The reason behind low utilization of this FTA is lack of interest in trade with each otherand lack of coordination between government of Pakistan and business community.Figure 3: Bilateral Trade b/w Pakistan and Sri LankaBilateral Trade B/w Srilanka and Pakistan400,000FTA Operational 296.94 Million300,000200,000 73.60 Million100,00002003 2004 2005 2006 2007 2008 2009 2010 2011 2012 2013 2014 2015Srilanka Export to PakistanPakistan Exports to SrilankaSource: Trademap, United Nation Commodity Trade Statistics DatabasePakistan and Malaysia are important economic forces of their respective regions. Both economies agreedupon to closer economic integration and signed a Free Trade Agreement in 2006, which became operationalin 2008. The FTA covers trade in goods and service, investment and other issues, such as economiccooperation and intellectually property rights. Under the FTA negotiation, Malaysia provided market accessto Pakistani goods by offering the Tariff Rate Quota (TRQ), while Pakistan provided market access toMalaysia by offering the ‘margin of preference (MOP)’ status for 138 tariff lines. Pakistan’s trade deficitwith Malaysia has further widened indicating a low scope of gains to Pakistan from FTA with Malaysia.6
Draft not to be quotedFigure 4:Bilateral Trade b/w Pakistan and Malaysia3,000,0002,500,000Bilateral Trade B/w Pakistan and MalaysiaFTA Operational 1.21 Billion2,000,0001,500,0001,000,000 233 million500,00002003 2004 2005 2006 2007 2008 2009 2010 2011 2012 2013 2014Pakistan Exports to MalaysiaMalaysia Exports to PakistanSource: Trademap, United Nation Commodity Trade Statistics DatabasePakistan Trade agreements are illustrated in Figure 5. As discussed earlier, Pakistan has signed Free TradeAgreements with China, Sri Lanka and Malaysia. Pakistan’s preferential trade Agreements is with Iran,Indonesia, Mauritius and PTA-D8 (Developing 86). Pakistan has also one preferential arrangement, theEuropean GSP Plus, which was granted by European Union in December,2013. The preferentialarrangement is unlike preferential agreement as it is not on reciprocal basis. This status is usually grantedby the developed nation to developing country to improve their balance of trade deficit.6The 8 African and Asian developing countries include Pakistan, Egypt, Nigeria, Bangladesh, Turkey, Malaysia, Iran,Indonesia.7
Draft not to be quotedFigure 5: Pakistan Trade AgreementsPAKISTANPrefernetial TradeAgreement(PTA)Multilateral FreeTrade AgreementPreferentialArrangementChina (2007)Iran (2004)EU GSP Plus (2014)Malaysia (2007)Indonesia(2005)South Asia FreeTrade Agreement(2006)Free TradeAgreement (FTA)SriLanka (2004)Mauritius (2007)PTA-D8Turkey*Thailand*Korea*Source: Author’s own design* shows Pakistan Potential Free Trade Agreements (Source: Ministry of Commerce, 2018)2.1.1Overview of Pakistan-China Free Trade Agreement (FTA)The early Harvest Program (EHP) between Pakistan and China was initiated and operationalized in January2006. The Pak-China FTA became operational in November 2006. As part of the agreement Pakistan gavemarket access to China in 11 sectors and 107 subsectors and China offered access to 11 sectors and 133subsectors. Pakistan received tariff concessions of zero duty for fabric, cotton and bedding; other homelinen, marble and certain other types of tiles, leather goods, sports equipment & merchandise, iron & steelproducts and engineering goods, as well as industrial alcohol imported by China. China, on the other hand,will enjoy market access on industrial machinery, chemicals both organic & inorganic, and light and heavymanufacturing sector (Pakistan Business Council, 2013 (henceforth PBC, 2013)). The free trade agreementbetween Pakistan with China is therefore of great significance to Pakistan as it provides access to the large8
Draft not to be quotedChinese market, while also reducing the price of intermediate inputs, such as organic chemicals andmachinery to Pakistani producers.Pakistan Business Council (2017) have argued that Pakistan is losing competitiveness in its own marketdue to cheap Chinese imports having low production cost and tariff concessions, which in turn has hinderedpotential investment in local industries. The recent signing of an agreement between China and the ASEANcountries has also dampened Pakistan’s enthusiasm for the Pakistan-China FTA. The PBC (2017) have alsoargued that in nearly all cases China has awarded higher or equal reductions in tariffs to ASEAN countriesas part of an ASEAN-China FTA. Under the ASEAN-China FTA tariffs were abolished on over 90% oftraded products, many of which directly compete with Pakistani products. While many of the top exportsto China are included in China’s no concession/protected list in both the Pakistan-China FTA and ASEANChina FTA, there are a number of additional tariffs reductions and discounts offered to the ASEANcountries that were not given to Pakistan. Given the similarities in export structures between Pakistan andthe ASEAN countries this means that many of the gains from the Pakistan-China agreement are likely tobe eroded by this new agreement between ASEAN and China due to more aggressive competition in theChinese market.China has always been an important trading partner for Pakistan, contributing considerably to its importseven before the free trade agreement between the two countries was signed. Figure 6 depicts the rise intrade between China and Pakistan over time. The rapid increase in Pakistan imports from China appears tohave commenced in 2001/2, with the share of Pakistan’s imports from China growing from 5 percent to 10percent in 2006, well before the FTA was signed. Pakistan’s exports to China only started growing afterthe implementation of the FTA, with China’s share in Pakistan’s exports fluctuating around 2.5 percentbetween 2001 and 2006. As a result, imports from China have generally exceeded exports to China (Figure3) and today Pakistan has a large trade deficit with China. The trade deficit also reflects the fact that Chinahas increased investment in Pakistan because of the FTA, in order to take advantage of Pakistan’s cheapand hardworking labor force.9
Draft not to be quotedFigure 6: Pakistan China Bilateral TradeBilateral Trade B/w China and Pakistan 16.48 Billion20000000FTA Operational1500000010000000 2.47 Billion500000002003 2004 2005 2006 2007 2008 2009 2010 2011 2012 2013 2014 2015China Export to PakistanPakistan Exports to ChinaSource: Trademap, United Nation Commodity Trade Statistics DatabaseAfter the Pakistan-China FTA entered into force in 2007, there was a substantial increase in the share ofPakistan’s imports coming from China. By the end of 2012, the year in which the first phase of the FTAwas completed, Chinese imports to Pakistan had expanded to 15% percent of the Pakistan’s global imports,up from 10 percent in 2006. In 2015, this share had risen to an astonishing 45.1 percent (Trademap.org).Although it is difficult to ascertain how much of this increase was due to the implementation of the FTAand how much to the general increase in imports from China that had been occurring since 2001, theincrease is nevertheless substantial. The impact of the FTA on Pakistan’s exports to China, on the otherhand, have been less dramatic, with the share rising from 2.5 percent in 2006 to just over 10 percent in2012. Table 2 provides a list of the top products imported by Pakistan and the share of those imports comingfrom China in 2006 and 2012, the year the first phase of the FTA was completed. Pakistan primarily importschemicals, rubbers and plastics; iron and steel; machinery and equipment for local manufacturing, fromChina and the rest of the world. With the exception of textiles, Pakistan does not produce many of thesegoods itself, relying solely on imports. Table 2 shows a substantial increase in imports of electric andelectronic tools; machines; chemicals; fertilizers and textiles from China as a result of the FTA.Table 2: Pakistan’s top imports from China compared to Pakistan’s imports from world (in milliondollars)2006GTAPcodeProductImports fromworld( USMillions)10Share ofimportsfrom China(%)2012Importsfrom world( USMillions)Share ofimportsfromChina (%)
Draft not to be quotedELEElectrical, electronic equipment3,081182,75263OMEMachinery, nuclear reactors,boilers, etc3,344213,06028CRPOrganic chemicals1,178112,03818TEXManmade filaments3134453070I SIron and cs and articles thereof1,12981,50114I SArticles of iron or steel4281840944OTNVehicles other than railway,tramway1,73351,59611TEXMan-made staple fibres285753933CRPRubber and articles thereofMiscellaneous chemicalproducts31226464343741954921CRPOTNRailway, tramway locomotives,rolling stock, equipment378011095CRPInorganic chemicals, preciousmetal compound, isotopes2382549822Source: Pakistan Business Council (2013); United Nations Trade Center DatabaseThere is considerable potential for Pakistan to export more of these commodities to China if tariffs wereremoved. Table 3 reports Pakistan’s current exports to China and Chinese tariff for both Pakistan andASEAN (base year 2007, when FTA got operational) on those commodities which Pakistan considers havegreater potential for enhancing trade between Pakistan and China. Table 4 shows the same for base year2011 on those aggregated sectors / commodities after first phase was about to complete.Table 2:Chinese Tariff for Pakistan and ASEAN in 2007 When FTA got OperationalSector DetailGrain CropsVeg n FruitMeat LvstkExtractionProcessed FoodLeatherWapTextileLight ManufacturingPak X to World(US Million 2731.38Pak X to China(US Million 011Chinese M from W(US Million 820.49616697.5769936.55Tariff for iff forASEAN2.940.396.000.938.968.0211.726.703.75
Draft not to be quotedHeavy Manufacturing2046.58143.433571907.43.292.98Source: GTAP Data base 8a (Base year 2007)Table 3: Chinese Tariff for Pakistan and ASEAN (2011)Sector DetailPak X to WorldPak X to ChinaChinese M from W(US Million )(US Million )(US Million )Grain CropsVeg n FruitMeat LvstkExtractionProcessed FoodLeatherWapTextileLight ManufacturingHeavy 851380.5Tariff for PakistanTariff for e: GTAP Data base 9a (Base year 2011)This study first investigates the impact of the tariff reductions agreed to in the Pakistan-China FTA.Considering the recent ASEAN-China FTA, the study also examines the potential impact on the Pakistaneconomy of the ASEAN-China FTA and of an extended Pakistan-China FTA in which Pakistan can receivethe same tariff concession awarded to ASEAN countries under ASEAN-China FTA. In addition to thegeneral economic gains from the FTA, we also explore how this agreement impacts income inequality inPakistan.2.1.2Overview of Pakistan-India TradeSouth Asia is the least integrated regions in the world. This is primarily due to the fact that the two SouthAsian giants Pakistan and India hardly trade with each other. They together constitute almost 85 percent ofSouth Asia’s GDP, 80 percent of South Asia’s total population, and about 75 percent of South Asia’s area.And yet, the percentage of Indo-Pak trade is a mere 16 percent of the regional trade (Raihan & De, 2014).Pakistan is in the process of Trade normalization with India. Pakistan’s Ministry of Commerce intends togrant India the Non-Discriminatory Market Access (NDMA) as India has already granted MFN status toPakistan in 1996, due to the implementation of SAFTA in 2006 of which both countries are members, thisintention is now seen more as a reality. This decision to normalize the trading regime between Pakistan andIndia is seen to have massive potential for trade between the two countries that so far lies largely dormant.122.0300.8106.990.220.10.511.791.91
Draft not to be quotedFigure 7: Bilateral Trade b/w India and PakistanBilateral Trade B/w India and Pakistan2,500,000 1.96 BillionSAFTA Operational2,000,0001,500,0001,000,000 456.33 Million500,0000200320042005200620072008India Export to Pakistan2009201020112012201320142015Pakistan Exports to IndiaSource: Trademap, United Nation Commodity Trade Statistics DatabasePakistan’s delay in granting India NDMA status has frequently been noted as the main obstacle to realizingthis potential trade that would likely result in a corresponding increase in consumer welfare on both sidesof the border. However, if previous trade agreements are taken into account, Pakistan has not alwaysbenefitted from this process. For instance, Pakistan’s main FTA with China, an economic giant, does notappear to have improved the situation for Pakistan’s domestic producers. A major issue in Pak-Indo tradeis the high level of protection in the form of both tariff and non-tariff barriers. I will discuss few issues,along with others, in the next section.2.2 Issues in Pak-India Trade NormalizationIndia’s standards regime, which is unique to India and in certain cases does not recognize the standardsdeveloped and enforced by developed countries. India has complex and rigid requirements for labellingand packaging, quarantine, certification etc. for many high potential Pakistani export products.The mutually agreed and implemented visa regime remains relatively illiberal despite some notableimprovement in its terms. Multiple entry visas are now available, but individuals must have a minimumannual income to qualify. Police reporting on arrival and departure is still required. A business visa holderfrom Pakistan cannot remain in India for more than 30 continuous days on any one visit and still faces alimit on the number of cities he or she can visit. These are not featuring of India’s visa policies for other13
Draft not to be quotedcountries such as China and Sri Lanka. The shortcomings of the visa regime on both sides seriously hamperinteraction between the two countries’ business communities (PBC, 2013).India imposes high para-tariffs on imports, with para-tariffs reaching up to 23% on imported goods,compared to a 12% duty on local producers (PBC, 2015). On the other hand, Pakistani General Sales Tax(GST), which is 17%, is exempt for imports of food, raw materials and capital goods, and therefore whilesome Pakistani products have a 5% advantage over imports (given a basic customs duty of 5%) others mayhave none. On the other hand, local producers in India have an advantage over exporters by a margin of atleast 10%. These are not import tariff rates kept on other SAFTA countries like Bangladesh and Sri Lanka(PBC, 2015).India highly subsidizes its local industries; its 2015 budget earmarked USD 37 billion for major subsidies.In its budget for fiscal year 2014-2015 India allocated USD 18.4 billion (0.95% of GDP) for direct foodsubsidies. On the other hand, Pakistan’s total food subsidies in its 2014-2015 federal budget amounted toUSD 161 million (0.06% of GDP) when added up. Pakistan allocated USD 147 million for subsidies tofarms in the same year, none of which was disbursed since agriculture became a subject of the provincesand a mechanism to spend the subsidy could not be devised.One of the main reasons for Pakistan granting India NDMA status is India’s promise to immediately reduceits Sensitive List for Pakistan to 100 items. The Indian side has repeatedly hinted that most of the items tobe removed from the Sensitive List comprise of products within which Pakistan enjoys exportcompetitiveness, although these items are yet to be stated. But a reduction in tariffs may not necessarilytranslate into increased exports from Pakistan, if Indian consumers avoid products from Pakistan onaccount of their history.According to an Authoritative report by PBC (2015), If SAFTA is taken under consideration, Bangladeshfaces the Least Developed Countries sensitive list which consists of a mere 25 items as compared to theNon-Least Developed countries sensitive list faced by Pakistan, which runs to 614 items. This is animportant issue, since unless India offers Pakistan terms similar to those offered to Pakistan’s regionalcompetitors (i.e. Bangladesh, Sri Lanka etc) the actual impact of a reduction in the Sensitive List may bringlittle substantial gain for Pakistan.3. Methodological FrameworkThe methodological framework used in this paper for examining the economy wide impact of regionalintegration in South Asia is based on neo-classical theory. The paper uses an extended version of the GTAP14
Draft not to be quotedmodel (Hertel and Tsigas, 1997). The GTAP model uses the only available common global dataset for theeconomy wide analysis, the GTAP database 9a (Aguiar et.al 2016). The GTAP model assumes perfectlycompetitive markets, with all production and trade activities exhibiting constant returns to scale, firms andhousehold display profit and utility maximizing behavior respectively. The model is solved using thesoftware GEMPACK (Harrison and Pearson, 1996).The MyGTAP model extensions to the GTAP model include several new characteristics that are helpful inexamining the behavior of multiple households (Walmsley and Minor 2013a). First, it allows moreflexibility in the treatment of government savings and spending by removing the regional household of thestandard GTAP model and replacing it
Regional Trade and Economic Development: Options for Pakistan1 Muhammad Aamir Khan2 ABSTRACT Pakistan shares its northern border with China, while it shares part of its northern, eastern and southern border with India: the second and seventh larg