Transcription
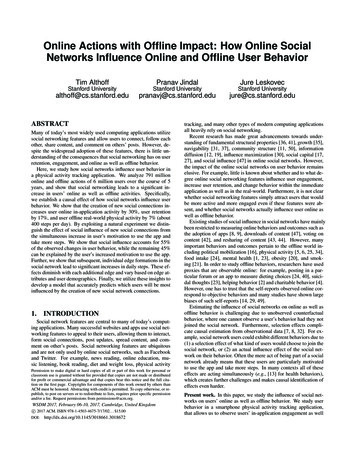
5Regional Varieties of EnglishThe regional varieties of American English have been a major focus since at least the earlypart of the twentieth century, when dialectologists began conducting large-scale surveys ofregional dialect forms, particularly the Linguistic Atlas of the United States and Canadalaunched in 1931. Although the traditional focus on regional variation took a back seat toconcerns for social and ethnic dialect diversity for several decades, there has been resurgentinterest in the regional dimension of American dialects. The revitalization was buoyed bycompletion of the six volumes of the Dictionary of American Regional English (Cassidy 1985;Cassidy and Hall 1991, 1996; Hall 2002, 2012, 2014), and by the publication of The Atlas ofNorth American English (Labov, Ash, and Boberg 2006). There are also a number of usefulonline surveys of regional dialect differences, for example the Cambridge Online Survey ofWorld Englishes which offers immediate visualization of many lexical differences(http://www.tekstlab.uio.no/cambridge), the Yale University Grammatical Diversity Project,which offers views of grammatical dialect differences across North America(http://microsyntax.sites.yale.edu/), and two sources on dialect pronunciations in both US andworld Englishes: the International Dialects of English Archive (IDEA), and the George MasonUniversity Speech Accent Archive (http://accent.gmu.edu/). Activity on a number of thetraditional Linguistic Atlas projects continues in digital format at the University of Georgia(http://us.english.uga.edu).Linguists have long debated the precise place of regional dialect studies in the overallinvestigation of language variation, given the fact that traditional studies have concentrated onthe geographical distribution of individual words as opposed to overall patterns of languageorganization. The focus on cartographic plotting as opposed to linguistic patterning has ledsome to the conclusion that regional dialect study is really a branch of geography rather than akind of linguistic inquiry. Certainly, studies of regional language variation may be informedby models and methods from the fields of cultural and historical geography, but there is noinherent reason why the study of regional variation in language cannot mesh models fromgeography with the rigorous study of linguistic patterning. In fact, linguists have historicallyturned to regional dialect diversity in search of answers to fundamental questions aboutlanguage patterning and language change. By the same token, the study of regional dialectsbenefits from the precise structural description of forms provided by linguistic study. Anumber of recent studies of language variation have neatly brought together models fromthese distinct vantage points in insightful and informative ways. In fact, the importance of thisintegrated view has become so well recognized in recent years that it has led to the foundingof an entire journal dedicated to current approaches to linguistically informed dialectgeography, The Journal of Linguistic Geography, edited by William Labov and DennisPreston. In this chapter, we consider various methodologies for studying regional variation, aswell as models that apply to the spread of linguistic forms over time and space.C05p. 203
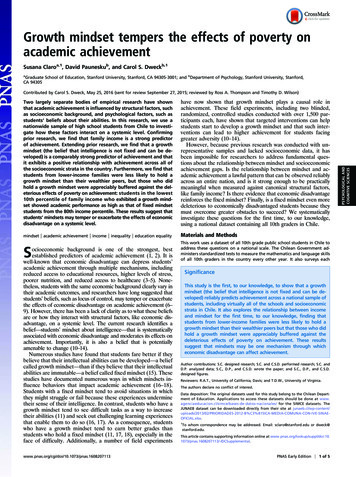
5.1Eliciting Regional Dialect FormsThe traditional approach to charting regional dialect patterns starts with the elicitation ofdistinguishing dialect forms from speakers representing communities within a broadgeographical area. In most major projects conducted under the aegis of the Linguistic Atlas ofthe United States and Canada, targeted areas constituted major regions of the United States,such as New England, the Upper Midwest, the Gulf States, and so forth, but studies run thefull gamut of regional size, including surveys of states and sub-regions within them.Traditional questionnaires can be quite exhaustive and may take hours to administer aseach possible dialect form is probed. For example, the questionnaire used for the Dictionary ofAmerican Regional English (DARE) contains over 1,800 questions in all. The actual questionsused to elicit forms may vary, depending on the item. Typical elicitation frames include thefollowing:1 Labeling Based upon a Description of an Iteme.g. What do you call a small amount of food that’s eaten between meals?What do you call the heavy metal pan that’s used to fry foods?2 Labeling an Item Present at the Scenee.g. What do you call that piece of furniture you’re sitting on?What time is it in this picture?3 Completing Incomplete Phrases or Sentencese.g. When your skin and eyeballs turn yellow, you’re getting .When a pond or lake becomes entirely covered with ice, you say it’s .4 Listing Topical Inventories of Itemse.g. What kinds of wild flowers do you have around here?What kinds of snakes do you have around here?The aim of elicitation is simply to get subjects to offer the most common variant theywould use without biasing their choice by suggesting a variant in the elicitation frame. Afieldworker’s notes may include the variant offered by the subject in response to a particularquestion frame, appropriate notes about reactions to forms, familiarity with alternative forms,and any other relevant observations. In figure 5.1, we have excerpts from the field notes of aleading American dialectologist, Raven I. McDavid, Jr. The interview was conducted in 1946in Charleston, South Carolina, with a white female, age 69, who was an artist and author aswell as a member of the highest social class in the community. The excerpt includes samplequestions designed to elicit pronunciation, grammar, and lexical forms as contained in thefieldwork manual used by each fieldworker in the survey.Figure 5.1Samples from a Linguistic Atlas worksheetThe existence of an established dialect survey questionnaire format also provides aconvenient basis for comparing dialect surveys in different communities and in the samecommunity at different points in time. For example,, Ellen Johnson, in Lexical Change andVariation in the Southeastern United States, 1930-1990 (1996), compares items in similarpopulations across a 60-year time span to show how the dialect vocabulary of the SoutheasternUnited States has shifted over time. She shows further that various cultural and socialvariables such as education level, rurality, and age have remained fairly constant in their effecton the lexicon as it has changed during this period.C05p. 204
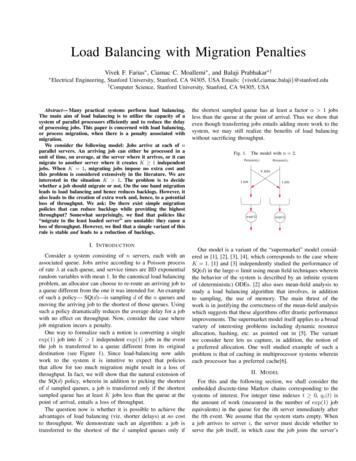
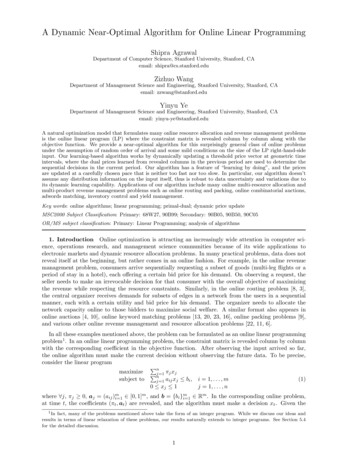
Exercise 1Following are some dialect variants, including pronunciation, grammar, and vocabulary items.For each of the items, construct reasonable question frames that would enable a fieldworker toelicit the items without using the item itself in the question. Try your questions on somespeakers and evaluate the relative success of your frames. What kinds of items seem theeasiest to elicit, and what items the most difficult?Pronunciation1 The production of the vowel in ten and tin.2 The production of the first vowel in ferry, fairy, and furry.3 The production of the vowel in caught and cot.Grammar1 The plural form of deer.2 The past tense and participle form (e.g. has ) of creep.3 The use of indefinite forms in a negative sentence (e.g. He didn’t go anywhere/nowhere).Lexical1 The use of the term frying pan, skillet, spider, etc.2 The use of ATM/bank machine/cash machine/guichet.3 Distinctions between different shades of purple in the color spectrum.5.2 Mapping Regional VariantsOnce the data have been collected from community representatives, the different variants foreach item are plotted on a map in some fashion. In a classic example of this cartographicmethod, from Hans Kurath’s A Word Geography of the Eastern United States (1949: fig. 66),the distribution of pail and bucket is charted for subjects interviewed in the 1930s and 1940sas part of the initial phase of the Linguistic Atlas project. In the map in figure 5.2, the largersymbols indicate that four or more subjects in a community used the variant in question.C05p. 205
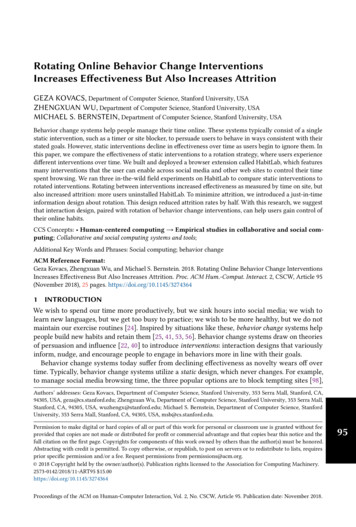
Figure 5.2Traditional Linguistic Atlas map of pail and bucket in the Eastern United States (from Kurath1949: figure 66; reprinted by permission of the University of Michigan Press)Charting the variants for each item and community on a map was originally done by hand,a time-consuming task that required careful attention to cartographic detail. In more recentyears, of course, these cartographic plots can be automatically generated using computationaltools, allowing researchers to display plot data more quickly and accurately in a variety offormats. In figure 5.3, we provide a computer-generated map of the same data captured infigure 5.2. The plotting includes four degrees of probability shading for the elicitation of thepail variant, with the darkest squares showing the highest probability that speakers will use theterm pail (75–100 percent) and the white squares showing the lowest probability (0–25percent) that this term will be elicited. In current dialect mapping, probabilities are oftenpreferred over depictions of the simple use or non-use of forms, because they more accuratelyreflect the tendencies when variable data are involved.C05p. 206
Figure 5.3Probability map for the occurrence of pail (from Kretzschmar 1996: 32, figure 14. Reprintedwith the permission of Cambridge University Press)It is also possible to generate maps of particular regional dialect features from some websites, for example the web site for the Linguistic Atlas of the Middle and South Atlantic ml). Maps of the distribution of particulargrammatical features across North American can be generated from the Yale UniversityGrammatical Diversity Project mentioned above.Computerized cartographic methods were first used in connection with the DARE surveysbeginning in the early 1960s. In figure 5.4 is a comparison of a computer-generated map fromDARE and a conventional, hand-drawn map. An added wrinkle in the DARE map is itsproportional display of states on the basis of population density, rather than geographical area.With this type of display, a state such as Texas is not nearly as large as New York, eventhough it is much more expansive geographically, since New York has a higher proportion ofthe population of the United States than Texas. By comparison with the traditional spatialmap, the proportional map seems distorted, but it adds the important dimension of populationdistribution to the consideration of regional variation. As we shall see when we discuss dialectdiffusion later in this chapter, population density can be an important factor in the regionalspread of dialect variants. The development of computerized cartographic techniques certainlyhas gone a long way towards reducing the time-consuming and painstaking work onceinvolved in mapping patterns of geographical distribution and has made cartographic plottingand its results readily accessible to a wide audience of researchers and students. In figure 5.5is a HEAT MAP visualization—that is, a representation of data where different values areindicated as different colors, and differing proportions/probabilities as differing degrees ofshading (similar to the probability map in figure 5.3 above). The data for the lexical variantsC05p. 207
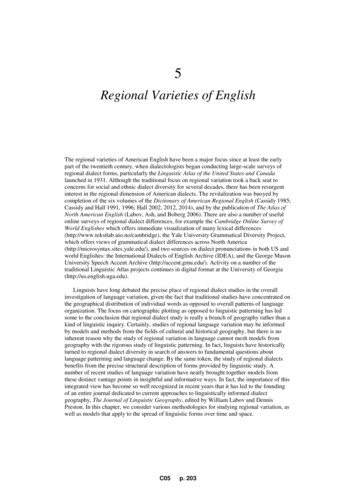
for a carbonated drink (soda, pop, cola, etc.) are based on the 2003 Harvard Dialect Surveyconducted by Bert Vaux and Scott Golder; the map was generated by Joshua Katz.Figure 5.5 Heat map for the distribution of soda, pop, etc. (courtesy of Josh Katz; based on Vaux andGolder’s 2003 Harvard Dialect Survey.C05p. 208
Figure 5.4 Comparison of DARE map and conventional map of dialect variants (from Cassidy 1985: xxix,figure 7; 1985 by the President and Fellows of Harvard College, reprinted by permission of HarvardUniversity Press)As maps such as the above have become more widely available, they have traveled beyondacademic circles to the general public, who understandably also has an enduring curiosityabout regional dialect variation. Katz’s heat maps have been featured in various nationalmedia outlets, and Vaux and Golder’s survey has even found its way into hundreds ofYouTube videos of people performing their answers to the Harvard Dialect Survey questions.Further evidence of the widespread interest in pinpointing regional dialect variants isevidenced in Katz’s popular dialect quiz, again based on Vaux and Golder’s survey, publishedin the New York Times in December /sunday-review/dialect-quiz-map.html)5.3 The Distribution of Dialect FormsFor some regional items, the distribution of dialect forms shows a GROUP-EXCLUSIVE patternin which communities in one area use one variant while those in another region use a differentone. For example, in the map of pail and bucket displayed in figure 5.3, you can trace a line ofdemarcation that sets apart southern and northern regions of Pennsylvania: South of the lineC05p. 209
bucket is used and north of the line pail is used. When the distribution shows a fairly clear-cutdemarcation, a line indicating the boundaries of the different variants, an ISOGLOSS, may bedrawn. Isoglosses set apart zones of usage in a very discrete way, but not all patterns of usageare as clear as that delimited for the use of pail and bucket in Pennsylvania in the 1930s and1940s. In many cases, variants are more interspersed, making it difficult to draw a meaningfulisogloss. In the South, there are pockets of usage for pail in Virginia, North Carolina, andGeorgia. In addition, there are dialect TRANSITIONAL ZONES, where more than one variantoccurs, with different speakers using different variants, or individual speakers using both. Infact, transitional zones are more typical than the abrupt pattern of distribution implied byisoglosses, especially in more densely populated areas. Boundaries between dialects may beSHARP, where a well-defined, linear boundary exists (e.g., the boundary between Windsor,Canada, and the adjacent city of Detroit, Michigan); FADING, where regional features diminishas one moves from a dialect center to outlying areas (e.g. the areas outlying Pittsburgh to theNorth towards Erie, PA), OVERLAPPING, where linguistic features of different dialect regionsco-exist (Southern and non-Southern traits in Northern Virginia), or NULL, where intermediateareas do have not been found to use of more clearly defined adjacent areas (e.g. regions ofNew Jersey in between New York City and Philadelphia that do not have the complex vowelpronunciation patterns of either city. Isoglosses are certainly useful indicators of theboundaries of regional usage patterns, but they must be viewed with important qualifications.Isoglosses often represent ideal rather than real patterns of delimitation, a “convenient fictionexisting in an abstract moment in time” (Carver 1987: 13).In a microscopic view of regional variation, each boundary line between two differentforms for a given item indicates a different dialect area, but this reduces the definition ofregional dialect to a trivial one. When the overall responses to dialect questionnaires areconsidered, different isoglosses may show similar patterns of delimitation. These clusters, orBUNDLES OF ISOGLOSSES, are usually considered significant in determining regional dialectareas.Predictably, major regional areas are typically determined by having larger bundles ofisoglosses than minor dialect areas. Using this approach, the initial phase of the LinguisticAtlas survey of the Eastern United States ended up proposing several major regional dialectsand some minor dialect areas. For example, Kurath, in his Word Geography of the EasternUnited States (1949), presented a map of major and minor areas that became the standardrepresentation of regional dialects along the Eastern Seaboard for almost a half century. As wediscussed in chapter 4, this map delimits three major regional areas, the North, the Midland,and the South, with a number of subregional dialects for each major area. This map isreprinted as figure 5.6.C05p. 210
Figure 5.6Dialect areas of the Eastern United States, based on Linguistic Atlas isoglosses (from Kurath1949: figure 3; reprinted by permission of the University of Michigan Press)A number of measures have been proposed for determining the relative significance ofisogloss bundles. In Carver’s American Regional Dialects: A Word Geography (1987), whichis based primarily upon lexical data (800 lexical items with regional distribution) taken fromthe files of DARE, the notion of ISOGLOSSAL LAYERING is used to determine major and minorregional varieties. The term LAYER, taken from physical geography, is used to refer to aunique set of areal features, but the importance of this concept lies in the fact that it is used tocapture overlap and divergence in regional dialects by examining levels of layering rather thanindependent sets of isogloss bundles. The most concentrated regional dialect area, where thegreatest number of regionally specific features are present, is the PRIMARY DIALECT AREA. InSECONDARY and TERTIARY dialect areas, there are progressively fewer of these dialectfeatures. For example, the core of the Northeast American English dialect has 20 to 24 wordsfrom Carver’s inventory of regional lexical items, whereas secondary layers have only 15 to19, and so forth. While this approach does not eliminate some of the basic problems withisoglosses we have pointed out, it captures the hierarchical nature of overlap and divergence inregional varieties. As an example of layering, Carver’s (1987) analysis of the extension of theNorthern dialect area into the Northwestern United States is given in figure 5.7. The areaslabeled as primary represent the core areas of the westward extension of Northern and InlandNorthern dialect features, whereas the secondary, tertiary, and quarternary areas of the North,Inland North, and Upper North represent less concentrated layers of these extensions.C05p. 211
Figure 5.7An example of dialect layering in the Northwestern United States (from Carver 1987: 214;reprinted by permission of the University of Michigan Press)Layering can also be represented hierarchically. For example, Carver’s Western dialectlayers can be presented in the form of a hierarchical tree, as in figure 5.8.Figure 5.8An example of dialect layering in the West, represented hierarchically (from Carver 1987: 243;reprinted by permission of the University of Michigan Press)The fact that lexical variation is so often used as a primary basis for regional dialects hasbeen a major source of contention among students of language variation. Some linguists havemaintained that lexical differences are among the most superficial types of linguistic structure,and therefore among the least reliable indicators of dialect areas. However, it should be notedthat Carver’s lexical boundaries correlate well with boundaries arrived at independently incultural geography, including areas delimited by such features as architectural styles, religion,political ideology, and a number of other culturally significant variables. Thus, lexical items,C05p. 212
regardless of their linguistic status, serve as indicators of more broadly based cultural andhistorical foundations upon which regional dialects rest, and they should not be dismissed asinsignificant.As noted in chapter 4, in the late 1990s William Labov, Sharon Ash, and Charles Bobergconducted a comprehensive survey of vowel variation in the United States and Canada using atelephone survey (TELSUR), resulting in the landmark publication, the Atlas of NorthAmerican English (ANAE) (2006). The publication includes an interactive web site allowingone to explore the various dialect regions and their characteristics and the regional distributionof particular features, as well as to listen to samples of vowel differences and to conversationalspeech in each dialect region and community surveyed. At least two speakers from allEnglish-speaking cities in the United States and Canada with a population of more than50,000 people were included in the survey, and all of the vowels for 439 speakers weresubjected to detailed acoustic analysis.The contrasts between Labov, Ash, and Boberg’s ANAE survey and the earlier LinguisticAtlas of the United States and Canada (LAUSC) extend beyond linguistic level (i.e. lexical vs.phonological) and technical sophistication of cartographic plotting. The LAUSC was drivenby an interest in historical dialect features and regions, whereas the ANAE is centered onlanguage change taking place in present-day communities. For LAUSC, ideal intervieweeswere older, rural men with little geographic mobility who preserved older ways of speaking,whereas ideal participants for ANAE were young women, since this population group tends tobe at the forefront of language. The summary map of the major regional varieties andsub-regions from Labov, et al. (2006: 141) is again presented in figure 5.9.Figure 5.9 Summary map from the Atlas of North American English (from Labov, Ash,and Boberg 2006)Though radically different in research design and sampling technique, many phonologicalvariables in Labov, et al. (2006) show patterns of regional variation that parallel those shownfor lexical items. As with lexical variables, phonological features show regional layering. Wemay, for example, expect to find a core Southern or core Northern area, where the highestconcentration of specific phonological features is found, and secondary and tertiary zonessurrounding these primary areas.As we mentioned in chapters 3 and 4, investigations of vowel systems conducted in thepast several decades have revealed that there are several major systematic changes currentlyunder way in the US, delimiting major dialect areas.One pattern of change is called the NORTHERN CITIES VOWEL SHIFT. As Labov describesthis VOWEL ROTATION pattern (Labov 1994: 177–201; see also Labov, et al. 2006: 187-215),the TRAP, LOT, and THOUGHT vowels are moving forward and then upward, and the vowels ofDRESS, STRUT, and KIT are moving backward and then downward. For example, the TRAPvowel is fronting and raising, leaving room for the LOT vowel in a word like lock to moveforward, so that it sounds almost like lack. In turn, this movement leaves room for words inthe THOUGHT class to move toward LOT, so that caught now sounds like what would formerlyhave been pronounced as cot (but now sounds almost like cat). At the same time, the DRESSvowel moves backward towards the STRUT vowel, which is then pushed backward, so that aword like bus might sound more like boss.[INSERT ENHANCEMENT 5.1][INSERT ENHANCEMENT 5.2]C05p. 213
Diagrammatically, the shift may be represented as in figure 5.10. Recall that the vowelsare arranged so that vowels produced with greater tongue height appear at the top of the chart,and those produced with greater fronting of the tongue appear on the left. For convenience,“key words” are given. The arrows indicate the direction in which the vowels are moving,based on Labov’s characterization of this shift pattern.Figure 5.10The Northern Cities Vowel ShiftRegionally, the vowel rotation pattern depicted in figure 5.10 in concentrated in the largermetropolitan areas that start in Western New England and proceeds westward into upstateNew York; the extreme northern portions of Ohio, Indiana, and Illinois; Michigan; andWisconsin. More advanced stages of this change can be found in younger speakers in thelargest metropolitan areas in this Northern region, such as Buffalo, Cleveland, Detroit, andChicago.Exercise 2Identify in the following list of words those items that would be involved in the NorthernCities Vowel ropeAs the Northern Cities Vowel Shift spreads across the northern portion of the US,researchers continue to track its progress, not only in geographic space but also across socialC05p. 214
groups and age groups. In addition, not all researchers are in agreement that the pattern infigure 5.10 tells the whole story, and there may be other vowel movement patterns that arealso an important part of dialect change in the Northern US (e.g. Gordon 2001, Thomas 2001).However, there is no question that sweeping pronunciation changes have been taking place inNorthern metropolitan areas over the course of the past half century, and that these changesare proceeding in quite different directions from the vowel shift patterns affecting otherregions such as the Southern US.In the SOUTHERN VOWEL SHIFT, the PRICE vowel unglides and the nucleus may moveslightly forward, so that a word like time may sound like tom or tam. The FACE vowel lowersbetween the DRESS and PRICE but retains a glide, so that a word like bait may sound somethinglike bite. Concurrently, the DRESS vowel raises toward FACE and takes on a glide, so that aword like set sounds almost like the phrase “say it.” In essence, then, DRESS changes placeswith FACE. In some parts of the South, the KIT vowel may change places with the FLEECEvowel as well, with FLEECE lowering toward FACE and KIT raising and taking on a glide, sothat beat sounds like bait and sit sounds like “see it.” Meanwhile, the back vowels of GOOSEand GOAT are moving forward so that they sound more like gews and gewt, respectively. Therotational patterns that characterize the Southern Vowel Shift are indicated in figure 5.11.Figure 5.11Interactive chart:The Southern Vowel ShiftLabov's Southern Vowel ShiftExercise 3Identify in the following list of words those vowels that would be involved in the SouthernVowel Shift. Is the vowel of the word involved in (1) the gliding of KIT and DRESS vowels(e.g. bid, bed), (2) the lowering of FLEECE and FACE vowels (e.g. beet, late), or (3) the backGOOSE and GOAT vowels moving forward (e.g. boat, boot)?C05p. 215
dBecause the Southern Vowel Shift and Northern Cities Vowel Shift involve very differentrotation patterns, the major varieties characterized by these vowel shifts have over the yearsbecome increasingly different from one another. In fact, this differential rotation is the majorreason why many dialectologists now claim that Southern and Northern speech are currentlydiverging rather than converging. Regionally, the Southern Vowel Shift encompasses most ofthe Southern region indicated on the map in figure 5.11, although the reversal of KIT andFLEECE is confined mostly to the Inland South. In addition, whereas the Southern VowelShift is relatively stable, it is slowly receding while the Northern Cities Vowel Shift continuesto advance. Another important differences between the two shift patterns is the SouthernVowel Shift is more advanced in rural areas of the South than in metropolitan areas, theconverse of what we have seen for the Northern system, in which change radiates outwardfrom, and are most advanced in, urban areas rather than rural locations.Exercise 4Identify whether the vowels in the following words are involved in the Northern Cities Shiftor the Southern Vowel Shift. In some cases, the same vowel may be involved in either theNorthern Cities Shift or the Southern Vowel Shift, but the rotation will be in quite differentdirections. There are three types of answer: (1) Northern Cities Shift, (2) Southern Shift, and(3) both the Northern Cities and the Southern Shift, but rotating in different directions. Incases where the same vowel is subject to both the Northern and Southern Shift, identify thedirection of the rotation for each shift. You might try producing some of these voweldifferences, especially if you know someone who is a good model for the particular aidAlthough these rotational schemes represent two major shifts in American English vowels,they are not the only regional areas involved in vowel shifting. For example, NorthernCalifornia is experiencing a vowel shift indicating its emergence as a distinctive dialectregion. Like the Southern Vowel Shift, the back vowels are moving forward, so the GOOSEvowel becomes more like giws and the GOAT vowel more like gewt. But the front vowels areshifting in quite different directions, so that the KIT vowel is raising towards the FLEECE vowelbefore ng (as in something like “theeng” for thing) but lowering towards the DRESS vowelbefore other consonants (as in something like dead for did). Meanwhile, the DRESS vowel islowering towards the TRAP vowel. The TRAP vowel, in turn, is shifting in two directions; itbecomes a diphthong like stee-and for stand before nasals while shifting towards the LOTvowel elsewhere, as in “bock pock” for backpack. The NORTHERN CALIFORNIA VOWEL SHIFTis shown in figure 5.12.C05p. 216
Figure 5.12The Northern California vowel shift (adapted from Penelope Eckert’s web site:http://web.stanford.edu/ eckert/vowels.html)Interactive chart: Northern CA vowel shiftAudio map: California accentsSome parts of the Northwest such as the Seattle, Washington (Scanlon and Wassink 2010;Wassink forthcoming), and Portland, Oregon (Ward 2003), are currently undergoing vowelshifts that are associated with an emerging regional identity, but other regional dialects aredefined chiefly by their lack of participation in the sweeping rotations of either the NorthernCities or Southern Vowel Shift. In these regions, the TRAP vowel, a pivotal vowel in theNorthern Cities Shift, is relatively stable, and there is a merger of the low back vowel ofTHOUGHT and LOT, as in the same pronunciation for caught and cot or dawn and Don. Theapproximate area encompassed by this LOW BACK MERGER is given in figure 5.13.C05p. 217
Figure 5.13The Distribution of the cot-caught (LOT vowel-THOUGHT vowel) mergerIt appears that the merger in figure 5.13 radiates from three centers. One is in Eastern NewEngland, near the Boston area, which ext
Regional Varieties of English The regional varieties of American English have been a major focus since at least the early part of the twentieth century, when dialectologists began conducting large-scale surveys of regional dialect forms, particularly the Linguisti