Transcription
statstutor community projectencouraging academics to share statistics support resourcesAll stcp resources are released under a Creative Commons licenceStcp-marshallowen-7The StatisticsTutor’sQuick Guide toCommonly UsedStatistical Tests Ellen Marshall, University of Sheffieldwww.statstutor.ac.ukReviewer: Jean RussellUniversity of Sheffield
ContentsCONTENTS .2INTRODUCTION .4TIPS FOR TUTORING .5SECTION 1 GENERAL INFORMATION .6DATA TYPES .7SUMMARY STATISTICS .7Summary of descriptive and graphical statistics .8DECIDING ON APPROPRIATE STATISTICAL METHODS FOR RESEARCH .9ORDINAL DATA .9WHICH TEST SHOULD I USE? .10Common Single Comparison Tests .10Tests of association .10One scale dependent and several independent variables .11ASSUMPTION OF NORMALITY .12Statistical tests for normality .12Non-parametric tests .13OTHER COMMON ASSUMPTIONS .14For independent t-tests and ANOVA .14For repeated measures ANOVA .14Independent observations.14CONFIDENCE INTERVALS .15HYPOTHESIS TESTING .17MULTIPLE TESTING .18SAMPLE SIZE AND HYPOTHESIS TESTS .19EFFECT SIZE .19SECTION 2 THE MOST COMMON STATISTICAL TECHNIQUES USED .20INDEPENDENT T-TEST .21MANN-WHITNEY TEST .22PAIRED T-TEST .23WILCOXON SIGNED RANK TEST .24ONE-WAY ANOVA .25KRUSKAL-WALLIS TEST .26ONE-WAY ANOVA WITH REPEATED MEASURES (WITHIN SUBJECTS) .27FRIEDMAN TEST .28TWO-WAY ANOVA .29CHI-SQUARED TEST.30ODDS AND RELATIVE RISK .31Odds .31Odds Ratio .31Relative Risk (RR) .31CORRELATION .32PEARSON’S CORRELATION COEFFICIENT .32RANKED CORRELATION COEFFICIENTS .33Spearman’s Rank Correlation Coefficient .33Kendall’s Tau Rank Correlation Coefficient .33PARTIAL CORRELATION .33REGRESSION .34LINEAR REGRESSION .34LOGISTIC REGRESSION .36SECTION 3 OTHER STATISTICAL TESTS AND TECHNIQUES .37PROPORTIONS TEST (Z-TEST).38RELIABILITY .39Interrater reliability .39Cohen’s Kappa .39Intraclass Correlation Coefficient .40Cronbach's alpha (reliability of scales) .41PRINCIPAL COMPONENT ANALYSIS (PCA) .43CLUSTER ANALYSIS .47Page 2 of 53
HIERARCHICAL CLUSTERING .47K-MEANS CLUSTERING.49SECTION 4 SUGGESTED RESOURCES .50BOOKS .51WEBSITES .52Page 3 of 53
IntroductionThis guide is designed to help you quickly find the information you need about a particularstatistical test.Section 1Section 1 contains general information about statistics including key definitions and whichsummary statistics and tests to choose. Use the “Which test should I use?” table to allowthe student to choose the test they think is most appropriate, talking them through anyassumptions or vocabulary they are unfamiliar with.Section 2Section 2 takes you through the most common tests used and those that are usually ascomplex as the students require. As a statistics tutor, you should be familiar with all thesetechniques.Section 3Section 3 contains tests and techniques that are more complex or are used less frequently.This section is aimed at tutors who have studied statistics in detail before.Page 4 of 53
Tips for tutoringWe are here to help the students to learn and not to do their work for them or to tell themexactly how to do their work (although this is very tricky sometimes!). Facilitating theunderstanding and ability to choose an appropriate statistical test is a success, even if theanalysis is not as thorough as if we had done it ourselves.Avoid maths! Most students carrying out project analysis do not need to know the mathsbehind the technique they are using. You may love maths but a lot of students are mathsphobic – even an x can frighten them!You cannot know everything! Statistics is a vast subject so don’t be afraid to say that youdon’t know. Ask others for help or look up information on the internet to help.Consider the students ability when advising on the best technique. They have to write upthe analysis and therefore need to understand what has been done. Carrying out simpleanalysis or even just a graph to summarise their results may be enough for their project.Don’t assume that the student knows anything about the technique they are suggesting!Students with no statistical knowledge at all can come in saying their supervisor wantsthem to carry out multivariate analysis. Get them to explain their project and why theythink the technique is suitable if you think that they know very little. In general, start withdescriptive statistics and simpler analysis if they have not done any analysis yet. Somestudents do know exactly why they are doing something and have investigated the topicfully so just help them with the complex technique if you can.Page 5 of 53
Section 1General informationPage 6 of 53
Data typesIn order to choose suitable summary statistics and analysis for the data, it is also importantfor students to distinguish between continuous (numerical/ scale) measurements andcategorical variables.VariablesScale(measurements or counts)Continuoustakes any valuee.g. heightDiscrete:integerse.g. number of childrenCategorical (tick boxes onquestionnaires)Ordinal:obvious ordere.g. likert scaleNominal:no meaningful ordere.g. genderSummary StatisticsStudents often go straight to the hypothesis test rather than investigating the data withsummary statistics and charts first. Encourage them to summarise their data first. As wellas summarising their results, charts especially can show outliers and patterns.For continuous normally distributed data, summarise using means and standard deviations.If the data is skewed or there are influential outliers, the median (middle value) andinterquartile range (Upper quartile – lower quartile) are more appropriate.Which average and measure of spread?ScaleNormally distributedMean (Standard deviation)CategoricalSkewed dataMedian (Interquartilerange)Ordinal:Median(Interquartile range)Nominal:Mode (None)Asking for the mean, median, minimum, maximum and standard deviation along withproducing an appropriate chart will identify outliers and skewed data. A big differencebetween the mean and median indicates skewed data or influential outliers.Page 7 of 53
Summary of descriptive and graphical statisticsChartVariable typePurposePie Chart orbar chartOne Categorical Shows frequencies/proportions/percentagesSummary StatisticsClass percentagesStacked /Two categorical Compares proportions withinmultiple bargroupsPercentages withingroupsHistogramMean and StandarddeviationOne scaleShows distribution of resultsScatter graph Two scaleShows relationship between two Correlation covariables and helps detect outliers efficientBoxplotOne scale/ onecategoricalCompares spread of valuesMedian and IQRLine ChartScale by timeDisplays changes over timeMeans by time pointComparison of groupsMeans plotOne scale/ 2categoricalLooks at combined effect of two Meanscategorical variables on the meanof one scale variablePage 8 of 53
Deciding on appropriate statistical methods forresearchThis is the information you need from a student to help them decide on the mostappropriate statistical techniques for their projectWhat is the main research question? This needs to be able to be defined with specificvariables in mind. Which variables (types of measurement) will help answer the researchquestion?Which is the dependent (outcome) variable and what type of variable is it?DependentCategoricalScaleNormally distributedParametric testSkewed i-squaredWhich are the independent (explanatory) variables, how many are there and whatdata types are they?Are relationships or differences between means of interest?Are there repeated measurements of the same variable for each subject?Ordinal dataSome departments routinely use parametric tests to analyse ordinal data. As a general ruleof thumb, ordinal variables with seven or more categories can be analysed with parametrictests if the data is approximately normally distributed. However, if the studentsdepartment/ supervisor expect scales of five to be analysed as continuous data, warn themwhy you think this is not appropriate but let them do it. We are here to advice and helpthem make decisions. Sometimes, questionnaires have sets of questions trying to measurean underlying latent variable. In that situation, summing or averaging the scores gives avariable which could be considered as scale so parametric tests can be carried out.Page 9 of 53
Which test should I use?Common Single Comparison nt Parametric test(explanatory) (data isvariablenormallydistributed)Non-parametrictest (ordinal/skewed data)The averages of twoINDEPENDENT groupsScaleNominal(Binary)Independent ttestMann-Whitneytest/ Wilcoxonrank sumThe averages of 3 independent groupsScaleNominalOne-wayANOVAKruskal-Wallis testThe average differenceScalebetween paired (matched)samples e.g. weightbefore and after a dietTime/ConditionvariablePaired t-testWilcoxon signedrank testThe 3 measurements onthe same ANOVAFriedman testRelationship between 2continuous ntSpearman’sCorrelationCoefficientPredicting the value ofone variable from thevalue of a predictorvariable or looking forsignificant relationshipsScaleAnySimple LinearRegressionTransform ng the relationshipbetween two categoricalvariablesCategoricalCategoricalTests of associationChi-squared testPage 10 of 53
One scale dependent and several independent variables1st independent2nd independentTestScaleScale/ binaryMultiple regressionNominal (Independentgroups)Nominal (Independentgroups)2 way ANOVANominal (repeatedmeasures)Nominal (repeatedmeasures)2 way repeated measuresANOVANominal (Independentgroups)Nominal (repeatedmeasures)Mixed ANOVANominalScaleANCOVARegression or ANOVA? Use regression if you have only scale or binary independentvariables. Categorical variables can be recoded to dummy binary variables but if there area lot of categories, ANOVA is preferable.Page 11 of 53
Assumption of normalityParametric tests assume that the data follows a particular distribution e.g for t-tests,ANOVA and regression, the data needs to be normally distributed. Parametric tests aremore powerful than non-parametric tests, when the assumptions about the distribution ofthe data are true. This means that they are more likely to detect true differences orrelationships that exist.The tests are quite robust to departures of non-normality so the data only needs to beapproximately normally distributed.Plotting a histogram or QQ plot of the variable of interest will give an indication of theshape of the distribution. Histograms should peak in the middle and be approximatelysymmetrical about the mean. If data is normally distribued, the points in QQ plots will beclose to the line.Below are some examples of very skewed data (i.e. non-normal).Statistical tests for normalityThere are statistical tests for normality such as the Shapiro-Wilk and Kolmogorov-Smirnofftests but for small sample sizes (n 20), the tests are unlikely to detect non-normality andfor larger sample sizes (n 50), the tests can be too sensitive. They are also sensitive tooutliers so use histograms (large samples) or QQ plots (small samples).Parametric testIndependent t-testWhat to check for normalityDependent variable by groupPaired t-testPaired differencesOne-way ANOVARepeated measures ANOVAResidualsResiduals at each time pointPearson’s correlation coefficientSimple linear regressionBoth variables are normally distributedResidualsPage 12 of 53
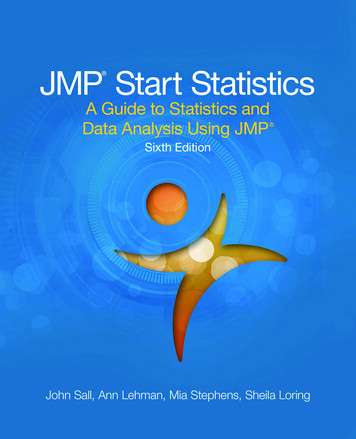
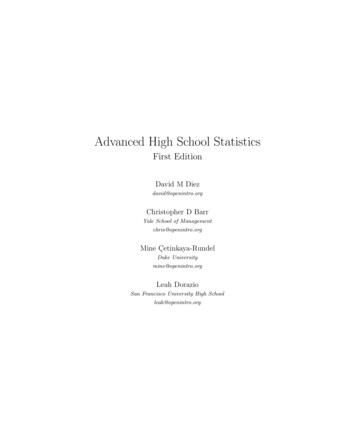
Non-parametric testsNon-parametric tests make no assumptions about the distribution of the data.Nonparametric techniques are usually based on ranks or signs rather than the actual dataand are usually less powerful than parametric tests.The example to the right is data on reaction times afterdrinking either water or alcohol. The reaction times bygroup were not normally distributed so an independent tcould not be used. The Mann-Whitney test is moreappropriate. It tests the hypothesis that the twodistributions are the same. All the data isordered and ranked from the fastest to theslowest irrelevant of group. The sum of the ranksfor each group is used to calculate a test statistic.If there is no difference between the groups thesum of the ranks will be similar. SPSS does all theranking for you so you don’t need to worry aboutthat.DependentvariableRank ofsubjecttestNon-parametric tests can also be used whenother assumptions are not met e.g. equality ofvariance.Some people also advise using non-parametrictests for small samples as it is difficult to assess normality.Page 13 of 53
Other common assumptionsFor independent t-tests and ANOVAHomogeneity of variances: Levene’s testUse: Used to test the equality of variances when comparing the means of independentgroups e.g. Independent t-tests and ANOVA.Note: The violation of this assumption is more serious than violation of the assumption ofnormality but both t-tests and ANOVA are fairly robust to deviations from this assumption.There are alternative tests within the t-test and ANOVA menus to deal with violations ofthis assumption.Interpretation:If the p-value is less than 0.05 reject H0 and conclude that the assumption of equalvariances has not been met.For repeated measures ANOVASphericity: Mauchly’s testUse: Tests for sphericity - a measure of whether variances of the differences between allrepeated measures are all equal. If the assumption is not met, the F-statistic is positivelybiased leading to an increased risk of a type 1 error.Interpretation:Significant when p-value 0.05 meaning there are significant differences between thevariance of differences, i.e. condition of sphericity is not met. If the assumption is not met,use the Greenhouse-Geisser correction to the degrees of freedom which appears in thestandard output.Independent observationsFor most tests, it is assumed that the observations are independent. That is the results forone subject* are not affected by another. Examples of data which is not independent arerepeated measures on the same subject (use the specific tests for this type of experiment)and observations over time (check the Durbin Watson test for regression). Anothersituation where observations are not independent is when subjects are nested withingroups with a common influence e.g. children within classes who may be influenced by theteacher (use multilevel modelling to include class as an extra RANDOM factor). Time seriesanalysis (which allows for non-independent measurements over time) and multilevelmodelling are beyond the scope of most students.*The subject is the unit of interest which could be a person, an observation, a day etc.Page 14 of 53
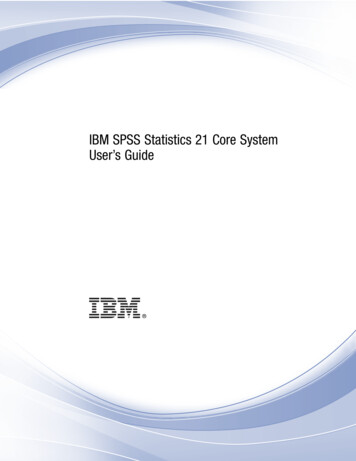
Confidence intervalsMost research uses sample data to makeinferences about the wider population.A population is the group of individualsyou are interested in e.g. a study intothe weight of babies born in Sheffieldwould use a sample but the results applyto the whole population.Every sample taken from a populationwill contain different babies so the meanvalue varies especially if the sample sizeis small.Confidence Intervals describe the variability surrounding the sample point estimate (thewider the interval, the less confident we can be about the estimate of the populationmean). In general, all things being equal, the larger the sample size the better (moreprecise) the estimate is, as less variation between sample means is expected.The equation for a 95% Confidence Interval for the population mean when the populationstandard deviation is unknown and the sample size is large (over 30) isX 1.96.snX sample mean , n number in sample,sn standard errorFor example, sample D of 30 babies born in 2013 had a mean weight of 7.19lbs with astandard deviation of 1.4, the 95% Confidence Interval for the population mean of allbabies is:7.19 1.96 1.4 30 7.19 0.5 (6.7 , 7.7)We would expect the population mean to be between 6.7 lbs and 7.7 lbs.Confidence intervals give a range of values within which we are confident (in terms ofprobability) that the true value of a population parameter lies. A 95% CI is interpreted as95% of the time the CI would contain the true value of the population parameter.Page 15 of 53
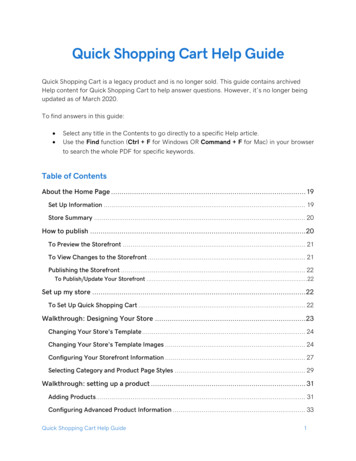
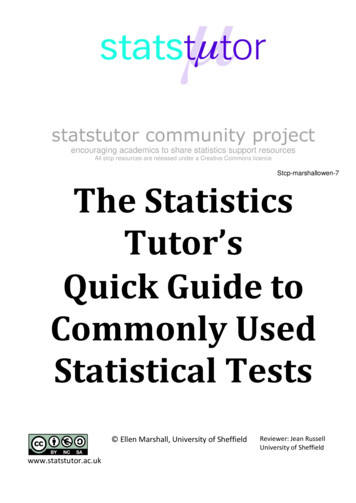
The diagram below shows the confidence intervals for 27 samples of babies taken from thesame population. The actual population mean (which is not normally known) is 7.73 lbs.Two of the confidence intervals do not contain the population mean (don’t overlap 7.73lbs) including the one previously calculated.Populationmean 7.73The website CAST has some great applets for demonstrating concepts to students. Thisebook contains core material including an applet for demonstrating confidence intervalshttp://cast.massey.ac.nz/collection public.htmlThere is a strong relationship between hypothesis testing and confidence intervals. Forexample, when carrying out a paired t-test, if the p-value 0.05, the 95% confidenceinterval for the paired differences will not contain 0. However, a p-value just concludeswhether there is significant evidence of a difference or not. The confidence interval of thedifference gives an indication of the size of the difference.For more information on the use of confidence intervals 9793/.Page 16 of 53
Hypothesis testingHypothesis testing is an objective method of making decisions or inferences from sampledata (evidence). Sample data is used to choose between two choices i.e. hypotheses orstatements about a population. Typically this is carried out by comparing what we haveobserved to what we expected if one of the statements (Null Hypothesis) was true.Key terms:NULL HYPOTHESIS (H0) is a statement about the population & sample data used to decidewhether to reject that statement or not. Typically the statement is that there is nodifference between groups or association between variables.ALTERNATIVE HYPOTHESIS (H1) is often the research question and varies depending onwhether the test is one or two tailed.SIGNIFICANCE LEVEL: The probability of rejecting the null hypothesis when it is true, (alsoknown as a type 1 error). This is decided by the individual but is normally set at 5% (0.05)which means that there is a 1 in 20 chance of rejecting the null hypothesis when it is true.TEST STATISTIC is a value calculated from a sample to decide whether to accept or rejectthe null (H0) and varies between tests. The test statistic compares differences between thesamples or between observed and expected values when the null hypothesis is true.P-VALUE: the probability of obtaining a test statistic at least as extreme as ours if the null istrue and there really is no difference or association in the population of interest. P-valuesare calculated using different probability distributions depending on the test. A significantresult is when the p-value is less than the chosen level of significance (usually 0.05).The court caseHypothesis testing can be thought of as a court caseMembers of a jury have to decide whether a person is guilty or innocent basedon evidence presented to them.Null: The person is innocentAlternative: The person is not innocent.The null can only be rejected if there is enough evidence to disprove it and the jury do notknow whether the person is really guilty or innocent so they may make a mistake.If a court case was a hypothesis test, the jury consider the likelihood of innocence given theevidence and if there’s less than a 5% chance that the person is innocent they reject thestatement of innocence.Page 17 of 53
In reality, the person is actually Guilty (null false) or Innocent (null true) but we can onlyconclude that there is evidence to suggest that the null is false or not enough evidence tosuggest it is false.Person is actuallyGuiltyInnocentConvictReleaseA type I error is equivalent to convicting an innocent person and is usually set at 5% (themagic 0.05!).Multiple testingSome students will try to perform a large number of tests on their data. The chance of atype I error increases with the number of tests. Adjustments to keep the type I error lowfor a larger number of tests are included as post hoc tests in ANOVA. This will mean less ofthe results are statistically significant. The most commonly used post hoc tests are Tukeyand Sidak although Scheffe’s is often used in medicine.Suggest that the student looks in their notes or papers in their field when choosing. Ifadjustments need to be made by hand, the Bonferroni adjustment is the easie
In order to choose suitable summary statistics and analysis for the data, it is also important for students to distinguish between continuous (numerical/ scale) measurements and categorical variables. Summary Statistics Students often go straight to the hypothesis test rather than investigating the data w