Transcription
M.Sc. Physical Chemistry LaboratoryManual: CHM 4231st Semester 2012-2013Venue: Physical Chemistry Laboratory, New Core BuildingInstructor-in-charge: Dr. Madhav Ranganathan (madhavr@iitk.ac.in)Lab-in-charge:Budh PrakashGautam KarmankarDr. Anjali PandeyStudent Tutors:Dipankar MondalKrishnandu MakhalIndian Institute of Technology KanpurKanpur-208016, UP, India
CHM 423; 2012-2013PrefaceThis document covers the necessary basic information you will need in order tocomplete the laboratory course CHM423. You will be expected to read all of therelevant background material prior to your laboratory.Madhav Ranganathan28 July 2012Page: 2 of 56
CHM 423; 2012-2013Laboratory IntroductionMeeting place and timesPlace: Physical chemistry Laboratory, New Core BuildingTime: Tuesday and Thursday 2:00 pm - 4:50 pm: LATE ARRIVAL WILL BEPENALIZED. NO ONE WILL BE ALLOWED IN THE LABORATORY AFTER2:15 pmInstructors :Instructor-in-charge: Dr. Madhav Ranganathan (madhavr@iitk.ac.in)Office: SL 302Phone: 6037Office hours: by appointmentLab-in-charge:Buddha PrakashGautam KarmankarDr. Anjali PandeyStudent Tutors:Dipankar MondalKrishnandu MakhalCourse goals:To convey the challenges and excitement of Physical Chemistry. In addition tolearning various experimental methods, you will be exposed to data collectionmethods, error analysis and report writing. It reinforces the knowledge you havelearned in classes and will give you a chance to apply your knowledge. It will makeyou familiar how to deal with complexity in experimentation, which is an importantcomponent of any scientist’s expertise.Text booksThere is no text book for this course. However, there are many excellent referencebooks. In addition, you can also read about experiments in popular chemistry journalslike Journal of Chemical Education.1. Experimental physical chemistry by Frederick A. Bettelheim2. Experimental physical chemistry by G. Peter Matthews3. Experimental physical chemistry by Farrington Daniels4. Experimental physical chemistry by Halpern and McBane5. Experiments in Physical Chemistry by Shoemaker, Garland and NiblerGrading :The relative weighting of each contribution to your grade is as follows:Laboratory reports and performance 60%; Quizzes 20%; Final exam 20%Page: 3 of 56
CHM 423; 2012-2013Laboratory Experiments and Laboratory ReportsThe course is built around several experiments in various topics in PhysicalChemistry. Laboratory reports will be required for all experiments. Reports shouldbe submitted on Thursday, the day you finish one experiment. Even if you havenot completed all parts of the laboratory report for the experiment, you will berequired to submit the report the day the experiment is over. When you submit thereport, you should clearly write the remaining work that needs to be done to completethe report and complete it the following time you submit the report.Students will work in the laboratory in pairs, but each student will be requiredto keep their own laboratory report book, which will be graded every week.The Laboratory Report is very important document. It is simultaneously alaboratory log book and a scientific report. It should contain the significant proceduraldetails that were followed during the experiment. All data should be recorded directlyin the laboratory report with a signature of one of the laboratory assistants. However,it should also contain the analysis in the form of graphs/calculations, discussions andliterature review of a typical scientific report. Each laboratory report should beindependently written. Any matter taken from other sources should be dulyreferenced. Copying of matter from other students will be taken very seriously andwill result in zero marks for the experiment; and a warning against repeating thesame.What should a typical Laboratory Report Contain:1. Name of the experiment and date of performing the experiment.2. Aim of the experiment: Please be specific while writing this. For example,“To determine the rate of reaction of A and B using method of D”.3. Main Concepts/Principles used in the design of the experiment: Again, youhave to be specific to the experiment. This can only be written if you take thetrouble to thoroughly understand the experiment. You can also write this partby logically going backward from the aim of the experiment.4. Procedural details: It is NOT necessary to rewrite the entire procedure asgiven in the manual. You do need to write the following:(a) A procedure (not detailed) that is based on the principles in part 3.(b) Any actual detail in the procedure that was followed during the experiment, thatdiffers from the manual. In case of interesting apparatus, you may also make a sketchof the same.Note that items 1, 2, 3 and 4(a) of the laboratory report can be written before startingthe experiment so that you can finish the report in time. The remaining parts have tobe written during and after the experiment.5. Recording of data, observations: This should be very clearly written out. It isrecommended that the white pages of your report be used for all materialwritten during the experiment, whereas the ruled pages can be used for detailsPage: 4 of 56
CHM 423; 2012-2013written before and after the experiment. If your result is in the form of agraph(s), then you should stick the graph(s) to the blank pages of yournotebook.When recording and analyzing data, use the appropriate number of digits (significantfigures) for each reading. Remember, the number of digit used in the data givesinformation about the precision of the measurement. It is very valuable informationand should not be taken casually. Be careful with significant figures while doingmathematical and statistical operations. For example, you cannot report an average of1.0 and 1.1 as 1.05 and use it in further calculations, but you can report the average of1.00 and 1.10 as 1.05. Similarly, be careful while dividing numbers.6. Analysis of data: Calculations, graphs and graphical analysis. All graphicalanalysis have to be done using a computer software like Excel, or any other(Mathematica, Matlab, Maple, gnuplot, Tecplot, xmgrace, open office.).Graph paper can be used to see the graphs during the experiment, but anyanalysis should be performed through a proper mathematical procedure. Youhave to attach a print out of the graph with your report. If you have time, youcan go to the Computer Center labs in the top floor of the Core labs to makeyour plots and take printouts during the laboratory hours.Curve/Line fitting of a graph should not be done by hand. Use a regression scheme.Similarly, slopes and intercepts are to be obtained from least square fit of data. Inflection points are more complicated but they can also be calculated using splines andother fits to data. Most plotting software have inbuilt routines for fitting data tovarious functions.Proper plotting and analysis of graphs is actually part of a branch of mathematicscalled regression. Even if you are not fully familiar with regresion, you should at leastknow what is least square fit of data.7. Results, Questions and Discussions: The result is related to the aim of theexperiment. There are questions asked in some of the experiments and you cananswer them here. It is very important to discuss the experiment as a wholeand the results in particular. The discussion can also contain information aboutpossible sources of error and suggestions to improve the experiment. Inaddition, it may contain comparison of results to literature values. Reportingresults without any useful discussion makes the results completelymeaningless.Page: 5 of 56
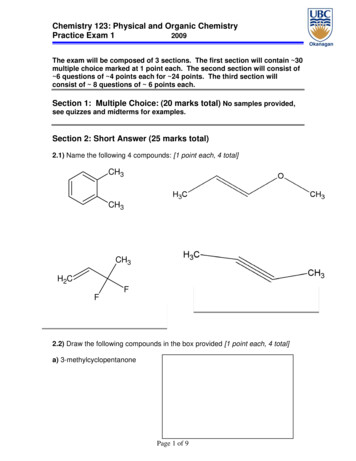
CHM 423; 2012-2013SAMPLE LABORATORY REPORTThe Theory/Principles part is brief, but clearly indicates the main guiding principlesbehind the experiment. This can only be done if you read the experiment carefullybefore you come to laboratory.Page: 6 of 56
CHM 423; 2012-2013The write-up continues onto the second page. Typically the left page is blank and theright page is ruled. The ruled page is used for material written before and after theexperiment and the blank pages are used for material written during the experiment.The experimental data is recorded on the blank page to the left of this page. I amshowing it on the next page.Page: 7 of 56
CHM 423; 2012-2013Page: 8 of 56
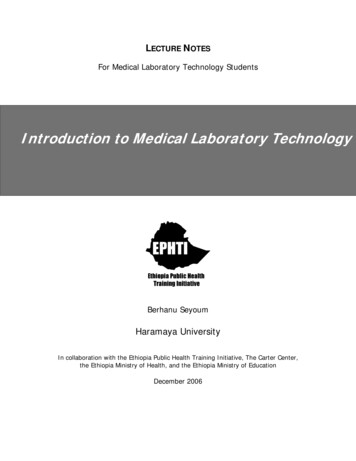
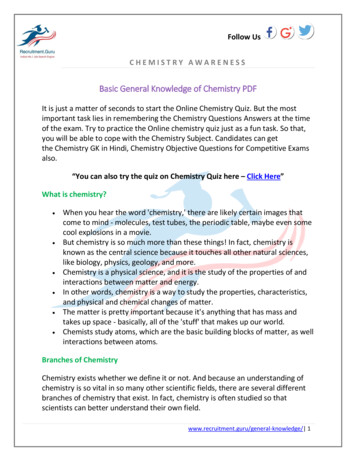
CHM 423; 2012-2013The experimental graph obtained. Ignore the poor printing. The main graph with thefitting parameters is to be noted. Note that you have to interpret the fitting parametersto the appropriate number of significant figures.Page: 9 of 56
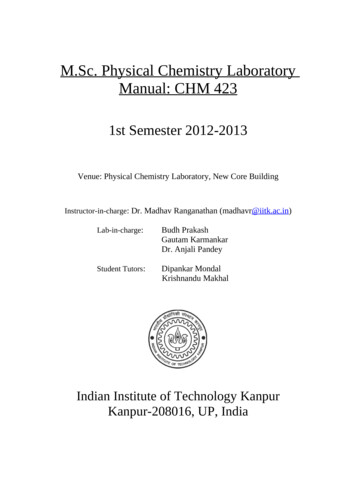
CHM 423; 2012-2013Notice the rather long discussion of the results. This is an important part of the results.Notice that I have not simply written “Sources of error” and included everythingunder the sun. You have to analyze the errors carefully each time.Page: 10 of
CHM 423; 2012-2013Laboratory conduct requirementsThe following requirements are essential in order to conduct a safe and productiveteaching laboratory:1. Use apron, covered foot wear and eye protector in the laboratory. This is must.2. It is your responsibility to bring scale, pencil, calculator, etc. everyday in thelaboratory. You may need those sometime.3. Always work honestly and confidently in the laboratory and do not consultyour neighbors.4. Always keep the apparatus and the working table clean.5. Read the experimental procedure and be aware of any dangers with any of thematerials. Unscheduled experiments should not be performed unless specificpermission is given by Instructor/In-charge.6. Do not evaporate acids or ammonium salts or inflammable solvents or handlepoisonous and obnoxious chemicals in the open laboratory. Use the nearestavailable fume cupboard.7. When heating substances in test tubes make sure that the open end is notpointed at you or anyone else.8. Do not touch any chemicals, smell gases. It is possible that different peoplemight react differently on exposure to the same chemical. Therefore, it is bestto handle them with appropriate protection.9. Do not pipette strong acids or bases or organic solvents by mouth (e.g.Chloroform, Benzene and toluene etc.).Use a rubber bulb.10. Do not drink with beakers.11. Whenever an accident occurs in the laboratory notify your Instructor/Incharge.12. Touch things with care. They may be hot.13. When diluting an acid with water always pour the acid slowly into the water.Do not pour the water into the acid.14. Read reagent bottle labels carefully before using the contents and do notchange glass stoppers of reagent bottles.15. Never use a larger amount of chemical substances than the maximumsuggested.16. When anything is spilled in the laboratory clean it up immediately by anappropriate method. Consult with your Instructor/In-charge.17. In case of any accident or anything getting into ones eyes, immediately gooutside the laboratory to the safety showers in the courtyard. Stand under theshower for 15 minutes.18. Use only match box /gas lighter /spirit lamp (not strips of paper) to light yourburner and never throw a burning match stick into the sink or waste basket.Page: 11 of
CHM 423; 2012-201319. When you have to use any chemicals or apparatus from the common store donot hurry or push others. Wait for your turn.20. Do not use filter paper for weighing or wiping or drying.21. Before you leave check the following:(a) Water taps closed?(b) Electric switches off?(c) Lab table /apparatus cleaned?(d) Chemicals /solvents bottle closed?22. All students must respect the equipment which they use. This meansunderstanding how to use it safely and correctly before starting to use it. Thisalso means that every precaution should be taken to prevent damage tolaboratory equipment. Quality equipment used to make accurate and precisemeasurements is very expensive. You are required to immediately inform theinstructor of any equipment malfunction or damage.23. The computer laboratory should only be used for work related to thelaboratory.24. All students are expected to maintain a professional attitude in the laboratory.All students must treat others in the laboratory with civility and respect. Theymust conduct themselves in a way that does not interfere with the opportunityof others to learn. This includes keeping unnecessary noise to a minimum.Also, no one is allowed to leave the laboratory without permission of theinstructor/lab-in-charge.Your conduct and safety practices in the laboratory will be graded continuouslyduring the course of each experiment, and the overall grades will be included in thefinal marks in the laboratory to be used for grading. In addition, poor behavior in thelaboratory may lead expulsion from the laboratory.Unlike what you may think, it is actually a lot of fun to practice safety and think aboutthe possible dangers lurking in each experiment. You may even come up withsuggestions for doing the experiments in more safe ways. Once this becomes a habit,it will not leave you for the rest of your life.Page: 12 of
CHM 423; 2012-2013The greatest joy of life is that of finding things out. In order toreally "find out" things, we perform carefully designedexperiments and calculations. A scientist finds beauty not just inthe results, but in the procedure of scientific enquiry itself. Thislaboratory is an opportunity to discover the beauty of science.Treat it as a process of discovery and it will be thoroughlyenjoyable experience.Page: 13 of
CHM 423; 2012-2013List of experiments1. Kinetics of Reaction between Ferrous Nitrate and Potassium Iodide usinginitial reaction rates.2. Determination of partial molal volume.3. Determination of the isotherm for a three component system.4. (a)Spectrophotometric determination of acid dissociation constant(b)Formula and stability constant using spectrophotometry.5. The measurement of electrical conductance for the determination of theequivalent conductance at infinite dilution.6. (a) Fluorescence quantum yield of an unknown molecule.(b) Fluorescence quenching and Stern-Volmer coefficient.7. (a) Rate of the hydrolysis of sucrose using polarimeter.(b) Polarizability from refractive index measurements.8. (a) Determination of pKa of poly-basic acid with the pH meter.(b) Determination of transport number by moving boundary method.9. IR and Raman spectroscopy of solvent mixtures.10. Computing Potential Energy Surface using Quantum Mechanics.Page: 14 of
CHM 423; 2012-2013Academic Calendar and Day NumbersDate31 July 201202 August 201207 August 201209 August 201214 August 201216 August 201221 August 201223 August 201228 August 201230 August 201204 September 201206 September 201211 September 201213 September 201225 September 201227 September 201204 October 201209 October 201211 October 201216 October 201218 October 201230 October 201201 November 201206 November 201208 October 201215 November sdayPage: 15 ofDay numberDAY 1DAY 2DAY 3DAY 4DAY 5DAY 6DAY 7DAY 8DAY 9DAY 10DAY 11DAY 12DAY 13DAY 14DAY 15DAY 16QUIZ 1DAY 17DAY 18DAY 19DAY 20Make-upQUIZ 2/Make-upFinal ExamFinal ExamGraded Answer scripts
CHM 423; 2012-2013Group Day-wise Experiment 413105794682G25-2711046823579Page: 16 of11,12 13,14 15,16 17,18 19,20
CHM 423; 2012-2013Experiment No. 1Kinetics of the reaction between ferric and iodide ions – use of initial ratesTheory:Ferric and iodide ions in aqueous solution react according to the stoichiometryat a measurable rate at room temperature.2Fe3 2I- 2Fe2 I2The object of the experiment is to determine the order of the reaction with respect toFe3 and I- ions.The rate of the reaction may be measured by adding a small knownconcentration of thiosulphate ions. The iodine produced from the reaction is then veryrapidly reduced back to iodine by thiosulphate ions.2S2O32- I2 2I- S4O62This continues until all the thiosulphate has been converted to tetrathionate,whereupon free iodine is formed in the solution. The color of the iodine is enhancedby the addition of starch solution. Neither of which have any appreciable effect on therate of the reaction, and noting the times for a blue color just to appear in the solution.The time interval between the start of the reaction and the change in color of thesolution is a measure of the initial rate of the reaction.At constant temperature and ionic strength, the rate equation for the reactionmay be written asmnd [ Fe 3 ]Reaction rate (1) k [ Fe 3 ] [ I ]dtwhere m is the order of reaction with respect to Fe3 and n is the order of reaction withrespect to I-. In this experiment we use initial rate method to find m and n. The basisof the method is to measure the rate of the reaction over a period which is shortenough for the reaction not to have proceeded significantly, but long enough to beunaffected by the time which the solutions take to mix at the beginning of thereaction.The total amount of thiosulphate added (x) divided by the time (t) is a measurexof the average rate over that fraction of reaction. Extrapolation of a plot oftxversus t to zero time gives a measure of the initial rate,. Now,t 0mnx k [ Fe 3 ] [ I ](2)t 0Orxlog logk m log [ Fe 3 ] n log [ I ](3)t 0 Page: 17 of
CHM 423; 2012-2013 xvs log [ Fe 3 ] at constant [I-] will yield a straight line of slopet 0xvs log [ I ] at constant [Fe3 ] will yield a straight line ofm, and a plot of logt 0slope n.Thus a plot of logThe rate constant actually depends on the ionic strength (which is given byI Ci Z 2i , where Ci is the concentration and Zi is the charge of the ith ion).Apparatus and MaterialsApparatus:Three 500 ml, two 250 ml, and one 100 ml measuring flasks; 5 ml pipette; two 50 mlburettes and standards; 10 ml microburette and stand; 250 ml conical flask, 25 mlpipette, graduated 50 ml pipette, 250 ml beaker; funnel; weighing bottle, thermometerto read room temperature; glass stirring rod; stop clock.Materials: Ferric nitrate; Potassium nitrate; Potassium iodide; Sodium thiosulphate;2N Nitric acid solution; Starch indicator.Procedure:Preparation of solutions:Prepare the following solutions, the concentrations being within 5% of thesespecified:1) 500 ml 0.017 M Ferric nitrate in 0.01 M Nitric acid2) 500 ml 0.1 M Potassium nitrate3) 500 ml 0.025 M Potassium iodide4) 250 ml 0.1 M Nitric acid5) 250 ml 0.01 M Sodium thosulphate.Set up 50 ml burettes containing the Potassium iodide solution and a microburettecontaining Sodium thiosulphate solution.Practice run:To accustom yourself to the technique, practice a run as described below.To a mixture of 10 ml of Fe(NO 3)3 solution, 10 ml of HNO3 solution, 35 ml ofKNO3 solution, 20 ml of water and about 1 ml of starch indicator in the conical flask,add rapidly 25 ml of KI solution and mix; Simultaneously start the stopclock.After no longer than 20-30 sec, add thiosulphate solution from the burette untilthe blue colour is just discharged, and then slight excess. Note the volume ofthiosulphate added and the time to the nearest second when the blue colour justreappears. Then again add thiosulpahte and repeat the same procedure about 10 timesuntil 800 sec.Order with respect to ferric:Page: 18 of
CHM 423; 2012-2013Repeat the above run and perform similar runs keeping the volumes of KIsolution, HNO3 solution, and water constant, but with 10 ml, 20 ml, 30 ml, and 40 mlof Fe(NO3)3 solution. Make the total volume 100 ml in each case by addition of theappropriate KNO3 solution.Order with respect to iodide:Repeat the above run and perform similar runs keeping the volumes ofFe(NO3)3 solution, HNO3 solution, and water constant, but with 10 ml and 50 ml ofKI solution. Make the total volume 100 ml in each case by addition of the ¼th dilutedKNO3 solution.Determine the order of the reaction with respect to Fe3 and I- ions.Page: 19 of
CHM 423; 2012-2013Experiment No.2Determination of partial molal volumeTheoryThe quantitative study of solution has been greatly advanced by theintroduction of the concept of partial molal quantities. A property of a solution, e.g.the volume of a mixture of alcohol and water, changes continuously as thecomposition is changed. A partial molal property of a component of a solution isdefined as follows. Let Y represent any extensive property of a binary solution; atconstant temperature and pressure. Then, Y will be a function of the two independentvariables n1 and n2, which represent the numbers of moles of the two componentspresent. The partial molal property of component 1 is then defined by the relation YY 1 (1) n1 n ,T,P 2Similarly for component 2, YY 2 n2 n ,T,P(2)1The usefulness of the partial molal quantities lies in the fact that it may be shownmathematically thatY n1 ,n 2 n1 Y 1 n2 Y 2 T,P constant(3)Any extensive property of the solution may be expressed in this manner in terms ofpartial molal properties, which themselves are function of the concentration of thesolution, temperature and pressure.In the case of the volume of the solution,V n 1 V 1 n2 V 2 T,P constant(4)The partial molal volumes V 1 and V 2 may be evaluated from density measurement.Lewis and Randall have given a procedure for finding the partial molal volume bydefining another quantity, the apparent molal volume with symbol φV.The apparent molal volume is defined by the relationV n 1 V 01(5)φV T,P constantn2Where, V volume of solution containing n1 moles of component 1 and n2 moles ofcomponent 2. V 01 molar volume of component 1 at given T, P.Since V n 2 φV n1 V 01 φV VV 2 φV n 2(6) n2 n ,T,P n2 n ,T,P andV 1 1 [ ]1V n 2 V 2 102 φV n1 V 1 n2n1n1 n2(7)n1 ,T,PNow the above equations can be converted in terms of the quantities which can beeasily measured in the laboratory, i.e., densities. Further if we consider 1000 g ofPage: 20 of
CHM 423; 2012-2013component 1, m1 1000/M1 and n2 m2 W2/M2 (where m1 and m2 are themolalities, M1 and M2 are the molecular weights, of solvent and solute respectively),then1000 m 2 M 21000V and n1 V 01 andρρ1φV [1 1000 ρ1 ρ M 2ρm 2 ρ1](8)where, ρ1 density of pure component 1; ρ density of solution of molality m2 ofcomponent 2 having molecular weight M2.when component 1 is water the equation 6 and 7 can be rewritten as φ VV 2 φV m 2and(9) m 2V 1 V 01 m 22 φV55 . 55 m2(10)φV can be calculated at each concentration from equation 8 by measuring the density φVof the respective solution. Plot φV vs. m2 and draw a smooth curve.can be m2calculated by drawing a tangent at any concentration. Calculate V 2 and V 1 fromequations 9 and 10. Experimental2. Clean two Pycnometers of capacity either 10 ml or 20 ml by washing themwith cleaning solution and rinsing them 5 to 6 times with distilled water. Drythem in a 1200C oven and cool them in a room temperature.3. During the time of drying and cooling, prepare mixtures (at least six) of 50 mleach, containng methanol and water in concentration varying from 0.1 to 0.9mole fraction of methanol. Keep these solutions in a thermostat.4. Find the weight of the empty Pycnometer (W0).5. Fill it with distilled water and ensure that water is filled upto the top of thecapillary. Weigh the Pycnometer and calculate the volume of the Pycnometerusing the relation VP (WW – W0 )/ρW; where WW is the weight of thePycnometer filled with water and ρW is the density of water at roomtemperature.6. Similarly weigh the Pycnometers filled with each solution and calculate thedensity of each mixture using the volume of the Pycnometer obtained in step4.Calculations:1. Calculate the molality (m2) of each solution and value of φV using the equation8.Page: 21 of
CHM 423; 2012-20132. Plot φV vs. m2, obtain smooth curve and find φVat several concentrations. m23. Calculate V 2 and V 1 at the above concentration using equations 9 and 10.Plot them against m2 and draw a smooth curve for each of two quantities.Page: 22 of
CHM 423; 2012-2013Experiment No. 3Isotherm for a three-component system: chloroform / acetic acid / waterTheory:The simplest representation of a three-component system is one in which aliquid system separates into two phases. Such a system has two domains: a domain ofperfect miscibility and another domain in which two immiscible liquid phases are inequilibrium.The Gibbs phase rule governs the equilibrium conditionsF C – P 2(1)where F is the degree of freedom, P is the number of phases and C ic the number ofcomponents. Therefore, if the two external variables (temperature and pressure) arefixed, one degree of freedom exists when two phases are present, whereas two degreeof freedom exist when there is perfect miscibility.The behavior of a ternary system at constant temperature and pressure can bepresented in a diagram with three co-ordinates.0C1001000100 BA0The composition of a ternary system may be described by one point in a triple coordinate diagram.The object of the experiment is to determine the phase diagram at roomtemperature for the chloroform/acetic acid/water system. Mixtures of these threeliquids may be homogenous or separate into two layers. The boundary, on a triangulardiagram, between the area within which the system is homogenous and the areaPage: 23 of
CHM 423; 2012-2013within which two phases coexist, is termed as the isotherm. If a mixture separates intotwo layers, the composition of the conjugate solution is given by points on theisotherm. A line joining them passes through the point representing the overallcomposition of the system.ProcedureDetermination of the isotherm:Set up burettes containing acetic acid, chloroform, and water. CAUTION:Glacial acetic acid is corrosive. Make up accurately, in the clean, dry, glass-stopperedbottles, mixtures of chloroform and acetic acid containing 1.5, 2.0, 2.5, 3.5, 6.5, 9.5,13.0 and 16.0, 18.0 ml of chloroform, the total volume of each mixture being 20 ml.Run water into each mixture, shaking well after each addition, until thehomogeneous solution becomes permanently turbid; note the volumes of water added.Note room temperature.Determination of tie-lines:Using the burettes as before, make up accurately in clean, dry, bottles twomixtures having the compositions (X) 10 ml of water, 3.5 ml of acetic acid, 6.5 ml ofchloroform, and (Y) 7 ml of water, 7.5 ml of acetic acid, 5.5 ml of chloroform, shakeeach bottle for about 30 min. and allow at least 20 min. for layers to separate.Meanwhile, prepare 250 ml of approximately 1.0 N sodium hydroxidesolution, ands standardize with weighed amounts of oxalic acid, usingphenolphthalein indicator.Then weigh accurately the four clean, dry, conical flasks and their corks.Remove about 5 ml of each of the four layers using the pipette (use separating funnelif necessary), which should be clean and dry each time, run each sample into a conicalflask and reweigh. In sampling the lower layer, gently blow through the pipette as itpasses through the upper layer so that none of this enters the pipette. Titrate the acidin each sample with the sodium hydroxide solution, using phenolphthalein indicator.From the volumes and densities of the chloroform, acetic acid and water,calculate the weight percent compositions of the ternary mixtures, and plot them onthe triangular graph paper. Draw the complete isotherm, given that at roomtemperature. A saturated solution of chloroform in water contains 0.8% CHCl 3, and asaturated solution of water in chloroform contain 99.0% CHCl3.From the titters, calculate the weight per cent of acetic acid in each layer. Thisfixes the positions on the isotherm of the ends of the tie-lines, since it is known whichlayers are chloroform-rich and which water-rich. Indicate the ends (X', X" and Y',Y"), and join them by straight lines.Density of water: 0.9947 g/cc at 300CDensity of acetic acid: 1.1491 g/cc at 300CDensity of chloroform: 1.4892 g/cc at 300CRepeat the complete experiment and plot two curves in one graph paper to show thereproducibility.Page: 24 of
CHM 423; 2012-2013Experiment No. 4 (a)Spectrophotometric determination of the acid dissociation constant of methylredTheory:In aqueous solution methyl red is a zwitterion and has a resonance structurebetween the two extreme forms shown in the following figure:The protonated red form (HMR) of methyl red exists in acid solutions. Whenbase is added, a proton is lost and the yellow anion (MR-) is formed. The basicdeprotonated form is yellow and it absorbs blue and violet light. The acid dissociationconstant, Ka, for methyl red is:[ H ] [ MR ](1)K a [ HMR ][ MR ]or,(2)pK a pH log[ HMR ]The acid dissociation constant may be calculated from measurements of theratio [MR-]/ [HMR] at known pH values. Since both these species absorb strongly inthe visible region, [MR-] / [HMR] ratio may be determined spectrophotometrically.The wavelengths where the two species have maximum absorbances, λ1 and λ2, aredetermined. The absorbance of a series of concentrations of HMR and MR - aremeasured at these wavelengths to determine if Beer-Lambert law is obeyed.Beer-Lambert law states that at the given λ,A εcl(3)where ε molar extinction coefficient of absorbing solute (ε depends on λ), l lengthof ligth path in cell 1 cm, c concentration of absorbing solute.If Beer’s law holds, absorbances of a mixture of HMR and MR- is represented by :Aλ1 εa1 l [HMR] εb1 l [MR-](4)Aλ2 εa2 l [HMR] εb2 l [MR ](5)Page: 25 of
CHM 423; 2012-2013Thus from absorbancy measurements at two different wavelengths, the concentrationsof both HMR and MR- can be calculated.Equipment and solutions1. Spectrophotometer2. pH meter3. Stock solutions of 0.01 g methyl red in 100 ml 95% C2H5OH.4. 95% C2H5OH(ethanol), 0.1 M HCl, 0.1 M NaAc, 0.01 M and 0.1 M HAc.5. 5, 10 ml, 25 ml pipettes.6. Grad
M.Sc. Physical Chemistry Laboratory Manual: CHM 423 1st Semester 2012-2013 Venue: Physical Chemistry Laboratory, New Core Building Instructor-in-charge: Dr. Madhav Ranganathan (madhavr