Transcription
LOAD FLOW STUDY IN POWER SYSTEMA THESIS SUBMITTED IN PARTIAL FULFILLMENTOF THE REQUIREMENTS FOR THE DEGREE OFBachelor of TechnologyInElectrical EngineeringBYBHABANI SANKAR HOTA (107EE007)& AMIT KUMAR MALLICK (107EE016)Department of Electrical EngineeringNational Institute of TechnologyRourkela-769008 ,2011
LOAD FLOW STUDY IN POWER SYSTEMA THESIS SUBMITTED IN PARTIAL FULFILLMENTOF THE REQUIREMENTS FOR THE DEGREE OFBachelor of TechnologyInElectrical EngineeringBYBHABANI SANKAR HOTA (107EE007)& AMIT KUMAR MALLICK (107EE016)Under the guidance ofProf. P.C.PANDADepartment of Electrical EngineeringNational Institute of TechnologyRourkela-769008 ,2011
National Institute of TechnologyRourkelaCERTIFICATEThis is to certify that the thesis entitled, “LOAD FLOWS STUDY INPOWER SYSTEM” submitted by Bhabani Sankar Hota and AmitKumar Mallick in partial fulfilments for the requirements for theaward of Bachelor of Technology Degree in Electrical Engineering atNational Institute of Technology, Rourkela is an authentic workcarried out by them under my supervision and guidance.To the best of my knowledge, the matter embodied in the thesis hasnot been submitted to any other University / Institute for the awardof any Degree or Diploma.Date: 09.04.2011Place: RourkelaProf. P.C.PandaDeptt. of Electrical EngineeringNational Institute of TechnologyRourkela
ACKNOWLEDGEMENTI would like to express my deepest sense of gratitude towards mysupervisor, Prof. P.C.Panda who has given me much suggestion,guidance and support.I would like to thank all the staff members of Department ofElectrical Engineering for their extended cooperation and guidance.Ialso take this opportunity to give thanks to all others who havegiven me support for the project or in other aspects of my study atNational Institute of Technology.Bhabani Sankar Hota107ee007Amit Kumar Mallick107ee016Date: 09.05.2011Place: Rourkela
LOAD FLOW STUDY IN POWER SYSTEMAbstractThis paper presents a brief idea on load flow in power system, busclassification ,improving stability of power system ,flexible ac system, variouscontrollers of FACTs and advantages of using TCSC in series compensation .Itpresents the modeling scheme of TCSC and the advantages of using it in powerflow network. The plots obtained after simulation of network using matlabboth with and without TCSC gives fair idea of advantages on use of reactivepower compensators.
CONTENTSITEMS1CHAPTER 1CHAPTER IITITLELIST OF FIGURES4INTRODUCTION TO LOAD FLOWS61.1Introduction71.2Objectives of load flow81.3Bus classification9INTRODUCTION TO FACTS102.1Flexible AC transmission112.2FACTS System-controller12 2.3CHAPTER IIIPAGE NO.SVCNGH-SSR damperStatcon(static condenser)Phase Angle RegulatorUnified powercontrolDynamic BrakeVAR13PRINCIPLES OF REACTIVE POWERCOMPENSATION3.1Reactive power153.23.33.4Shunt compensationSeries compensationvarious VAR generators1617172 P a g e
3.5 Advantages of TCR in FACT193.6 Characteristics of TCR193.7 Thyristor controlled SeriesCompensatorCHAPTER IVAC TRANSMISSION AND STABILITY CONCEPT19224.1 Understanding AC transmission234.2 Stability concept244.3 Swing equation284.4 Comparision of solution methods30CHAPTER VNEWTON –RAPHSON COMPUTER PROGRAMCHAPTER VITHYRISTOR CONTROLLED SERIES32CAPACITOR MODELLING SCHEME447CONCLUSION558BIBLIOGRAPHY563 P a g e
LIST OF FIGURESPAGE NOFIGURE1.1A power distribution system73.1TCSC confurigation203.2Single machine infinite busPower system with TCSC203.3TCSC at a sub station214.1Supply and transmission of power234.2Real power flow234.3First swing analysis for a stable case264.4First swing analysis for a unstable case274.5Practical example showing system stability305.15 bus network problem statement (without TCSC)325.2Fault at bus 1, line removed 12395.3Fault at bus 2 line removed 23405.4Fault at bus 2 line removed 25405.5Fault at bus 3 line removed 13415.6Fault at bus 3 line removed 34415.7Fault at bus 4 line removed 45425.8Fault at bus 4 line removed 24425.9Fault at bus 5 line removed 25434 P a g e
6.1TCSC model for stability studies466.2The transfer function of stability control loop476.3Bus network problem statement with TCSC486.4when fault at bus 1, lineremoved 12 (with and without TCSC)516.5when fault at bus 2 ,line removed 23516.6when fault at bus 2 ,line removed 25526.7when fault at bus 3 ,line removed 13526.8when fault at bus 3 line removed 34(without tcsc) and 36 (with tcsc)536.9when Fault at bus 4 line removed 45536.10when Fault at bus 4 line removed 24546.11whenFault at bus 5 line removed 25545 P a g e
CHAPTER IINTRODUCTION TO LOADFLOWS6 P a ge
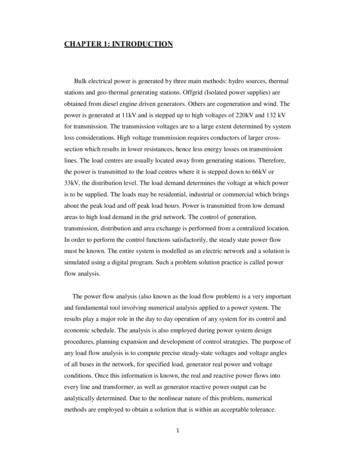
1.1 INTRODUCTIONIn a three phase ac power system active and reactive power flows from the generatingstation to the load through different networks buses and branches. The flow of active andreactive power is called power flow or load flow. Power flow studies provide asystematicmathematical approach for determination of various bus voltages, there phase angle activeand reactive power flows through different branches, generators and loads under steadystate condition. Power flow analysis is used to determine the steady state operatingcondition of a power system. Power flow analysis is widely used by power distributionprofessional during the planning and operation of power distribution system.Fig 1.1There three methods for load flow studies mainly#Gauss siedel method# Newton raphson method# Fast decoupled method.7 Page
1.2 OBJECTIVE OF LOAD FLOW STUDY Power flow analysis is very important in planning stages of new networks oraddition to existing ones like adding new generator sites, meeting increase loaddemand and locating new transmission sites.The load flow solution gives the nodal voltages and phase angles and hence thepower injection at all the buses and power flows through interconnecting powerchannels.It is helpful in determining the best location as well as optimal capacity of proposedgenerating station, substation and new lines.It determines the voltage of the buses. The voltage level at the certain buses must bekept within the closed tolerances.System transmission loss minimizes.Economic system operation with respect to fuel cost to generate all the powerneededThe line flows can be known. The line should not be overloaded, it means, we shouldnot operate the close to their stability or thermal limits.1.3 BUS CLASSIFICATIONA bus is a node at which one or many lines, one or many loads and generators areconnected. In a power system each node or bus is associated with 4 quantities, such asmagnitude of voltage, phage angle of voltage, active or true power and reactive power inload flow problem two out of these 4 quantities are specified and remaining 2 are requiredto be determined through the solution of equation. Depending on the quantities that havebeen specified, the buses are classified into 3 categories.8 P a g e
VARIABLES AND BUS CLASSIFICATIONBuses are classified according to which two out of the four variables are specified Load bus: No generator is connected to the bus. At this bus the real and reactivepower are specified.it is desired to find out the volatage magnitude and phase anglethrough load flow solutions.It is required to specify only Pd and Qd at such bus as ata load bus voltage can be allowed to vary within the permissible values. Generator bus or voltage controlled bus: Here the voltage magnitudecorresponding to the generator voltage and real power Pg corresponds to its ratingare specified.It is required to find out the reactive power generation Qg and phaseangle of the bus voltage. Slack (swing) bus: For the Slack Bus, it is assumed that the voltage magnitude V and voltage phase Θ are known,whereas real and reactive powers Pg and Qg areobtained through the load flow solution.9 Page
CHAPTER IIINTRODUCTION TO FACTS10 P a g e
2.1 FLEXIBLE AC TRANSMISSIONFlexible transmission system is akin to high voltage dc and related thyristors developeddesigned to overcome the limitations of the present mechanically controlled ac powertransmission system.Use of high speed power electronics controllers, gives 5 oppertunities for increasedefficiency. Greater control of power so that it flows in the prescribed transmission routes.Secure loading (but not overloading) of transmission lines to levels nearer theirrequired limits.Greater ability to transfer power between controlled areas, so that the generatorreserve margin- typically 18 % may be reduced to 15 % or less.Prevention of cascading outages by limiting the effects of faults and equipmentfailure.Damping of power system oscillations,which could damage equipment and or limitusable transmission capacity.Flexible system requires tighter transmission control and efficient management of interrelated parameters that constrains today’s system including – Series impedance- phase angle.Shunt impedance- occurrence of oscillations at various frequencies below ratedfrequency. This results in transmission line to operate near its thermal rating. Eg- a 1000kv line mayhave loading limit 3000-4000Mw .but the thermal limit may be 5000Mw.11 P a g e
2.2 FACTS SYSTEM CONTROLLERTYPESNGH- SSR DamperATTRIBUTESDamping of oscillation,series impedancecontrol, transient stabilitySVC-static var-compensatorVoltage control,var-compensation dampingof oscillationTCSC-Thyristor controlled series cecontrol,dampingofoscillations,transient stabilityVoltage control,var-compensator dampingof oscillations,transient or,dampingofoscillation,transient stability.Damping of oscillation,transient stability.Static-condensorThyristor controlled phase angle regulatorThyristor controlled dynamic brake SVC- Uses thyristor valves to rapidly add or remove shunt connected reactors andor capacitors often in coordination with mechanically controlled reactors and/orcapacitors.NGH-SSR damper- a resonance damper:- A thyristor ac-switch connected inseries with a small inductor and resistor across the series capacitor. Statcon(static condenser):- A 3 phase inverter that is driven from voltage across adc storage capacitor and whose there output voltages are in phase with the acsystem voltage.when the output voltages are higher or lower than the ac systemvoltage the current flow is caused to lead or lag and difference in voltage amplitudesdetermine how much current flows.Reactive power and its polarity can becontrolled by controlling voltage. Phase Angle Regulator:-The phase shift is accomplished by adding orsubtracting a variable voltage concept that is perpendicular to the phase voltage ofthe line12 P a g e
Unified powercontrol :- In this concept an ac voltage vector generated by athyristor based inverter is injected in series with phase voltage.The driving dcvoltage for inverter is obtained by rectifying the ac to dc from the same transmissionline. In such an arrangement the injected voltage may have any phase anglerelationship to the phase voltage. It is possible to obtain a net phase and amplitudevoltage change that confers control of both active and reactive power.Dynamic Brake :- A shunt connected resistive load, controlled by thyristorswitches. such a load can be selectively applied in each pass, half cycle by half cycleto damp any specific power flow oscillation, so that generating unit run less risk oflosing synchronism ,as a result morecan be transferred over systems subjectedto stability constraints.A thyristor controlled resistor in parallel with the transmission line can be used effectivelyto damp power swing oscillations in the transmission system.FACT technology ensures power flow through prescribed routes, maximization of capacity,securing loading capacity enhancement under various scenanious of uprating or upgradingthe lines thermal current capacity.One of the important function of FACT is VAR compensation .2.3 VAR-compensation is defined as the management of reactive power to improve theperformance of ac power systems;maximizing stability by increasing flow of active power.Problems forced while reactive power compensation :1. Load compensation2. Voltage support.Load compensation objectives are to increase the value of the system power factor tobalance the real power drawn from the ac supply,compensate voltage regulation and toeliminate current harmonic components produced by large and fluctuating non –linearindustries loads.Voltage support objectives:- Its generally required to reduced voltage fluctuations at agiven terminal of a transmission line.Var compensation helps to maintain a substantially flat voltage profile at all levels of powertransmission improves HVDC conversion terminal performance increases transmissionefficiency ,controls steady state and temporary over-voltage and can avoid disastrousblackout.13 P a g e
Series and shunt VAR compensation are used to modify the natural electrical characteristicof ac power system.series compensation modifies the transmission or distribution systemparameters while shunt compensation changes the equivalent impedance of the load.Earlier ,rotating synchronous condensers and fixed or mechanically switched capacitors n.Now a days static VAR compensators employing thyristor switched capacitors andthyristor controlled reactor to provide or absorb the required reactive power have beendeveloped. Use of selfcommutated pwm convertors with appropriate control schemepermits the implementation of static compensators capable of generating or absorbingreactive current components with faster time response.14 P a g e
CHAPTER IIIPRINCIPLES OF REACTIVEPOWER COMPENSATION15 P a g e
3.1 REACTIVE POWERPower factor is defined as the ratio of real power to apparent power. This definition isoften mathematically represented as Kw/Kva ,where the numerator is the active (real)power and the denominator is the (active reactive) or the apparent powerPower Factor Active power/Apparent power kW/kVA Active power/ (Active Power Reactive Power) kW/(kW kVAr)The higher kVAr indicates low power factor and vice versa.HOW TO IMPROVE POWER FACTORPower factor can be improved by adding consumers of reactive power in the system likeCapacitors or Synchronous Motors.It can also be improved by fully loading induction motors and transformers and also byusing higher rpm machines. Usage of automatic tap changing system in transformers canalso help to maintain better power factor.PRINCIPLES OF REACTIVE POWER COMPENSATIONIn a linear circuit the reactive power is defined as the ac- component of the instantaneouspower with a frequency equal to 100hz in 50hz system ( 120 hz in 60 hz system).Thereactive power generated by the ac power source is stored in a capacitor or a reactorduring a quarter cycle and in the next quarter cycle is sent back to the power source. Egreactive power oscillates between ac source and the capacitor or reactor.3.2 SHUNT COMPENSATION: By supplying reactive power near load, tension on lines ,power losses minimizes and hence improving voltage regulation.This can be achived in three ways:(a) With a capacitor(b)Voltage source(c) Current source16 P a g e
3.3 SERIES COMPENSATION:Here capacitors are used to decrease the equivalent reactance of a power line at a ratedfrequency.Using capacitors results improved functionality through:(a)increased angular stability of power corridor(b)improved voltage stability(c)optimized power sharing between parallel circuits3.4 Following section gives information about various VAR generators:1. Fixed mechanically coupled switched capacitors:Leading current drawn by shunt capacitors compensate the lagging current drawnby load. Due to varying load the capacitor bank may lead to over or undercompensation. For this variable VAR, compensation is achieved by using switchedcapacitors. This is done through C.B’s and relays.Disadvantage : Sluggish nature, unreliable,high inrush current, frequentmaintainance2. Synchronous Condensors:It is simply a synchronous machine connected to a power system. After the unit issynchronized, he field current is adjusted either to absorb reactive power asrequired by the ac system . Though they have a high temporary overload capacity totheir advantage,Nowadays they are uneconomical owing to their cost and sluggish behavior torapid load changes.3. Thyristorized VAR compensators:With thyristorized compensators finner control over entire VAR range could beachived with faster response. They can be grouped under two categories:(a)Thyristor switched capacitors: The basic structure consists of a shuntcapacitor which is split up into approximately small steps, which are individuallyswitched in and out using a by directional thyristor switches. Each single phasebranch consist of :capacitor thyristor switches, inductor to limit the the rise ofcurrent.Tsc has following properties : stepwise control, average delay of one half ofa cycle no generation of harmonics since current transients component can beattenuated.17 Page
Disadvantage : VAR compensation not continuous, each capacitor bank requiresseparate thyristor switches.(b)Thyristor controlled reactor: static compensators of tcr type are characterizedby the ability to perform continuous control, maximum delay of one half cycle andpractically no transients.Principal disadvantage being generation of low frequency harmonic currentcomponent and higher losses when working in inductive region (eg absorbingreactive power). However the harmonics can be eliminated using filters.(c)Combined TCR and TCS: These are charectrized by continuous control,practically no transients, low generation of harmonics and flexibility in control andoperation.(d)Thyristor controlled series compensation: It’s effective in controlling subsynchronous resonance which mainly occus because of interaction between largethermal generating units and series compensated transmission system.4. Self commutated VAR compensators: Their greatest advantage is drastic reduction in size, reduction of cost (because ofelimination of large no of passive elements)and lower relative capacity requirement of semi conductor switches. It’s well suitedfor application where space is premium. More sophisticated self commutated VARcompensators are:(i) Multilevel compensators(ii)Multilevel compensators with carrier shifted(iii)Optimized multilevel compensators5. New VAR compensator technology:(i)Static synchronous compensators (STATCOM)(ii)Static synchronous series compensators(iii)Dynamic voltage restorer(iv)Unified power flow controller(v)Interline power flow controller(vi)Superconducting magnetic energy storage(vii)VAR generation using coupling transformer18 P a g e
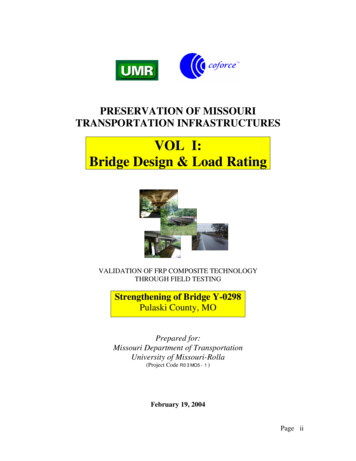
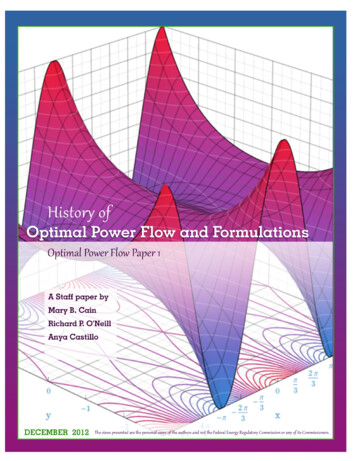
3.5 Advantages of TCR in FACT1. Accuracy of compensation-Very good2. Control flexibility-Very good3. Reactive power capacity- Lagging or leading indirect4. Control – Continuous5. Response Time- Fast, 0.5 to 0.2 cycles6. Harmonics- Very high(Large size filters are needed)7. Losses- Good but increase in lagging mode8. Phase balancing ability- good9. Cost-moderate3.6 CHARACTERISTICS OF TCR:Tcr can be used as a better series compensator which is effective in load flowcontrol and short circuit limitations . It’s because of Tcr advantages another anotherconcept of Advanced Series Compensation of Tcr has been developed andcommercialized.Tcr consists of a fixed (mainly air core) reactor of inductance L anda bidirectional thyristor value. The current in the reactor can be from maximum(thyristor valve closed) to zero (thyristor valve open) by method of firing delay anglecontrol.It means that the closure of thyristor value is delayed wrt the peak ofapplied voltage in each half cycle and thus the duration of current condutionintervals is controlled.A voltage ‘v’ is applied and ther eactor current is given by𝑖𝑙 (𝛼) ,at zero angle delay (switch fully closed)and at an arbitrary angle ‘𝛼’ delayangle.3.7 THYRISTOR CONTROLLED SERIES COMPENSATOR (TCSC)TCSC is one of the most important and best known FACTS devices, which has beenin use for many years to increase line power transfer as well as to enhance systemstability. The TCSC consists of three main components: capacitor bank C, bypassinductor L and bidirectional thyristors SCR1 and SCR2. The firing angles of thethyristors are controlled to adjust the TCSC reactance in accordance with a systemcontrol algorithm, normally in response to some system parameter variations. Whenthe thyristors are fired, the TCSC can be mathematically described as follows:19 P a g e
Fig3.1:TCSC CONFURIGATIONwhere iC and iL are the instantaneous values of the currents in the capacitor banks andinductor, respectively; iS the instantaneous current of the controlled transmission line; v isthe instantaneous voltage across the TCSC.Fig3.2 : SINGLE MACHINE INFINITE BUS POWER SYSTEM WITHTCSC20 P a g e
Thyristor Controlled Series Compensator (TCSC)Fig 3.3: TCSC at a sub station21 P a g e
CHAPTER IVAC TRANSMISSIONAND STABILITYCONCEPT22 P a g e
4.1 UNDERSTANDING AC TRANSMISSIONFig 4.1 Real power flowFig 4.2 Real power flowReal power flow: δ1 δ2 P12 is ve: Real power flows from Area-1 to Area-2 δ1 δ2 P12 is -ve: Real power flows from Area-2 to Area-1Reactive power flow: V1 V2 : Reactive power flows from Area-1 to Area-2 V1 V2 : Reactive power flows from Area-2 to Area-123 P a g e
4.2 STABILITY CONCEPTOverviewThe importance of power system stability is increasingly becoming one of the most limitingfactors for system performance. By the stability of a power system, we actually mean theability of the system to remain in operating equilibrium, or synchronism, whiledisturbances occur on the system. There are three types of stability, namely, steady-state,dynamic and transient stability.Stability DefinitionsIn the study of electric power systems, several different types of stability descriptions areencountered. There are three types of stability namely,(1) Steady-state stability –It refers to the stability of a power system subject to small andgradual changes in load, and the system remains stable with conventional excitation andgovernor controls.(2) Dynamic stability –It refers to the stability of a power system subject to a relativelysmall and sudden disturbance, the system can be described by linear differential equations,and the system can be stabilized by a linear and continuous supplementary stabilitycontrol.(3) Transient stability –It refers to the stability of a power system subject to a sudden andsevere disturbance beyond the capability of the linear and continuous supplementarystability control, and the system may lose its stability at the first swing unless a moreeffective countermeasure is taken, usually of the discrete type, such as dynamic resistancebraking or fast valving for the electric energy surplus area, or load shedding for the electricenergy deficient area. For transient stability analysis and control design, the power systemmust be described by nonlinear differential equations. Transient stability concerns with thematter of maintaining synchronism among all generators when the power system issuddenly subjected to severe disturbances such as faults or circuits caused by lightningstrikes, the sudden removal from the transmission system of a generator and/or a line, andany severe shock to the system due to a switching operation. Because of the severity and24 P a g e
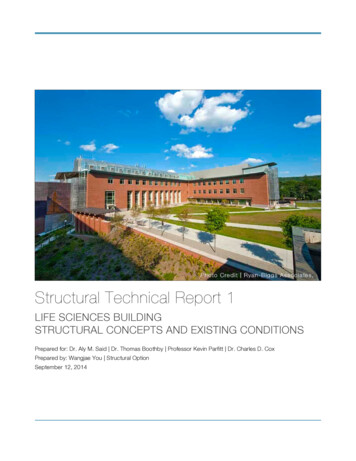
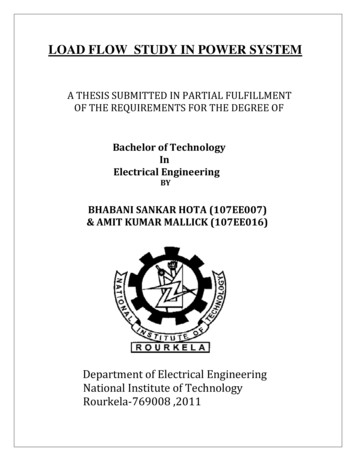
suddenness of the disturbance, the analysis of transient stability is focused on the first fewseconds, or even the first few cycles, following the fault occurrence or switching operation.First swing analysis is another name that is applied to transient stability studies, sinceduring the brief period following a severe disturbance the generator undergoes its firsttransient overshoot, or swing. If the generator can get through it without losingsynchronism, it is said to be transient stable. On the other hand, if the generator loses itssynchronism and can not get through the first swing, it is said to be unstable. There is acritical angle within which the fault must be cleared if the system is to remain stable. Theequal-area criterion is needed and can be used to understand the power system stability.some simple figures can be utilized to graphically represent the difference between a stablecase and an unstable case. In a stable case, as shown in Figure below ,if the fault is clearedat tc1 second, or at anglewhere the area Aa (area associated with acceleration of thegenerator) equals the area Ad (area associated with deceleration of the generator). Onecan see that the angle reaches its maximumatand never gets greater than thisvalue. In the unstable case, as shown in Figure, the fault is cleared atsecond with thearea Aa greater than the area Ad. Also, it is very clear that for an unstable case, with thefault cleared atthe angle keeps increasing and goes out-of-step, or unstable, as shownin Figure below.25 P a g e
Fig 4.3: First swing analysis for a stable case26 P a g e
Fig 4.4: First swing analysis for a unstable case27 P a g e
4.3 SWING EQUATIONThe moment of inertia and the accelerating torque of a synchronous machine can berelated as follows𝐽𝑑2 𝛿𝑚𝑑𝑡2 𝑇𝑎Where J moment of inertia𝛿𝑚 mechanical angleAnd 𝑇𝑎 𝑇𝑀 𝑇𝑒 accelerating torque the difference mechanical torque andelectromagnetic torque.The relationship between the mechanical angle and the electrical angle can be expressedas𝛿 𝑝𝛿𝑚 /2Where p is the number of poles of the machine.Then the equation of accelerating torque can be written as𝑑 2𝛿𝐽. 2. 𝑝𝑑𝑡 2 𝜔𝑠. 𝑇𝑎 𝑃𝑎A commonly used constant,inertia constant H,is defined as the ratio between the storedenergy in watt-seconds and VA rating of the machine ,namely1H 2 𝐽𝜔𝑠. /𝑆It can be re-arranged as2H𝑆 𝐽𝜔𝑠.28 P a g e
One can relate this equation to the equation for the accelerating power 𝑃𝑎𝐻2𝜔 𝑆. 2.𝑠.𝑑2 𝛿𝑝𝑑𝑡2 𝑃𝑎If one defines𝜔0 𝑃𝜔𝑠. /2Then the above equation can be expressed as𝐻𝑑2 𝛿0𝑑𝑡22𝜔 . 𝑃𝑎 /𝑆Where allthe quantities are in their actual values.Finally, the swing equation with the accelerating power in per unit value can be obtained asfollows𝐻𝑑2 𝛿0𝑑𝑡22𝜔 . 𝑃𝑎 ,orM𝑑2 𝛿𝑑𝑡2 𝑃𝑎 ,Where M is the angular momentum𝐻And M 2𝜔 H/60π0For the frequency of 60 hertz.29 P a g e
Fig 4.5:Practical example showing system stability4.4 COMPARISION OF SOLUTION METHODS- The time taken to perform one iteration of the computation is relativelysmaller in case of G-S method as compared to N-R method The number of iterations required by G-S method for a particular system isgreater as compared to N-R method and they increase with the increase inthe size of the system. In case of N-R method the number of iterations is moreor less independent of the size of the system and vary between 3 to 5iterations.The convergence characteristics of N-R method are not affected by theselection of a slack bus whereas that of G-S method is sometimes veryseriously affected and the selection of a particular bus may result in poorconvergence. 30 P a g e
CHAPTER VNEWTON RAPHSONCOMPUTER PROGRAM FORLOAD FLOW ANALYSIS31 P a g e
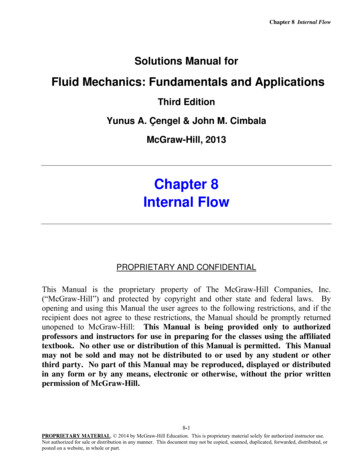
Newton–Raphson method for power flow analysis :Problem statement:The following 5 bus network was taken from G.W.Stagg & A.H.El-Abiad,computermethods in power system analysis,1968 McGraw Hill.Fig 5.1: 5 bus network problem statement North – bus 1 South – bus 2 Lake – bus 3 main – bus 4 elm - bus 532 P a g e
Steps to write the matlab program and analyze the data using matlab:The sequence of steps for solution of load flow problem using N-R method are explained asfollows:Step1: Assume a suitable solution for all buses except slack bus. Assume 𝑉𝑃 1 j0.0 for p 1,2 .n, p s, 𝑉𝑠 a j0.0Step 2: Convergence criterion is set to that means if the largest of absolute of theresidues exceed the process repeated else terminated.Step 3: iteration count is set to K 0Step4: Bus count is set to p 1Step 5: Say p is slack bus .if yes skip to step 10Step 6: real and reactive powers 𝑃𝑝 𝑎𝑛𝑑 𝑄𝑝 are calculated respectively using equations𝑃𝑝 𝑄𝑝 𝑛𝑞 1𝑛𝑞 1𝑒𝑝 𝑒𝑞 𝐺𝑝𝑞 𝑓𝑝 𝐵𝑝𝑞 𝑓𝑝 (𝑓𝑞 𝐺𝑝𝑞 𝑒𝑞 𝐵𝑝𝑞 )𝑓𝑝 𝑒𝑞 𝐺𝑝𝑞 𝑓𝑞 𝐵𝑝𝑞 𝑒𝑝 (𝑓𝑞 𝐺𝑝𝑞 𝑒𝑞 𝐵𝑝𝑞 )Step 7: Calculate 𝑃𝑝𝑘 𝑃𝑠𝑝 𝑃𝑝𝑘 .step 8: Check for bus to be generator bus.if yes compare the reactive power 𝑄𝑝𝑘 with theupper and lower limits.if 𝑄𝑔𝑒𝑛 𝑄𝑚𝑎𝑥 set , 𝑄𝑔𝑒𝑛 𝑄𝑚𝑎𝑥else if 𝑄𝑔𝑒𝑛 𝑄𝑚𝑖𝑛set, 𝑄𝑔𝑒𝑛 𝑄𝑚𝑖𝑛else if the value is within the limit ,the value is retained. If the limits are not violated,voltage residue is evaluated as 𝑉𝑝 2 𝑉𝑝 2 𝑠𝑝𝑒𝑐 - 𝑉𝑝𝑘2and then goto step 10.Step 9: 𝑄𝑝𝑘 𝑄𝑠𝑝 𝑄𝑝𝑘 is evaluated33 P a g e
Step 10: bus count is incremented by 1,i.e p p 1 and check if all buses have beenaccounted else,go to step 5.Step 11: Determine the largest of the absolute value of residue.Step 12: If the largest of the absolute value of the residue is less than then go to step 17Step 13: jacobian matrix elements are evaluated.Step 14: voltage increments 𝑒𝑝𝑘 and 𝑓𝑝𝑘 are calculatedStep 15: calculate new bus voltages 𝑒𝑝𝑘 1 𝑒𝑝𝑘 𝑒𝑝𝑘 and 𝑓𝑝𝑘 𝑓𝑝𝑘 𝑓𝑝𝑘 . Evaluate cos 𝛿and sin 𝛿 for all voltages.Step 16: Advance iteration count is K K 1,then go to step 4Step 17: Finally bus and line powers are evaluated and results printed.ENDFor the given problem statement of 5 bus network the data are as follows:DATA ENTRYnbb 5 ;bustype(1) 1 ; VM(1) 1.06 ; VA(1) 0 ;bustype(2) 2 ; VM(2) 1 ; VA(2) 0 ;bustype(3) 3 ; VM(3) 1 ; VA(3) 0 ;bustype(4) 3 ; VM(4) 1 ; VA(4) 0 ;bustype(5) 3 ; VM(5) 1 ; VA(5) 0 ;Generator datangn number of generatorsgenbus generator bus numberPGEN scheduled active power contributed by the generatorQGEN scheduled reactive power contributed by the generatorQMAX generator reactive power upper limitQMIN generator reactive power lower limitngn 2 ;34 P a g e
genbus(1) 1 ; PGEN(1) 0 ; QGEN(1) 0 ; QMAX(1) 5 ; QMIN(1) -5 ;genbus(2) 2 ; PGEN(2) 0.4 ; QGEN(2) 0 ; QMAX(2) 3 ; QMIN
state condition. Power flow analysis is used to determine the steady state operating condition of a power system. Power flow analysis is widely used by power distribution professional during the planning and operation of power distribution system. Fig 1.1 There three methods for