Transcription
PRESERVATION OF MISSOURITRANSPORTATION INFRASTRUCTURESVOL I:Bridge Design & Load RatingVALIDATION OF FRP COMPOSITE TECHNOLOGYTHROUGH FIELD TESTINGStrengthening of Bridge Y-0298Pulaski County, MOPrepared for:Missouri Department of TransportationUniversity of Missouri-Rolla(Project Code R03MO5-1)February 19, 2004Page ii
TABLE OF CONTENTSA.INTRODUCTION. 1A.1 GENERAL DESCRIPTION . 1A.2 OBJECTIVES . 2A.3 ASSUMPTIONS . 3B.STRUCTURAL ANALYSIS. 4B.1 LOAD COMBINATIONS . 4B.2 DESIGN TRUCK AND LOAD LANES . 5B.3 SLAB ANALYSIS . 6B.3.1 Bridge Analysis . 7B.3.1.1 Dead Load Analysis . 7B.3.1.2 Live Load Analysis. 7B.3.1.2.1 Design Truck Load Analysis (HS20-44) . 7B.3.1.2.2 Load Lane Analysis. 8B.3.2 Summary of Results . 9C.DESIGN . 10C.1 ASSUMPTIONS . 10C.2 SLAB DESIGN . 11C.2.1 Assumptions . 11C.2.2 Positive Moment Strengthening . 11C.2.3 Negative Moment Check. 12C.2.4 Shear Check. 12D.MF-FRP DESIGN . 13D.1 ASSUMPTIONS . 13D.2 STRENGTHENING DESIGN. 16D.2.1 Load Analysis . 16D.2.2 Geometrical Assumptions . 18D.2.3 Flexural Strengthening. 18E.LOAD RATING . 21REFERENCES. 24Page iii
LIST OF TABLESTable 1 – Slab Bending Moments and Shear Forces per Unit Strip . 9Table 2 – Material Properties. 10Table 3 – Slab Geometrical Properties and Internal Steel Reinforcement . 11Table 4 – Slab Positive Moment Capacity. 11Table 5 – Slab Shear Capacity . 13Table 6 – Material Properties. 14Table 7 – Parameters of the Design Section for the MF-FRP Strengthening. 18Table 8 – Strengthening Summary . 19Table 9 - Maximum Shear and Moment due to Live Load. 22Table 10 - Rating Factor for the Slab Strengthened with CFRP Laminates (BendingMoment). 22Table 11 - Rating Factor for the Slab Strengthened with MF-FRP (Bending Moment) . 22Table 12 - Rating Factor for the Slab (Shear). 23LIST OF FIGURESFigure 1 – Bridge Y-0298 . 1Figure 2 – Superstructure of the Bridge. 1Figure 3 – Plan View of the Bridge . 4Figure 4 – Truck Load and Truck Lanes . 5Figure 5 – Loading Conditions . 6Figure 6 – Loading Conditions for Slab Analysis . 6Figure 7 – Design Truck Load Analysis . 7Figure 8 – Load Lane Analysis. 8Figure 9 – Slab Internal Reinforcement. 11Figure 10 – Strengthening of the Slab Deck. 12Figure 11 – Evaluation of Moment at a Section where V is max . 13Figure 12 – Details of the Connection Concrete-FRP . 15Figure 13 – Slab Load Condition. 17Figure 14 – Slab Longitudinal Bending Moment Distribution for One Span of the Bridge. 18Figure 15 – MF-FRP Strengthening of the Deck. 19Figure 16 – Pattern of the Bolts . 20Page iv
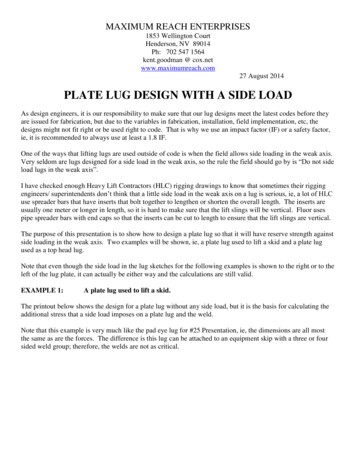
A. INTRODUCTIONA.1 General DescriptionIn the following report, the analysis and design procedures used in the upgrade of theload-posted Bridge Y-0298, located in Pulaski County, MO are summarized. Figure 1shows a picture of the bridge. The total bridge length is 30 ft and the total width of thedeck is 24.0 ft.Figure 1 – Bridge Y-0298The structure has two spans each of which consists of a solid reinforced concrete slab7 in. thick as depicted in Figure 2. Each span is considered simply supported on reinforced concrete vertical walls. Both spans are 15.0 ft long.Figure 2 – Superstructure of the BridgeAn inspection of this bridge revealed major concrete deterioration on the underside ofthe slab which would prevent the application of any bonded strengthening system insome areas. Due to the high cost of repairing the concrete, a system consisting of mechanically-fastened (MF) FRP laminates was used to strengthen these areas. The analysisand design of this system are presented in this report.Page 1
A.2 ObjectivesThe objective of this document is to provide an analysis of the structure and the design calculations for its strengthening using externally bonded fiber-reinforced polymer(FRP) systems. The FRP systems consist of FRP laminates to be installed by manual layup and pre-cured FRP laminates which are mechanically fastened.Page 2
A.3 AssumptionsThe following assumptions are made:a) Nominal material properties for steel and concrete. At the onset of the project, existing material properties were validated in the field by extracting two concrete coresand steel bar sample. The resulting values are: f c 4,000 psi, and fy 40 ksi.b) Load configurations and analysis are consistent with AASHTO1 Specifications; andc) Design of the strengthening system is in compliance with ACI 440.2R-022 where applicable.Contrary to all other bridges considered for this project, blue prints for this structurewere not available from MoDOT.Page 3
B. STRUCTURAL ANALYSISB.1 Load Combinations10 L'-6"10'L 6"Figure 3 shows a sketch of the bridge.15'-0"15'-0"Figure 3 – Plan View of the BridgeUltimate values of bending moment and shear force are obtained by multiplying theirnominal values by the dead and live load factors and by the impact factor according toAASHTO Specifications as shown in Eq. (1):ωu 1.3[ β d D 1.67( L I ) ](1)where D is the dead load, L is the live load, βd 1.0 as per AASHTO Table 3.22.1A, and Iis the live load impact calculated as follows:I 50 30%L 125(2)Page 4
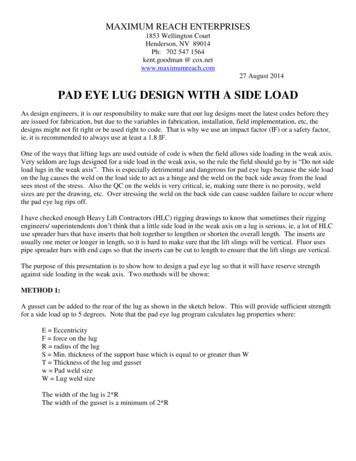
and L 10.5 ft represents the span length from center-to-center of support. The impactfactor can be assumed equal to 1.30 for both spans. It is to be noted that because of the45 degree skew of the bridge, the effective center-to-center length of the span can be expressed as L·cosα 15(cos45 ) 10.5 ft.B.2 Design Truck and Load LanesThe analysis of the bridge is carried out for an HS20-44 truck load (which representsthe AASHTO design truck load) having geometrical characteristics and weight propertiesas shown in Figure 4. There is no need to consider the 3S2 truck load for this bridge,since it will never govern the design.According to AASHTO Section 3.6.3, roadway widths between 20.0 and 24.0 ft shallhave two design lanes, each equal to one-half of the roadway width. However, the number of design lanes will not affect the design since the unit-strip method will be used.Two loading conditions are therefore required to be checked as laid out in Figure 5.The HS20-44 design truck load (Figure 5a) has a front axle load of 8.0 kip, secondaxle load, located 14.0 ft behind the drive axle, of 32.0 kip, and rear axle load also of 32.0kip. The rear axle load is positioned at a variable distance, ranging between 14.0 and 30.0ft. Given the specific bridge geometry, the worst loading scenario is obtained for theminimum spacing of 14.0 ft between the two rear axles.The load lane condition consists of a load of 640 lb per linear foot, uniformly distributed in the longitudinal direction with a single concentrated load so placed on the span asto produce maximum stress. The concentrated load and uniform load is considered to beuniformly distributed over a 10’-0” width on a line normal to the centerline of the lane.The intensity of the concentrated load is represented in Figure 5b) for both bending moment and shear force calculations. This load shall be placed in such positions as to produce the maximum stress in the member.Clear Rodway 32 KHS20-4432 K8K1-ft ClearanceParapetParapetFigure 4 – Truck Load and Truck LanesPage 5
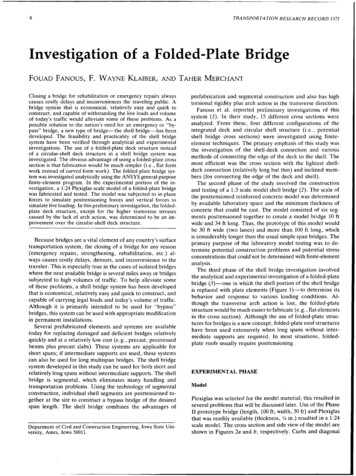
8.0 KIP32.0 KIP14'-0"32.0 KIP14'-0" TO 30'-0"a) Design Truck (HS20-44)18.0 KIP FOR MOMENT26.0 KIP FOR SHEARDISTRIBUTED0.64 KIP/FT TRANSVERSELYOVER A 10 FT WIDTHb) Load LaneFigure 5 – Loading ConditionsB.3 Slab AnalysisThe deck slab is considered to be a one-way slab system due to its large aspect ratio(panel length divided by the panel width). The effect of the skew will be neglected in thisanalysis.The width of the slab strip to be used in the calculation is provided by AASHTO(Section 3.24.3.2) as follows (see Figure 6):B 4 0.06 L 4 0.06(10.5 ft ) 4.6 ft(3)where L (ft) represents the length of the slab measured between supports’ centerline aspreviously defined in Section B.1.P 16 kipwheel load6'-0"4'-741"B2'-385"3'-0"Figure 6 – Loading Conditions for Slab AnalysisFigure 6 clearly demonstrates that there is no interference between two wheel loads.The bridge deck can therefore be analyzed as subjected to the concentrated load of thewheel only. This load will be placed in the most unfavorable position to maximize bothmoment and shear stresses.Page 6
B.3.1 Bridge AnalysisThe bridge analysis is subdivided in: a) dead load analysis and b) live load analysis.It will be discussed in the next two sections.B.3.1.1 Dead Load AnalysisThe load due to both slab and asphalt layer self-weight can be expressed as follows:ωd bhsγ c bhaγ a(4)where b represents the slab unit strip (12 in.), hs and ha are the slab and asphalt layerthickness (7 and 8 in., respectively), and γc and γa represent the concrete and asphaltweight per cubic foot (150 and 108 pcf, respectively). From Eq. (4) one can get ωd 0.16kip/ft.Maximum bending moment and shear force can be written as follows:ωd L2(0.16)(10.52 )MD 2.2 k ft / ft88ω L (0.16)(10.5) 0.8 kip / ftVD d 22(5)B.3.1.2 Live Load AnalysisThe live load analysis is subdivided in two sections; the first one is related to the design truck load analysis (HS20-44), and the second one to the load lane analysis.B.3.1.2.1 Design Truck Load Analysis (HS20-44)Figure 7 shows the bridge loading conditio
The HS20-44 design truck load (Figure 5a) has a front axle load of 8.0 kip, second axle load, located 14.0 ft behind the drive axle, of 32.0 kip, and rear axle load also of 32.0 kip. The rear axle load is positioned at a variable distance, ranging between 14.0 and 30.0 ft. Given the specific bridge geometry, the worst loading scenario is obtained for the minimum spacing of 14.0 ft between the two rear axles.