Transcription
CHAPTER 1: INTRODUCTIONBulk electrical power is generated by three main methods: hydro sources, thermalstations and geo-thermal generating stations. Offgrid (Isolated power supplies) areobtained from diesel engine driven generators. Others are cogeneration and wind. Thepower is generated at 11kV and is stepped up to high voltages of 220kV and 132 kVfor transmission. The transmission voltages are to a large extent determined by systemloss considerations. High voltage transmission requires conductors of larger crosssection which results in lower resistances, hence less energy losses on transmissionlines. The load centres are usually located away from generating stations. Therefore,the power is transmitted to the load centres where it is stepped down to 66kV or33kV, the distribution level. The load demand determines the voltage at which poweris to be supplied. The loads may be residential, industrial or commercial which bringsabout the peak load and off peak load hours. Power is transmitted from low demandareas to high load demand in the grid network. The control of generation,transmission, distribution and area exchange is performed from a centralized location.In order to perform the control functions satisfactorily, the steady state power flowmust be known. The entire system is modelled as an electric network and a solution issimulated using a digital program. Such a problem solution practice is called powerflow analysis.The power flow analysis (also known as the load flow problem) is a very importantand fundamental tool involving numerical analysis applied to a power system. Theresults play a major role in the day to day operation of any system for its control andeconomic schedule. The analysis is also employed during power system designprocedures, planning expansion and development of control strategies. The purpose ofany load flow analysis is to compute precise steady-state voltages and voltage anglesof all buses in the network, for specified load, generator real power and voltageconditions. Once this information is known, the real and reactive power flows intoevery line and transformer, as well as generator reactive power output can beanalytically determined. Due to the nonlinear nature of this problem, numericalmethods are employed to obtain a solution that is within an acceptable tolerance.1
Unlike in traditional circuit analysis, where voltages and currents throughbranches of direct current (d.c) circuits, the load flow study uses simplified notationsuch as the one line diagram, per unit representation and focuses on various forms ofAC power (Real and Reactive), rather than voltage. It is normally assumed that thesystem is balanced and the common use of the term implies a positive sequencesolution only.A power flow analysis for a system operating under actual or projected normaloperation conditions (base case) give the results which constitute a benchmark forcomparison of changes in the network flows and voltages under abnormal conditions.The principal information obtained from power flow analysis, also known as the loadflow study is the magnitude and phase angle of the voltage at each bus and real andreactive power flowing in each line.The load flow problem non-linear relationships are given which involve the realand reactive power consumption at a bus, or the generated real power and scheduledvoltage magnitude at a generator bus. As such, the load flow gives the electricalresponse of the transmission system to a particular set of loads and generators units’outputs.Before the development of large digital computers, load flow analysis werecarried out on AC calculating boards which provided small scale single phase replicasof the actual systems by interconnecting circuit elements and voltage sources. Thewhole process of setting connections, making adjustments, and reading the data wastedious and time consuming. Hence the use of digital computer load flow programs toroutinely run for systems of up to 5000 or more buses and also to study in powersystems control centres, the unique operating problems of power systems.Electric utility companies worldwide use conventional elaborate programs toperform power flow analysis aimed at evaluating the adequacy of complexinterconnected network. Important information is obtained concerning the design andoperation of systems that have not yet been built and effects of changes on existingsystems.2
The solution to the power-flow problem is of fundamental importance in powersystem analysis, design and for starting points of other system studies such astransient stability analysis, economic analysis and fault analysis in power systemswhich demand solutions to a power-flow problem as a first step in the analysis. Inparticular, some programs use linear programming to find the optimal power flow(OPF), Security Constrained Optimal Power Flow (SCOPF) and State Estimation(ES), the conditions which give the lowest cost per kilowatt (kW) generated.In this paper, the purpose of power flow analysis is to determine Kenyan Powertransmission grid systems power flows. The analysis is performed by simulation of theKenyan power transmission Network under MATLAB Environment as a substitute toPower System Simulator for Engineers software (PSS/E), commercial based softwarewhich is normally used by Kenya Power and Lighting Company. The software is used todetermine the reliability of the transmission system under normal and emergencyoperating conditions.The rest of the paper is organised as follows: A brief account of Kenya powersector (Generation and Transmission) is given in chapter2. Theory and background onthe operation states of Power Systems and methodology of power flow analysis isgiven in chapter 3. The power flow problem and simulation of the Network in chapter4. Results, Analysis and Discussion of project are given in chapter 5.The Conclusionand Recommendation in chapter 6.3
4
CHAPTER 2: THE KENYA POWER SECTOR2.1 The Existing SystemThe Kenyan power transmission and distribution network is owned and operated byKPLC. The main public sector generator is Kenya Electricity Generating Company(KenGen) which supplies 80% of the national electricity demand, with the balancebeing supplied by Independent Power Producers (IPPs). KPLC and the UgandaElectricity Transmission Company Limited (UETCL) have an electricity exchangecontract currently with net power export to Uganda. Mumias Sugar Company is theonly local co-generator supplying the grid and currently injects up to 2 MW from itssugar factory in Western Kenya. The capacity will be increased to 25 MW by the endof 2008.The current national installed interconnected capacity is 1,296 MW comprising of737 MW hydroelectric, 279 MW thermal, 128 MW geothermal, 150 MW emergencydiesels, 2 MW cogeneration, and 0.4 MW wind. Table 2.1 gives a summary of theinstalled and effective generation capacity including the Government’s off-grid powerstations.POWER STATIONCAPACITY mall WanjiiSonduTotal HydroGeothermal5
Olkaria I (KenGen)4545Olkaria II (KenGen)7070Olkaria III (IPP)13131281280.40.400Kipevu I Diesel7560Kipevu GT1 and GT2606013.510148.5130Iberafrica Diesel5656Tsavo Power Diesel747420132132150146UETCL (Imports)00TANESCO001,2461,254KenGen Diesel Stations5.24.6REF Diesels and Wind Off-grid Stations6.15.111.39.7Total GeothermalKenGen WindNgongKenGen ThermalKipevu SteamNairobi Gas TurbineTotal KenGen ThermalIPP ThermalMumias CogenerationTotal ThermalEmergency Power ProducersAggreko PowerImportsTotal Interconnected SystemIsolated StationsTotal Off-grid Capacity6
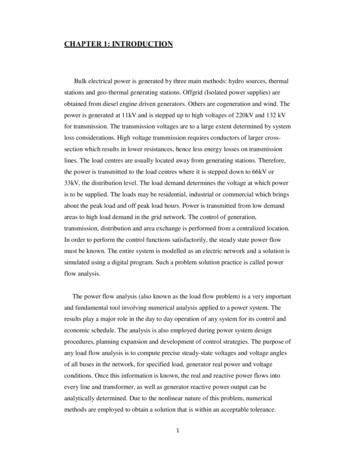
Gross Capacity1,257Kenya Interconnected System Peak Demand1,2631,044Table 2.1: Breakdown of Existing Generation Capacity2.2 The Kenyan Transmission NetworkThe Kenya Power and Lighting Company (KPLC) own transmission anddistribution lines of different voltage capacities scattered all over the country. Thetransmission system as of June 2007 comprise of 1,323 km of 220 kV and 2,122 kmof 132 kV lines and the distribution system comprise of , 632km of 66kV 29 km of 40kV, 11,163 km of 33 kV and 21,918 km of 11 kV lines. Table 2.2 shows thetransmission and distribution lines as of June 2007.Voltage capacityLength (km)220 kV1,323132 kV2,12266 kV63240 kV2933 kV11,16311 kV21,918Total37,186Table 2.2: Transmission and distribution linesThe 220 kV and 132 kV transmission lines of the Kenyan network are shownin the figure 2.1 below.7
Figure 2.1: 220kV and 132kV transmission lines of the KenyannetworkSupply to the Nairobi-North region is sourced from the Olkaria transgrid11/220/132 kV substation via two 220 kV lines both of 66.3 km, which connect to theNairobi- North 220/66 kV substation. There is a 220kV connection from the Kamburu8
generating station to Dandora through two 220kV transmission lines of 107.5 km and109.5 km. There is a 220kV main supply from the Kiambere generating stationconnecting to the Embakasi 220/66 kV transmission substation which is 152.5 km tothe Country Energy 132/66 kV Juja substation located in Dandora township.There is also a 132Kv connection from the Kindaruma generating station to Jujasubstation of 119km. from the Kipevu generating stations a 132kV transmission lineconnects to the Juja substation.2.3 Power DemandThe total energy purchased increased from 5,697 (Giga Watt Hours) GWh in2005/06 to 6,169 GWh in 2006/07 corresponding to a growth of 8.3%. The numberof customers increased to 924,520 2006/07 from 802,249 in 2005/06 equivalent to agrowth of 12.3% compared to 7.7% in 2005/06. Customers under the RuralElectrification Programme (REP) increased by 22,323 to reach 133,047 in 2006/07,representing a 20% growth from the previous year. KPLC sales increased by 8.7%while REP sales increased by 33.9%. This was achieved mainly through strategiesinitiated to enhance customer growth under the Energy Sector Recovery Project(ESRP) and the Rural Electrification Programme. The power sector targets to growthe customer base by 200,000 annually in the next five years through an enhancedcustomer connection campaign programme and the intensive Rural ElectrificationProgramme being implemented by the Government countrywide. This will translateinto a rise in power demand especially due to the large number of domestic customers.Peak power demand increased from 920 MW in 2005/06 to 987 MW in 2006/07and rose to 1,035 MW by November 2007. Intensive measures being implementedthrough the system improvement work under the (Energy Sector Recovery Project)ESRP and (Kenya Power and Lighting Company) KPLC’s own targets to reduceoutages considerably are expected to enhance both peak demand and consumption.2.4 CURRENT GENERATION OPERATION PLANNING INKENYA9
2.4.1 Feasibility Study for interconnecting the Ethiopian and Kenyanpower SystemsRecently Ethiopian Electric Power Corporation (EEPCo) and Kenyan Ministry ofEnergy (MOE) carried out a feasibility study for interconnecting the Ethiopian andKenyan power systems via a high voltage transmission line starting from Wolayta/Sodo on the Ethiopian side and ending in the Nairobi area on the Kenyan side so as tomeet the growing demand of electricity in the country. The target capacity for crossborder exchanges considered generation expansion planning and load forecasts overthe 2007-2030 planning horizon, covered by the EEPCo Master Plan Update andKenya’s Power Development Plan. The review of the short, medium and long termplanning of hydropower capacity development in Ethiopia was subject to particularattention, as this is the key regional resource to be shared through the Kenyainterconnection. Under various assumptions on energy exchanges withSudan, Egypt and Djibouti as well as on the hydrological risks in Ethiopia, a twostage development of the interconnection capacity to Kenya were defined: Phase 11000 MW transfer capacity by 2012, the year scheduled for availabilityof hydropower from Gilgel Gibe III in Ethiopia Phase 22000 MW transfer capacity by 2020, up to the planning horizon 2030.2.4.2 Load Forecast and Generation Planning Review betweenEthiopia and KenyaEthiopiaThe Target Load Forecast prepared in 2006 assumes an economic growth of 12% and150,000 new connections annually over the entire planning horizon, reflecting theGovernment's commitment to economic development and poverty eradication. TheTarget Forecast results in net generation requirements of 71,570 Giga Watthour(GWh) and a peak demand of 14,330 MW in the 2030 financial year (FY), at anaverage annual demand growth rate of 14.3%. The Moderate Forecast for FY 2030 is10
about 50% lower (34,030 GWh and 6,814 MW, average growth rate 10.9%). Inagreement with EEPCo, the Moderate/Reference Forecast was adopted for generationexpansion planning and power system analysis, considering that an economic growthrate above 12% per annum as assumed by the Target Forecast may be difficult tosustain over the relatively long planning period of this study.KenyaThe Reference Forecast prepared in 2007 assumes an economic growth of 6.5% p.a.,which is in line with short term World Bank and IMF projections, and an additional120,000 connections for the next four years. The forecast results in net generationrequirements of 30,999 GWh and a peak demand of 5,282 MW in FY 2030, with anaverage annual growth rate of 7.3%. The results of the Low Forecast in 2030 areabout 10% lower, and the results of the High Forecast are about 25% higher. Inagreement with KPLC, the Reference Forecast was taken for generation expansionand optimization of interconnection capacity.2.4.3 Conceptual DesignDue to the long interconnection distance of up to 1200 km, the choice of thevoltage level and AC or DC technologies plays a decisive role for the technical andeconomic feasibility of the Project. A consensus was reached in the early stages of theconceptual design that the interconnection sh
A power flow analysis for a system operating under actual or projected normal operation conditions (base case) give the results which constitute a benchmark for comparison of changes in the network flows and voltages under abnormal conditions. The principal information obtained from power flow analysis, also known as the load flow study is the magnitude and phase angle of the voltage at each .