Transcription
Tableau CRM SAQL DeveloperGuideSalesforce, Winter ’22@salesforcedocsLast updated: August 25, 2021
Copyright 2000–2021 salesforce.com, inc. All rights reserved. Salesforce is a registered trademark of salesforce.com, inc.,as are other names and marks. Other marks appearing herein may be trademarks of their respective owners.
CONTENTSOVERVIEW.1Introduction . . . . . . . . . . . . . . . . . . . . . . . . . . . . . . . . . . . . . . . . . . . . . . . . . . . . . . . . . . 1Use SAQL in the Tableau CRM Dashboard . . . . . . . . . . . . . . . . . . . . . . . . . . . . . . . . . . . . . 2Enable SAQL Logs in the Browser . . . . . . . . . . . . . . . . . . . . . . . . . . . . . . . . . . . . . . . . . . . 4QUICK START.5Write Your First Query . . . . . . . . . . . . . . . . . . . . . . . . . . . . . . . . . . . . . . . . . . . . . . . . . . . 5Create a Derived Measure . . . . . . . . . . . . . . . . . . . . . . . . . . . . . . . . . . . . . . . . . . . . . . . 6Create a Derived Dimension . . . . . . . . . . . . . . . . . . . . . . . . . . . . . . . . . . . . . . . . . . . . . . 7EXAMPLES.8Analyze Your Data Over Time . . . . . . . . . . . . . . . . . . . . . . . . . . . . . . . . . . . . . . . . . . . . . 8Calculate How Long Activities Take . . . . . . . . . . . . . . . . . . . . . . . . . . . . . . . . . . . . . . . . . 9Display the Opportunities Closed This Month . . . . . . . . . . . . . . . . . . . . . . . . . . . . . . . . . . . 10Forecast Future Data Points with timeseries . . . . . . . . . . . . . . . . . . . . . . . . . . . . . . . . . . . . 11Combine Data from Multiple Data Streams with cogroup . . . . . . . . . . . . . . . . . . . . . . . . . . 12Replace Null Values with coalesce() . . . . . . . . . . . . . . . . . . . . . . . . . . . . . . . . . . . . . . . . 14Dynamically Display Your Top Five Reps with Windowing . . . . . . . . . . . . . . . . . . . . . . . . . . 15Append Datasets using union . . . . . . . . . . . . . . . . . . . . . . . . . . . . . . . . . . . . . . . . . . . . 16Calculate the Slope of the Regression Line . . . . . . . . . . . . . . . . . . . . . . . . . . . . . . . . . . . . 17Show the Top and Bottom Quartile . . . . . . . . . . . . . . . . . . . . . . . . . . . . . . . . . . . . . . . . . 18Calculate Grand Totals and Subtotals with the rollup Modifier and grouping() Function . . . . . . 19SAQL REFERENCESAQLSAQLSAQLSAQL. . . . . . . . . . . . . . . . . . . . . . . . . . . . . . . . . . . . . . . . . . . . . . . . 22Basic Elements . . . . . . . . . . . . . . . . . . . . . . . . . . . . . . . . . . . . . . . . . . . . . . . . . . 22Operators . . . . . . . . . . . . . . . . . . . . . . . . . . . . . . . . . . . . . . . . . . . . . . . . . . . . . . 27Statements . . . . . . . . . . . . . . . . . . . . . . . . . . . . . . . . . . . . . . . . . . . . . . . . . . . . . 36Functions . . . . . . . . . . . . . . . . . . . . . . . . . . . . . . . . . . . . . . . . . . . . . . . . . . . . . . 63QUERY PERFORMANCE . . . . . . . . . . . . . . . . . . . . . . . . . . . . . . . . . . . . . . . . . . . 129Speed Up Queries with Dataflow TransformationsLimit Multivalue Fields . . . . . . . . . . . . . . . . . . .Use Group and Filter Pre-projection . . . . . . . . . .Check for Redundant Filters . . . . . . . . . . . . . . .Limit the Use of unique() . . . . . . . . . . . . . . . . . .129130132133133
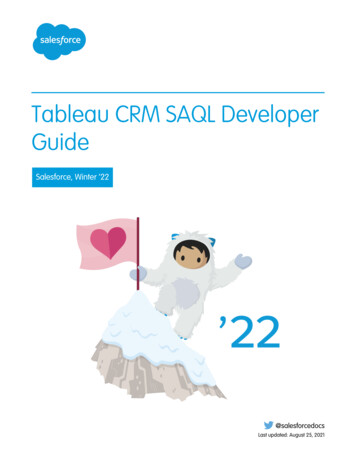
OVERVIEWUse SAQL (Salesforce Analytics Query Language) to access data in Tableau CRM datasets. Tableau CRM uses SAQL behind the scenes inlenses, dashboards, and explorer to gather data for visualizations.Developers can write SAQL to directly access Tableau CRM data via: Tableau CRM REST APIBuild your own app to access and analyze Tableau CRM data or integrate data with existing apps. Dashboard JSONCreate advanced dashboards. A dashboard is a curated set of charts, metrics, and tables. Compare TableUse SAQL to perform calculations on data in your tables and add the results to a new column. Transformations During Data FlowUse SAQL to perform manipulations or calculations on data when bringing it in to Tableau CRM.IntroductionMost actions you take in Tableau CRM result in one or more SAQL queries. Every lens, dashboard, and explorer action generates andexecutes a SAQL query to build the data needed for the visualization.Use SAQL in the Tableau CRM DashboardUse the Tableau CRM Studio user interface to modify existing SAQL queries or write new ones. Writing SAQL queries in the userinterface is the easiest way to get started.Enable SAQL Logs in the BrowserIf you’re using Google Chrome to work with SAQL and Einstein Tableau CRM, you can turn on SAQL logs.SEE ALSO:Tableau CRM REST API Developer GuideTableau CRM Dashboard JSON Developer GuideIntroductionMost actions you take in Tableau CRM result in one or more SAQL queries. Every lens, dashboard, and explorer action generates andexecutes a SAQL query to build the data needed for the visualization.Tableau CRM evaluates queries, widgets, and layouts to render a dashboard. Behind every widget is a SAQL query which is sent the queryengine for execution. The resulting data is passed to the charting library, which renders it using corresponding widget definitions. SAQLis influenced by the Apache Pig Latin (pigql) syntax, but their implementations differ, and they are not compatible.1
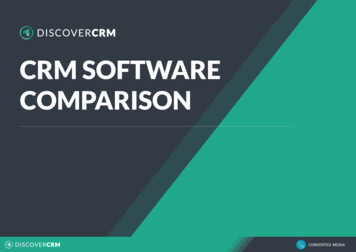
OverviewUse SAQL in the Tableau CRM DashboardHow the components fit togetherDevelopers can write SAQL to access Tableau CRM data, either via the Tableau CRM REST API, or by creating and editing SAQL queriescontained in the dashboard JSON.A SAQL query loads an input dataset, operates on it, and outputs a results dataset. Each SAQL statement has an input stream, an operation,and an output stream. Statements can span multiple lines and must end with a semicolon. Each query line is assigned to a named stream.A named stream can be used as input to any subsequent statement in the same query. The only exception to this rule is the last line ina query, which you don’t need to assign explicitly.Use SAQL in the Tableau CRM DashboardUse the Tableau CRM Studio user interface to modify existing SAQL queries or write new ones. Writing SAQL queries in the user interfaceis the easiest way to get started.Every component in Tableau CRM uses SAQL behind the scenes. You can build a widget in a dashboard, then switch to the SAQL viewto see the SAQL query for the widget. Or, you can create a lens while exploring a dataset, then switch to the SAQL view to see the SAQLquery for the lens.Let’s look at the query generated by a widget in a dashboard.Note: After you edit the SAQL for a widget, you may not be able to go back to the dashboard view, depending on how complexthe SAQL query is.1. In your Salesforce org, open Tableau CRM Studio, then open a dashboard. For example, open Opportunity Details.2. Click Edit.2
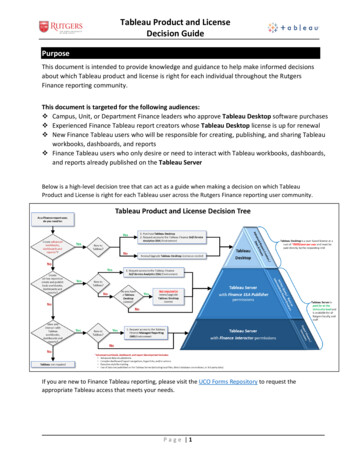
OverviewUse SAQL in the Tableau CRM Dashboard3. Click a query to edit, for example Amount 1, then click Edit in the dropdown list.4. Click SAQL Mode to display the SAQL query.5. View the SAQL query.Here is the SAQL query for our example:q load "DTC Opportunity SAMPLE";q filter q by 'Closed' "false";q group q by all;3
OverviewEnable SAQL Logs in the Browserq foreach q generate sum('Amount') as 'sum Amount';q limit q 2000;6. Edit the query, then click Run Query to run the new query. For example, you could change the sum to average.Enable SAQL Logs in the BrowserIf you’re using Google Chrome to work with SAQL and Einstein Tableau CRM, you can turn on SAQL logs.Note: SAQL Logs in the browser are no longer supported. To see how your SAQL queries run in the dashboard, use the DashboardInspector. You can also right-click the dashboard in the browser and select Inspect.Turning on SAQL logs in the browser prints queries in the Developer Tools Console. This lets you see what SAQL is generated by TableauCRM dashboards and lenses. This action doesn’t change server-side logs.1. In Google Chrome, open a Tableau CRM dashboard.2. In Google Chrome, open Developer Tools.3. In Developer Tools, select Console.4. In the Einstein Analtyics dashboard, elect the explore (wave.apexp) frame.5. In the developer tools console, enter edge.log.enabled true6. In the developer tools console, enter edge.log.query trueSAQL logs are enabled. The logs are displayed when a query is sent from the dashboard or lens, for example when you drill into a chart.4
QUICK STARTGet up to speed quickly with these easy SAQL examples.Write Your First QueryLet's walk through each part of a simple SAQL query.Create a Derived MeasurePerform calculations on existing measures and use the result to create a new, or derived, measure.Create a Derived DimensionPerform string manipulations on existing dimensions to create a new, or derived, dimension.Write Your First QueryLet's walk through each part of a simple SAQL query.We’ll create a new dashboard in a Tableau CRM org. Then we’ll add a simple chart and look at the resulting SAQL.Note: These instructions assume you are using the sample Salesforce Developer org, which includes sample datasets. If you areusing a different org, you can still follow the same general instructions with your own dataset.1. In your Tableau CRM org, create a new dashboard:a. Click Create.b. Click Dashboard.2. In the window Choose a dashboard template, click Blank Dashboard, then click Continue.3. Drag a chart widget to the dashboard canvas.4. In the chart widget, click Chart, then select DTC Opportunity dataset.5. Click the SAQL Mode button to launch the SAQL editor.The SAQL editor displays the SAQL query used to fetch the data and render the chart:1234qqqq load "DTC Opportunity SAMPLE";group q by all;foreach q generate count() as 'count';limit q 2000;Let’s take a look at each line in the query.Line NumberDescription1q load "DTC Opportunity SAMPLE";This loads the dataset that you chose when you created the chart widget. You can use the variable q to accessthe dataset in the rest of your SAQL statements.5
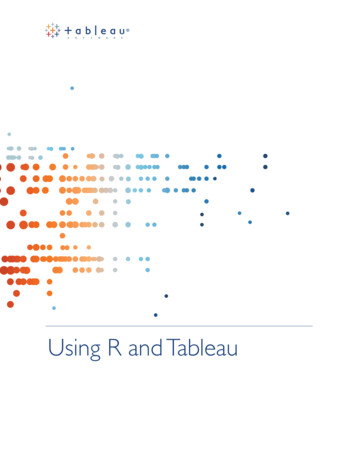
Quick StartCreate a Derived MeasureLine NumberDescription2q group q by all;In some queries, you want to group by a certain field, for example Account ID. In our case we didn’t specify agrouping when we created the chart. Use group by all when you don’t want to group data.3q foreach q generate count() as 'count';This generates the output for our query. In this simple example, we just count the number of lines in the DTCOpportunity dataset.4q limit q 2000This limits the number of results that are returned to 2000. Limiting the number of results can improve performance.However if you want q to contain more than 2000 results, you can increase this number.You can click Back to go back to the chart. You can use the UI to make modifications to the chart, then view the resulting SAQL.Create a Derived MeasurePerform calculations on existing measures and use the result to create a new, or derived, measure.Tableau CRM calculates the value of derived measures at run time using the values from other fields.Note: You can also create a derived measure in a dataflow rather than at runtime using SAQL. Measures created during a datafloware calculated when the data is imported and may result in better performance.Example - Calculate the Time to WinSuppose that you have an Opportunities dataset with the Close Date and Open Date fields. You want to see the number of days it tookto win the opportunity. Use Close Date day epoch and Created Date day epoch to create a derived measure called Time to Win:('Close Date day epoch'- 'Created Date day epoch') as 'Time to Win'.The field Time to Win is calculated at run time:q load "Opportunities";q foreach q generate 'Close Date day epoch' as 'Close Date day epoch','Created Date day epoch' as 'Created Date day epoch', 'Opportunity Name' as'Opportunity Name', ('Close Date day epoch'- 'Created Date day epoch') as 'Time to Win';The resulting table contains the number of days to win each opportunity:6
Quick StartCreate a Derived DimensionCreate a Derived DimensionPerform string manipulations on existing dimensions to create a new, or derived, dimension.Tableau CRM creates derived dimensions at run time.Note: You can also create a derived dimension in a dataflow rather than at runtime.Example - Create a Field with City and StateSuppose that you have an Opportunities dataset with a City and a State field. You want to create a single field containing both city andstate. Use SAQL to create a derived dimension.q load "Ops";q foreach q generate 'Account' as 'Account', 'Amount' as 'Amount', 'City' "-" 'State'as 'City - State';The resulting table contains city and state in the same field.7
EXAMPLESThese hands-on SAQL examples walk you through writing a query to retrieve dataAnalyze Your Data Over TimeUse SAQL date functions for advanced time-based analysis.Calculate How Long Activities TakeUse daysBetween() and date diff() to calculate the difference between two dates or times.Display the Opportunities Closed This MonthUse relative date ranges to filter opportunities closed in the current month.Forecast Future Data Points with timeseriesUse existing data to predict what might happen in the future.Combine Data from Multiple Data Streams with cogroupYou can combine data from two or more data streams into a single data stream using cogroup. The data streams must have atleast one common field.Replace Null Values with coalesce()When you use a left outer or full outer cogroup, unmatched data comes through as null. Use coalesce() to replace nullvalues with the value of your choice.Dynamically Display Your Top Five Reps with WindowingWindowing functions perform calculations over a dynamic range.Append Datasets using unionYou can append data from two or more data streams into a single data stream using union. The data streams must have the samefield names and structure.Calculate the Slope of the Regression LineUse SAQL to perform linear analysis on your data to find the line that best fits the data. Then use .regr slope to return the slopeof this line.Show the Top and Bottom QuartileUse SAQL to calculate percentiles, like the top and bottom quartile of your data.Calculate Grand Totals and Subtotals with the rollup Modifier and grouping() FunctionCalculate subtotals of grouped data in your SAQL query using the rollup modifier on the group by statement, then workwith subtotaled data using grouping(). For example, to see the subtotaled value of opportunities by type and lead source, rollup the type and lead source groups. Then, label the subtotals with the grouping function.Analyze Your Data Over TimeUse SAQL date functions for advanced time-based analysis.Note: You can use date filters in the dashboard for basic time-based analysis, for example to calculate month-to-date amounts.You can also use window functions in the dashboard for basic date range calculations, such as calculating the change inyear-over-year earnings8
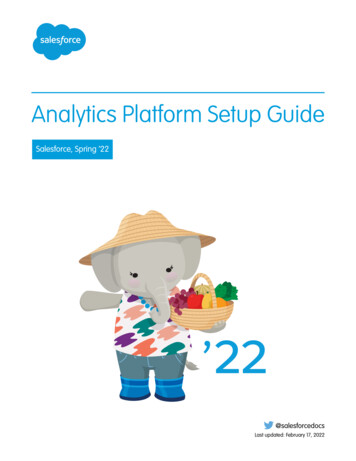
ExamplesCalculate How Long Activities TakeExample - on Which Weekday Do Customers Send the Most Emails?Suppose that you want to see which day of the week your customers are most active on email. This information allows you to bettertarget your email campaigns. Use day in week() on the Mail sent sec epoch field to calculate the day of the week, then countthe number of records for each day.qqqq load "DTC Opportunity SAMPLE";foreach q generate day in week(toDate(Mail sent sec epoch)) as 'Day in Week';group q by 'Day in Week';foreach q generate 'Day in Week', count() as 'count';In this case, email traffic is slightly higher on day 4 (Wednesday) and day 7 (Sunday).SEE ALSO:Date FunctionsCalculate How Long Activities TakeUse daysBetween() and date diff() to calculate the difference between two dates or times.Example: Display the Number of Days Since an Opportunity OpenedSuppose that you have an opportunity dataset with the account name and the epoch seconds fields:You want to see how many days ago an opportunity was opened. Use daysBetween() and now(). Use toDate() to convertthe order date epoch seconds to a date format that can be passed to daysBetween().q load "OpsDates1";q foreach q generate Account, daysBetween(toDate(OrderDate sec epoch), now()) as'daysOpened';The resulting data stream displays the number of days since the opportunity was opened.9
ExamplesDisplay the Opportunities Closed This MonthExample - How Many Weeks Did Each Opportunity Take to Close?Use date diff() with datepart week to calculate how long, in weeks, it took to close each opportunity.q load "DTC Opportunity";q foreach q generate date diff("week", toDate(Created Date sec epoch),toDate(Close Date sec epoch) ) as 'Weeks to Close';q order q by 'Weeks to Close';SEE ALSO:daysBetween()date diff()Display the Opportunities Closed This MonthUse relative date ranges to filter opportunities closed in the current month.Example: Display Opportunities Closed This MonthSuppose that you want to see which opportunities closed this month. Your data includes the account name, the close date fields, andthe epoch seconds field.Use date() to generate the close date in date format. Then use relative date ranges to filter opportunities closed in the current month.q load "OpsDates1";q filter q by date(’CloseDate Year’, ‘CloseDate Month’, ‘CloseDate Day’) in ["currentmonth" . "current month"];q foreach q generate Account;If the query is run in May 2018, the resulting data stream contains one entry:10
ExamplesForecast Future Data Points with timeseriesTo add the close date in a readable format, use toDate().q load "OpsDates1";q filter q by date('CloseDate Year', 'CloseDate Month', 'CloseDate Day') in ["currentmonth" . "current month"];q foreach q generate Account, toDate('CloseDate sec epoch') as 'Close Date';The resulting data stream includes the full date and time of the close date.You can also display just the month and day of the close date.q load "OpsDates1";q filter q by date('CloseDate Year', 'CloseDate Month', 'CloseDate Day') in ["currentmonth" . "current month"];q foreach q generate Account, 'CloseDate Month' "/" 'CloseDate Day' as 'Close Date';The resulting data stream contains the month and day of the close date.SEE ALSO:Time-Based FilteringForecast Future Data Points with timeseriesUse existing data to predict what might happen in the future.Example - How Many Tourists Will Visit Next Year?Suppose that you run a chain of retail stores, and the number of tourists in your city affect your sales. Use timeseries to predicthow many tourists will come to your city next year:q load "TouristData";q group q by ('Visit Year', 'Visit Month');q foreach q generate 'Visit Year', 'Visit Month', sum('NumTourist') as 'sum NumTourist';-- If your data is missing some dates, use fill() before using timeseries()-- Make sure that the dateCols parameter in fill() matches the dateCols parameter intimerseries()q fill q by (dateCols ('Visit Year','Visit Month', "Y-M"));11
ExamplesCombine Data from Multiple Data Streams with cogroup-- Use timeseries() to predict the number of tourists.q timeseries q generate 'sum NumTourist' as Tourists with (length 12,dateCols ('Visit Year','Visit Month', "Y-M"));q foreach q generate 'Visit Year' " " 'Visit Month' as 'Visit Year Visit Month',Tourists;Use a timeline chart and set a predictive line to see the calculated future data. The resulting graph shows the likely number of touristsin the future.SEE ALSO:timeseriesCombine Data from Multiple Data Streams with cogroupYou can combine data from two or more data streams into a single data stream using cogroup. The data streams must have at leastone common field.Example - Inner cogroupSuppose that you want to understand how much time your reps spend meeting with each account. Is there a relationship betweenspending more time and winning an account? Are some reps spending much more or much less time than average? To answer thesequestions, first combine meeting data with account data using cogroup.Suppose that you have a dataset of meeting information from the Salesforce Event object. In this example, your reps have had sixmeetings with four different companies. The Meetings dataset has a MeetingDuration column, which contains the meeting duration inhours.12
ExamplesCombine Data from Multiple Data Streams with cogroupThe account data exists in the Salesforce Opportunity object. The Ops dataset has an Account, Won, and Amount column. The Amountcolumn contains the dollar value of the opportunity, in millions.To see the effect of meeting duration on opportunities, you start by combining these two datasets into a single data stream usingcogroup.q cogroup ops by 'Account', meetings by 'Company';Internally (you cannot see these results yet), the resulting cogrouped data stream contains the following data. Note how the data streamsare rolled up on one or more dimensions.(1,{(Shoes2Go,2,), (Shoes2Go,5)},{(Shoes2Go,1,1.5), (Shoes2Go,0,3})(2,{(FreshMeals,3), (FreshMeals, 5)},{(FreshMeals,1,2) (FreshMeals, 1, 1.4)})(3,{(ZipBikeShare,4)},{(ZipBikeShare,1, 1.1)})(4,{(ZenRetreats,6)},{(ZenRetreats,0, 2)})Now the datasets are combined. To see the data, you create a projection using foreach:ops load "Ops";meetings load "Meetings";q cogroup ops by 'Account', meetings by 'Company';q foreach q generate ops.'Account' as 'Account', sum(ops.'Amount') as 'sum Amount',sum(meetings.'MeetingDuration') as 'TimeSpent';The resulting data stream contains the sum of amount and total meeting time for each company. The sum of amount is the sum of thedollar value for every opportunity for the company.13
ExamplesReplace Null Values with coalesce()Now that you have combined the data into a single data stream, you can analyze the effects that total meeting time has on youropportunities.SEE ALSO:cogroupReplace Null Values with coalesce()When you use a left outer or full outer cogroup, unmatched data comes through as null. Use coalesce() to replace null valueswith the value of your choice.Example: Left Outer Cogroup with coalesce()A left outer cogroup combines the right data stream with the left data stream. If a record on the left stream does not have a match onthe right stream, the missing right value comes through as null. To replace null values with a different value, use coalesce().For example, suppose that you have a dataset of meeting information from the Salesforce Event object, and you join it with data fromthe Salesforce Opportunity object. This shows amount won with the total time spent in meetings.ops load "Ops";meetings load "Meetings";q cogroup ops by 'Account' left, meetings by 'Company' ;q foreach q generate ops.'Account' as 'Account', sum(ops.'Amount') as 'sum Amount',sum(meetings.'MeetingDuration') as 'TimeSpent';It looks like we had no meetings with Zen Retreats.Let’s use coalesce() to change that null value to a zero.ops load "Ops";meetings load "Meetings";q cogroup ops by 'Account' left, meetingsby 'Company' ;–-use coalesce() to replace null values with zeroq foreach q generate ops.'Account' as 'Account', sum(ops.'Amount') as 'sum Amount',coalesce(sum(meetings.'MeetingDuration'), 0) as 'TimeSpent';14
ExamplesDynamically Display Your Top Five Reps with WindowingSEE ALSO:cogroupDynamically Display Your Top Five Reps with WindowingWindowing functions perform calculations over a dynamic range.Example - Dynamically Display Your Top Five RepsUse windowing to create a chart that dynamically displays your top-five reps for each country. The chart updates continuously asopportunities are won. The example uses windowing to calculate: Percentage contribution that each rep made to the total amount, partitioned by country Ranking of the rep’s contribution, partitioned by countryThese calculations let us display the top-five reps in each country.q load "DTC Opportunity SAMPLE";q group q by ('Billing Country', 'Account Owner');q foreach q generate 'Billing Country', 'Account Owner',-- sum(Amount) is the total amount for a single rep in the current country-- sum(sum('Amount') is the total amount for ALL reps in the current country-- sum(Amount) / sum(sum('Amount') calculates the percentage that each rep contributed-- to the total amount in the current country((sum('Amount')/sum(sum('Amount'))-- [.] means "include all records in the partition"-- "by Billing Country" means partition, or group, by countryover ([.] partition by 'Billing Country')) * 100) as 'Percent AmountContribution',-- rank the percent contribution and partition by the countryrank() over ([.] partition by ('Billing Country') order by sum('Amount') desc ) as'Rep Rank';-- filter to include only the top 5 repsq filter q by 'Rep Rank' 5;The resulting graph shows the top-five reps in each country and displays each rep’s ranking.15
ExamplesAppend Datasets using unionAppend Datasets using unionYou can append data from two or more data streams into a single data stream using union. The data streams must have the samefield names and structure.To use union, first load the dataset and then use foreach to do the projection. Repeat the process with another dataset. If the tworesulting data streams have an identical structure, you can append them using union.Let’s say that you have two opportunity datasets from different regions that you brought together using the Salesforce mulit-orgconnector. You want to add these datasets together to look at your pipeline as a whole.The OppsRegion1 data stream contains these fields.The OppsRegion2 data stream contains these fields.16
ExamplesCalculate the Slope of the Regression LineUse union to combine the two data streams.ops1 load "OppsRegion1";ops1 foreach ops1 generate 'Account Owner', 'Account Type', 'Amount';ops2 load "OppsRegion2";ops2 foreach ops2 generate 'Account Owner', 'Account Type', 'Amount';-- ops1 and ops2 have the same structure, so we can use unionopps total union ops1, ops2;The resulting data stream contains both sets of data.SEE ALSO:unionCalculate the Slope of the Regression LineUse SAQL to perform linear analysis on your data to find the line that best fits the data. Then use .regr slope to return the slope ofthis line.17
ExamplesShow the Top and Bottom QuartileExample - Calculate the Relationship Between Number of Activities andDeal AmountSuppose that you have a dataset that includes the number of activities (such as meetings) and the won opportunity amount.How much bigger with the deal size be for each extra activity? regr slope performs a linear analysis on your data then calculatesthe slope (that is, the increased amount you win for each extra activity).q load "data/sales";q group q by all;--trunc() truncates the result to two decimal placesq foreach q generate trunc(regr slope('Amount', 'NumActivities'),2) as 'Gain per Activity';Based on your existing data, every extra activity that you have tends to increase the deal size by 1.45 million, on average.SEE ALSO:regr slope()Show the Top and Bottom QuartileUse SAQL to calculate percentiles, like the top and bottom quartile of your data.18
ExamplesCalculate Grand Totals and Subtotals with the rollup Modifierand grouping() FunctionExample - Show Top Quartile and Bottom Quartile Deal Size by CountrySuppose that you want to see the top and bottom quartile deal size, by country. You want to see the size of the actual deal, not theinterpolated (or 'average') deal size. Use percentile disc(.25) and percentile disc(.75).q load "Data";q group q by 'Billing Country';q foreach q generate 'Billing Country' as 'Billing Country', percentile disc(0.25) withingroup (order by 'Amount' desc) as '25th Percentile', percentile disc(0.75) within group(order by 'Amount' desc) as '75th Percentile';q order q by '25th Percentile' asc;Use a bar chart and select Axis Mode Single Axis to show the top and bottom quartiles together.SEE ALSO:percentile disc()Calculate Grand Totals and Subtotals with the rollup Modifier andgrouping() FunctionCalculate subtotals of grouped data in your SAQL query using the rollup modifier on the group by statement, then work withsubtotaled data using grouping(). For example, to see the subtotaled value of opportunities by type and lead source, roll up thetype and lead source groups. Then, label the subtotals with the grouping function.Invoking rollup adds rows to your query results with null values for dimensions and subtotaled results for measures. Invokinggrouping() returns 1 if null dimension values are due to higher-level aggregates (which usually means the row is a subtotal),otherwise it returns 0.Using grouping() alongside rollup lets you work with subtotaled data. After subtotaling data, common next steps includelogically evaluating subtotaled data with a case statement. Or filtering on subtotaled data with a filter statement.19
ExamplesCalculate Grand Totals and Subtotals with the rollup Modifierand grouping() FunctionSuppose that you have an opportunity dataset, and want to see the value of deals by lead source and type. Plus, you want to see thetotal value of all lead sources and all types. Write a query that returns the sum of opportunity amount grouped by type and lead source.To see the value of all lead sources and all types, use rollup to subtotal opportunities, then use grouping() to label the subtotaledrows.Example: rollupOpen the SAQL editor in the dashboard. Instead of grouping data by a field, specify the rollup modifier as the group and pass thefields you want subtotaled - Type and Lead Source - as parameters. Set q group q by rollup('Type','LeadSource');. Here's the full query.qqqq load "opportunityData
Tableau CRM Dashboard JSON Developer Guide Introduction Most actions you take in Tableau CRM result in one or more SAQL queries. Every lens, dashboard, and explorer action generates and executes a SAQL query to build the data needed for the visualization. Tableau CRM evalu