Transcription
Spatial and temporal occurrence of bats inthe southern North Sea areaAuthors: Sander Lagerveld, Daan Gerla, Jan Tjalling van der Wal, Pepijn de Vries,Wageningen University &Robin Brabant, Eric Stienen, Klaas Deneudt, Jasper Manshanden & Michaela SchollResearch Report C090/17
Spatial and temporal occurrence ofbats in the southern North Sea areaAuthor(s):Sander Lagerveld, Daan Gerla, Jan Tjalling van der Wal, Pepijn de Vries, Robin Brabant,Eric Stienen, Klaas Deneudt, Jasper Manshanden & Michaela SchollPublication:16 November 2017Wageningen Marine ResearchDen Helder, November 2017Wageningen Marine Research report C090/17
Sander Lagerveld, Daan Gerla, Jan Tjalling van der Wal, Pepijn de Vries, Robin Brabant,Eric Stienen, Klaas Deneudt, Jasper Manshanden & Michaela Scholl, 2017. Spatial and temporaloccurrence of bats in the southern North Sea area. Wageningen Marine Research (University &Research centre), Wageningen Marine Research report C090/17; 52 p.Keywords: Bats, offshore wind energy, bat detector researchClients:Rijkswaterstaat; Water, Verkeer en Leefomgeving, Postbus 2232, 3500 GE Utrecht, Zaaknummer31103115/de JongEneco; Marten Meesweg 5, 3068 AV RotterdamGemini: Amstelveenseweg 760, Amsterdam, 1081 JK, NetherlandsThis research was part of the WOZEP programme (‘offshore wind ecological programme’),commissioned by Rijkswaterstaat and (co-)financed by Eneco, Gemini and the Ministry ofEconomic Affairs for the purposes of Policy Support Research Theme ‘Wind op Zee’ (Kennisbasis project KB24-001-001).This report can be downloaded for free from https://doi.org/10.18174/426898Wageningen Marine Research provides no printed copies of reportsWageningen Marine Research is ISO 9001:2008 certified.Photo cover: Hans Verdaat 2017 Wageningen Marine Research Wageningen URWageningen Marine ResearchThe Management of Wageningen Marine Research is not responsible for resultinginstitute of Stichting Wageningendamage, as well as for damage resulting from the application of results orResearch is registered in the Dutch research obtained by Wageningen Marine Research, its clients or any claimstraderecord nr. 09098104,related to the application of information found within its research. This reportBTW nr. NL 806511618has been made on the request of the client and is wholly the client's property.This report may not be reproduced and/or published partially or in its entiretywithout the express written consent of the client.2 of 52 Wageningen Marine Research report C090/17
ContentsSummary41Introduction61.1Background61.2Aim of the project71.3Project team71.4Acknowledgements72345Materials and Methods82.1Study area82.2Equipment2.3Data management102.4Statistical analyses139Results143.1Monitoring effort143.2Performance of the equipment153.3Date/time plots per monitoring location173.4Nathusius’ pipistrelle223.5Statistical analysis29Discussion & Conclusions364.1Acoustic monitoring of bats364.2Spatiotemporal occurrence of Nathusius’ pipistrelle364.3Quality of the models394.4Function of the study area for bats394.5Recommendations40Quality Assurance41References42Justification45Annex 1: Monitoring locations46Wageningen Marine Research report C090/17 3 of 52
SummarySince a few years it is known that bats migrate over sea on a regular basis. As numerous land-basedstudies have shown that wind turbines can cause high fatality rates amongst bats Rijkswaterstaatstarted a bat monitoring programme for 2015 and 2016 in order to reduce uncertainties aboutpossible impacts. At the same time Eneco commissioned a bat monitoring programme for 2015 and2016 as part of the Monitoring and Evaluation Programme (MEP) for the offshore windfarmLuchterduinen. In 2016 Gemini conducted a bat monitoring campaign in windfarm Buitengaats andWageningen Marine Research executed a bat monitoring programme at Wintershall platform P6-A andoffshore research station FINO3 in the same year. The joint monitoring effort included 12 differentoffshore locations and 5 locations at the coast.The specific aims of these monitoring programmes are an assessment of :1.The species composition at sea and at the coast2.The spatiotemporal pattern of occurrence, including the flight height3.The relation between environmental conditions and the occurrence of bats4.The function of the Dutch Territorial Sea for batsThe monitoring results at the coast showed that Nathusius’ pipistrelle is very common during bothspring and autumn migration, but is also regular throughout the summer. It is also the mostfrequently recorded species at sea, albeit much less frequently recorded in comparison to the coast. Atsea it was recorded from late August until late October (and one observation in November), and –to alesser extent- from early April until the end of June. There were no records in July until mid-August.The observed pattern of occurrence matches previous offshore monitoring studies in the German andDutch North Sea.Due to a limited amount of data in spring we analysed the presence/absence of Nathusius’ pipistrelleper night from mid-August until late October. In this period bat activity was recorded during 11% ofthe nights at sea and during 66% of the nights at the coast. The higher number of nights at the coastmay reflect the relative proportion of bats migrating at the coast and over sea, but the numbers at thecoast are likely to be higher due to funnelling, whereas migration over sea is likely to follow a broadfront due to the absence of guiding landscape features. However, locally densities at sea may be alsoinflated as bats are likely to be attracted to offshore structures. Consequently, based on bat detectordata alone, we cannot estimate the proportion of bats migrating along the coast and over sea.Due to the differences in occurrences at sea and at the coast we developed one statistical model forthe offshore stations and one for the coastal stations. We modelled the presence/absence per night asa function of various weather parameters, the moon illumination, the spatial coordinates and the nightin year in the period mid-August until late October.The most important predictor for the occurrence of Nathusius’ pipistrelle in autumn at sea and at thecoast are low to moderate wind speeds, followed by night in year (the date). At the coast theirpresence increases rapidly from mid-August and continues to be high subsequently. At sea theoccurrence is strongly peaked. The first wave of migrating animals occurs late August/early Septemberand the second late September. Next, high temperatures increase significantly the presence of bats,both at the coast and at sea. Wind direction is also important; at sea wind directions between NE andSE (with a peak at 94 degrees) result in highest presence, whereas this is the case with winddirections between E and SW (with a peak at 170 degrees) at coastal locations. The observed optimalwind direction at sea (94 degrees) implies that bats crossing over sea choose tailwind conditions,whereas the presence at the coast seems to be shaped by funnelling. Therefore, it seems unlikelythat wind drift or storms cause its presence off our western coastline. However, it has been suggestedthat wind drift is the main cause for the occurrence of bats north of the Wadden Islands. We alsofound a moon illumination effect in both models. Increasing moon illumination raised the probability of4 of 52 Wageningen Marine Research report C090/17
presence at sea and at the coast. Rain reduced probability of the presence of bats at the coast. Incontrast, we did not find an effect for rain at sea; thus, bats were recorded with and without rain atsea. High cloud cover was negatively correlated with the presence of bats at sea, but was positivelycorrelated with the presence of bats at the coast.The sea model predicts a higher probability of presence in the northwestern corner of the study area.However, we think that this is an artefact caused by the relatively high number of nights with batactivity at the P6A platform, in comparison to the presence at the other offshore monitoring locations.This may be just be a coincidence, but it is also possible that a spatial pattern of occurrence at sea isactually present. For example if bats follow their general migration direction (WSW) after leaving theAfsluitdijk they will pass closely to P6-A.The recorded bat activity at nearshore monitoring locations (between 22 and 25 km from the coast)peaks approximately 4 hours after dusk. It seems likely that these animals departed the same nightfrom the coast. However, bat activity at the locations further offshore (between 58 and 69 km fromthe coast) starts often close to dusk. This means that these animals must have spent the day at themonitoring location at sea, or in its vicinity. This pattern of occurrence means that the observed batactivity at a particular night may depend on their departure decision in the previous night, or evenearlier.Other species recorded during this study included Common pipistrelle which was occasionally recordedoffshore, but was common at the coast throughout the monitoring season. Nyctaloids were recordeduncommonly offshore from June until October and from May until late October at the coast. Nyctaloidsidentified to species level included Common noctule, Particoloured Bat, Leister’s Bat, Northern Bat andSerotine Bat. Pond bats were not recorded offshore but were regular at the Afsluitdijk and rareelsewhere along the coast. Finally, there were some occasional records of Daubenton’s bats andSoprano pipistrelles at the coast.The results of this study show that the occurrence of bats at sea is highly seasonal which indicatesthat individuals recorded at sea are on migration. The peak period runs from late August until the endof September. After that it levels off throughout October. Spring migration is much less pronouncedbut the duration seems to be quite extensive; from late March until the end of June. Records of bats inJuly and early August are rare. At the coast bats are much more common in general and theirpresence is both shaped by migratory movements and the presence of foraging individuals from localpopulations. Therefore, the relevant period to consider the presence of bats at sea off the westerncoast of the Netherlands and Belgium seems to be from 15 March until 30 June and from 15 Augustuntil 31 October, whereas bats should be considered the entire active season at the coast.Based on the monitoring results of the 2012 – 2014 studies a precautionary mitigation measure wasissued using 5 m/s as cut-in wind speed for the wind farms in the Borssele area in the period 15August until 1 October. The current study however shows that other environmental parameters, inaddition to the wind speed, are important as well. The model developed in this study is likely topredict the presence of bats at sea more accurately, despite the fact the model can be improved.In order to improve the sea model it is recommended to continue monitoring offshore to increase thenumber of observations in the dataset. The model can furthermore be improved by monitoring in adenser grid to reveal spatial patterns and include information on the availability of insects (batmigration fuel). In addition, we urgently need monitoring data from higher altitudes as bat migrationmay occur at altitudes beyond the detection range of the current monitoring network at sea.Wageningen Marine Research report C090/17 5 of 52
1Introduction1.1BackgroundFor quite some time there have been indications of bat movements over the North Sea. Observers ofbird migration at the Dutch coast regularly report bats flying in from sea (Lagerveld et al. 2014a).Bats have also been observed during ship-based bird surveys in the North Sea and have been foundon oil and gas platforms, ships and remote islands (Skiba et al. 2007, Walter et al. 2007, Boshamerand Bekker 2008, Petersen et al. 2014). Recently a few ringing recoveries of Nathusius’ pipistrelles(Pipistrellus nathusii) have shown that bats are able to cross the North Sea successfully1.To gain a better understanding of bat activity at the North Sea, several acoustic monitoring studieshave been carried out there in recent years. Hüppop & Hill (2016) monitored at the offshore researchstation FINO 1 in the German territorial Sea from 2004 – 2015 and in the Dutch territorial sea offshorebat activity was monitored at several locations from 2012-2014 (Jonge Poerink et al. 2013, Lagerveldet al. 2014a, 2014b & 2015). During these studies bats were regularly recorded, in particular duringthe migration season in spring and autumn.Numerous studies have shown that onshore wind turbines can cause high fatality rates amongst bats(e.g. Kunz et al. 2007, Baerwald et al. 2008, Bach et al. 2014, Brinkmann et al. 2011, Cryan et al.2014, Dürr 2013, Jones et al. 2009, Lehnert et al. 2014, Rydell et al. 2010a, b) Therefore it cannot beruled out that offshore wind turbines can also have a negative impact on bat populations, if theseanimals regularly use the North Sea as fly zone, thus taking the risk of barotrauma (physical damagecaused by rapid fluctuations in air pressure) and/or death due to getting close to or colliding with aturbine. A preliminary assessment by Leopold et al. 2014 indicated that negative population effects onNathusius’ pipistrelle and possibly also Noctule Nyctalus noctula and Particolored bat Vespertiliomurinus cannot be excluded when the planned roll-out of new offshore windfarms is implementedbased on the Energy Agreement for Sustainable Growth2.In order to reduce this potential negative effect a mitigation measure was issued for the planned windfarms in the Borssele area. The initial bat monitoring projects in 2012-2014 showed a substantialincrease in bat activity in the autumn migration periods during nights with low to moderate windspeeds and therefore the cut-in wind speed for the wind turbines in this area was increased to 5 m/sbetween 15 August and 30 September.Given the fact that bats have a strictly protected status by national and international regulations,‘Rijkswaterstaat’ (RWS) commissioned a bat monitoring programme for 2015 and 2016 (hereafterreferred to as ‘RWS-project’) in order to reduce uncertainties about possible impacts. To makemaximum use of available resources and facilities, the RWS monitoring study was linked witha study conducted by Eneco as part of the Monitoring and Evaluation Programme (MEP) for theoffshore windfarm Luchterduinen and in cooperation with three Belgian research institutes: the RoyalBelgian Institute of Natural Sciences (RBINS), the Flanders Marine Institute (VLIZ), and the ResearchInstitute for Nature and Forest (INBO). Furthermore, Gemini commissioned a bat monitoring campaignin 2016 in windfarm Buitengaats and Wageningen Marine Research executed a bat monitoringprogramme at Wintershall platform P6-A and offshore research station FINO3 in the same year. Thefirst part of this report describes the monitoring results of the RWS, Eneco, Gemini & WMR projects.The second part of this report describes the analysis of the spatiotemporal occurrence of Nathusius’pipistrelle during the autumn migration in relation to the environmental conditions.12http://www.bats.org.uk/pages/national nathusius pipistrelle .aspx6 of 52 Wageningen Marine Research report C090/17
1.2Aim of the projectThe objective of this study is to obtain relevant information which can be used to determine the effectof the development of the offshore wind energy sector at the southern North Sea in relation to bats.The specific aims of this study are to assess:1.The species composition at sea and at the coast2.The spatiotemporal pattern of occurrence, including the flight height3.The relation between environmental conditions and the occurrence of bats4.The function of the Dutch Territorial Sea for bats1.3Project teamThe project team that conducted this study included: employees of Wageningen Marine Research(WMR; Sander Lagerveld, Daan Gerla, Jan Tjalling van der Wal, Pepijn de Vries, Jasper Manshanden,and Michaela Scholl); the Fieldwork Company (tFC; Bob Jonge Poerink); Royal Belgian Institute ofNatural Sciences (RBINS; Robin Brabant); Research Institute for Nature and Forest (INBO; EricStienen) and Flanders Marine Institute (VLIZ; Klaas Deneudt).WMR had the project leadership, both substantive and managerial, performed the statistical analysisand compiled the report. tFC executed the fieldwork and processed the raw ultrasonic sound data ofthe RWS & Eneco monitoring locations. The data obtained from the added stations Gemini OHVS 2Buitengaats, Wintershall P6-A, and Fino3 was processed by WMR. KBIN, INBO & VLIZ facilitated themonitoring at the Belgian monitoring location and provided general ecological expertise.1.4AcknowledgementsIn addition to our partners and sponsors, other parties provided input and support to our project. Wewould like to thank E-Connection for providing the measuring location at the working island NeeltjeJans and Havenbedrijf Rotterdam for using the Radartower at Hoek van Holland. In addition we areindebted to Belwind, C-Power, Engie E&P, RWE and Wintershall who facilitated the monitoring atBelwind OHVS, C-Power OHVS, the platforms L10A-AC/K12-BP, the IJmuiden Meteomast and the P6-Aplatform respectively.Wageningen Marine Research report C090/17 7 of 52
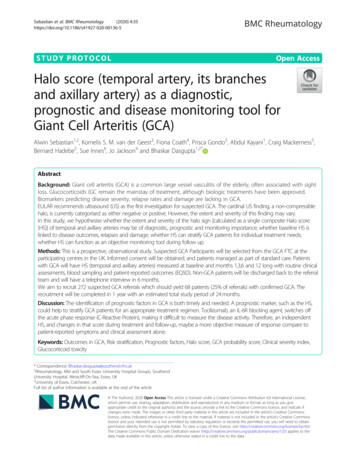
2Materials and Methods2.1Study areaThe assignment focuses on measuring bat activity in the southern North Sea. Since wind energyproduction in the coming years in the Dutch Exclusive Economic Zone (EEZ) is expected to bedeveloped mostly to the west of the Dutch Provinces of Noord Holland and Zuid Holland and inZeeland, most monitoring locations are located in that area. Figure 2-1 shows a map of all offshoreand coastal locations where acoustic bat monitoring has been executed in the period 2015 -2016.Offshore Wind Farm Egmond aan Zee (OWEZ) is also shown; this is where bat monitoring wasexecuted during 2012-2014.Figure 2.18 of 52 Acoustic monitoring networkWageningen Marine Research report C090/17
An overview of the 2015/2016 stations per project partner is given in Table 2.1. Photos and detaileddescriptions of the monitoring locations can be found in Annex 1.Table 2.1 Monitoring locations in 2015/2016No. LocationObject20152016Sponsor1OostendeBuilding KBIN/INBO/VLIZ2C-Power OHVSPlatform KBIN/INBO/VLIZ3Belwind OHVSPlatform RWS4Neeltje Jans mastMast RWS5EuroplatformPlatform RWS6Lichteiland GoereePlatform RWS7Hoek van Holland radar mast 3Mast RWS8Luchterduinen OHVSPlatform Eneco9PAWP OHVSPlatform Eneco11 3D mast Egmond beachMast RWS12 Wintershall platform P6-APlatform WMR13 IJmuiden meteo mast (low & high) Mast 14 AfsluitdijkMast 15 Engie platform K12-BPRemarksEZ (KB) fundsRWS RWSPlatform RWSreplacement IJmuiden low16 Engie platform L10A-ACPlatform RWSreplacement IJmuiden17 Gemini OHVS 2 BuitengaatsPlatform Gemini18 Fino3Mast WMR2.2EZ (KB) fundsEquipmentThe bat activity was monitored with ultrasonic recorders (Batcorder 3.0 / 3.1 EcoObs Ltd., Germany)which were placed in a waterproof box. The recorders do not record continuously but only after beingtriggered by a bat sound, or bat call-like sound in the range of 16 – 150 kHz. Sounds are usuallyrecorded at a distance of 15-100 m from the recorder depending on their species-specific echolocationcharacteristics, the actual environmental conditions, and the recorder settings (Barataud 2015). Thebat recorders used in this project were equipped with a cellular modem. By sending a daily statusupdate, the following recorder functions can be monitored: Identifier of the bat detector Free memory on the SDHC card Total number of recordings Number of recordings previous night Microphone-signal level: TSL [%] Warning messages, e.g. low battery, memory card (almost) full, read or write error memory cardThis information, in principle, allows for the timely response to malfunctions, e.g., a recorder can bereplaced if the capacity of the memory card has reached its limits, if TSL levels are low, or othertechnical issues occur. Note, however, that the modem can only be used if there is network coverage,which was not the case at the far offshore locations (P6-A, K12-BP, L10A-AC, Gemini and Fino3).Where recorders had to be mounted by third parties, because of restricted access to the location, aninstallation manual was provided, and advice and instructions given to the authorised staff, e.g.subcontractors of the windfarm owners, regarding the preferred location/orientation and way ofattachment of the recorder.Wageningen Marine Research report C090/17 9 of 52
Preferably the recorders are orientated in an easterly direction to avoid salt spray during strongwesterlies. Table 2.2 shows the geographical location of the recorders, including their orientation andheight above sea level.Table 2.2 Geografical location and orientation of the recordersLongitudeLatitudeHeight abovesea level [m]Orientation[degrees]Distance toshore to theeast [km]1 Oostende2.9351.244360-2 C-Power OHVS2.9951.581560403 Belwind OHVS2.8251.692090604 Neeltje Jans mast3.7151.641090-5 Europlatform3.28521590586 Lichteiland Goeree3.6751.921590224.151.99890-8 Luchterduinen OHVS4.1752.41590259 PAWP OHVS4.2452.5915902511 3D mast Egmond beach4.6152.59990-12 Wintershall platform P6-A3.7652.76231106013 IJmuiden meteo mast (low & high)3.4452.8519 (80)908514 Afsluitdijk5.1252.98660-15 Engie platform K12-BP3.953.342013512216 Engie platform L10A-AC4.253.417906917 Gemini OHVS 2 Buitengaats6.0454.042613518318 Fino37.1655.19229085LocationNo.7 Hoek van Holland radar mast 3In this study, the threshold amplitude of the recorder was set to -36 dB in order to gain microphonesensitivity (default setting is -24 dB). For all other parameters, the default settings of themanufacturer were used; post-trigger: 400 ms; threshold frequency: 16 kHz; recording quality 20 andnoise filter: 1.The microphones of the recorders should be calibrated regularly (at least one time per year, or soonerwhen TSL levels are continuously low) to ensure the comparability of the measurements taken by thedifferent recorders and the data series from one year to the next.2.3Data managementEcholocating bats emit ultrasonic pulses to gain information about their environment. Ultrasonicsounds are however also sometimes produced by maintenance or production activities at offshorestructures. All sounds in the range of 16 – 150 kHz are recorded onto an SD memory card. We usedBcAdmin 2.0 (EcoObs GmbH) to separate sound files containing bat calls from sound files with ‘noise’.The bat call recordings were analysed and identified using the automated identification softwareBcAnalyze 3 (EcoObs GmbH). As automated identification is currently not very reliable we alsoevaluated the identifications manually using the criteria provided by Barataud (2015).All monitoring data (date/time/monitoring location/number of echolocation calls/automated andmanual identification) including the bat detector status-updates are stored in a database (theBatbase). The same applied for the metadata (e.g. detector, monitoring location, monitoring period).10 of 52 Wageningen Marine Research report C090/17
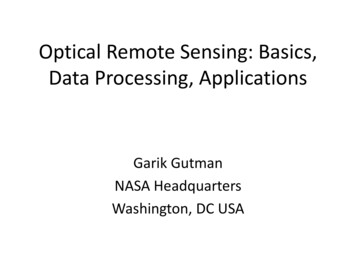
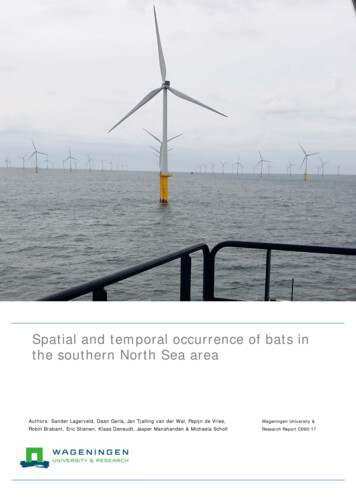
The properties of each field in the Batbase are pre-defined (and enforced) in order to ensure thequality of the data.Environmental data are not stored in the database. Weather data are maintained by the RoyalNetherlands Meteorological Institute (KNMI) and can be retrieved per weather station directly from theKNMI website (http://www.knmi.nl). The same applies to sunrise/sunset and lunar cycle data whichare also available from the internet (http://aa.usno.navy.mil/data/docs/RS OneYear.php). Allenvironmental data were retrieved at 29 May 2017.Data extracted from the Batbase are processed to obtain a dataset in which one or more recordingsare allocated to a certain time interval with an indication of whether bat detection had occurred in thatparticular time interval. Time intervals where bats were not recorded are also flagged. All timeintervals have the same length with a chosen interval length (e.g. 10 minutes, 1 hour, 1 night). Timeintervals that lie entirely in the daylight period (between sunrise and sunset) are excluded from thedataset. Intervals that overlap only partially with a daylight period are, however, included. Timeintervals are distributed over the night in such a manner that the amount of daylight time in the firstinterval equals the amount of daylight time in the last interval of each night.Next, to each bat monitoring location a KNMI (Royal Netherlands Meteorological Institute) weatherstation was assigned which was assumed to have weather representative for the bat monitoringlocation. Weather stations were assigned to monitoring locations based on proximity to the monitoringstation and quality of the weather data required for the interval data. Here, quality was determined bythe amount of missing data and obvious errors (for example, at one weather station the atmosphericpressure was constant over weeks from a certain moment onwards). Because for several monitoringstations no satisfactory weather data could be found from a single weather station we averaged thedata from KNMI offshore stations 203 PB11 (52 21' N 03 20' E) and 212 Hoorn-A (52 55' N 04 09'E) with missing data removed before averaging (if both data were missing, the result was a missingvalue). We used these data for the monitoring locations C-Power offshore high voltage station (OHVS),Belwind OHVS, Europlatform, Lichteiland Goeree, Luchterduinen OHVS, PAWP OHVS, Wintershallplatform P6-A, IJmuiden meteo mast, Engie platform K12-BP and Engie platform L10A-AC. We useddata from offshore weather station 239 F3-FB-1 for the monitoring locations Gemini OHVS 2Buitengaats and Fino3. Data from the land based stations 310 Vlissingen (51 27' N 03 36 E) wereused for Oostende, Neeltje Jans mast & Hoek van Holland radar mast 3 and 235 De Kooy/Den Helder(52 56' N 04 47' E) were used for 3D mast Egmond and Afsluitdijk. A map of the locations of theoffshore KNMI weater stations is shown in figure 2.2.Wageningen Marine Research report C090/17 11 of 52
Figure 2.2Offshore KNMI weather stations (source www.knmi.nl)The KNMI weather data are stored per hour (00:00, 1:00. 23:00). If a time interval falls betweentwo hour-values, then the average was used as the weather parameter for that particular interval. Ifthe interval is longer than one hour, the average of all hour-values included in the time interval wasused as the value of the weather parameter.The weather variables included in the dataset are: wind direction averaged over the last 10 minutes,wind speed averaged over the last 10 minutes measured at an altitude of 10 m above sea level,temperature at 1.5 m height, atmospheric pressure at sea level, horizontal visibility in meters, cloudcover in octants, relative humidity at 1.5 m and rain. For the latter variable a 1 indicates it did occur inthe last hour, 0 indicates it did not, an average over hourly data of these indicates the fraction ofhours in which the weather condition did occur. Definitions and background information on themeasurements of the weather parameters can be found athttp://projects.knmi.nl/hawa/pdf/Handbook H01 H06.pdf.Horizontal visibility in the meteorological data from the KNMI is given as a range of visibility in whichthe observation lies, expressed in meters. We transformed these ranges to a numerical value bytaking the midpoint of the range (also in measured in meters).The average of any weather parameter is simply the arithmetic mean, except for wind direction. Theaverage of this parameter was calculated by:a mean atan2(sum i(sin(a i)), sum i(cos(a i))) mod 2*piwhere a mean is the wind direction measured in radians, a i is the i th wind direction to be averaged(measured in radians) and atan2 is the arctangens function with two arguments, as implemented inthe R programming language.12 of 52 Wageningen Marine Research report C090/17
2.4Statistical analysesWe only included Nathusius’ pipistrelle in the analysis as this species is the most frequently recordedspecies at the North Sea. Due to a limited amount of data in spring we analysed the latesummer/autumn data from mid-August (day number 225) until late October (day number 395). Weperformed two separate analyses; one for the land-based stations and one for the offshore monitoringstations. For the analysis of the offshore data we only used the data from the monitoring locations offthe western coastline as these locations are likely to receive bats from the Netherlands and Belgium.We did not use the data from Fino3 and Gemini as it seems likely that bats recorded here originatefrom areas further away (Germany and Denmark).Since bats are nocturnal it makes more sense to analyse their occurrence per night instead of acalendar day. An analysis per hour resulted in a 98% zero-inflation for the offshore dataset whichmade a proper analysis impossible. Therefore we used the presence per night as response variable forboth analyses. In order to investigate spatiotemporal patterns we modelled the response variable as afunction of the covariates and applied the following model.Y i Bernoulli(Pi i)E(Y i) Pi ivar(Y i) Pi i * (1 - Pi i)logit(Pi i) Intercept CovariatesCovariates included in both analyses were night in year, moon illumination; the fraction of theilluminated Moon's visible disk and the weather parameters cloud cover, ranging from 0 okta (cloudsabsent) to 8 okta (completely overcast), atmospheric pressure in mB, fraction of hour intervals withrain, temperature in oC, visibility in km, humidity in %, wind direction in degrees and wind speed inm/s. All fixed covariates were continuous.We used the protocol provided by Zuur & Ieno (2016) as guidance for the actual analysis in R (R CoreTeam 2014). During the da
For quite some time there have been indications of bat movements over the North Sea. Observers of bird migration at the Dutch coast regularly report bats flying in from sea (Lagerveld et al. 2014a). Bats have also been observed during ship-based bird surveys in the North Sea and have been fou