Transcription
Radar Ornithology and the Conservation of Migratory Birds1Sidney A. Gauthreaux, Jr.2 and Carroll G. Belser3AbstractIt is possible to study with surveillance radar the movements of migrating birds in the atmosphere at differentspatial scales. At a spatial scale within a range of 6kilometers, high-resolution, 3-centimeter wavelengthsurveillance radar (e.g. BIRDRAD) can detect the departure of migrants from different types of habitatwithin a few kilometers of the radar. The radar operatorcan also sample the flight speeds of targets in anattempt to classify birds by their velocity. At a largerspatial scale (10-60 kilometers), Doppler weather surveillance radar (WSR-88D) can be used to measure thedensity of birds in the radar beam as they begin amigratory movement (exodus) within 60 kilometers ofthe radar. Within minutes of the onset of nocturnalmigration, the distribution and density of echoes in theradar beam can provide information on the geographical sources of migrants on the ground (migrationstopover areas), and satellite imagery can be used toidentify the topography and habitat type that characterizes these areas. At a continental scale, the nationalnetwork of WSR-88D radars can be used to monitorbird migration over the United States on an hourlybasis at different altitudes dependent on distance fromthe radar. The latter achievement is significant becauseit provides a means of monitoring the season-to-seasonand year-to-year variation in the patterns of migrationat different altitudes for different geographical regionsand the nation as a whole.Key words: bird, conservation, habitat, migration,radar, scale, stopover areas.IntroductionIn the early 1940s shortly after its invention, ornithologists began using radar to study the movements of birds1A version of this paper was presented at the Third International Partners in Flight Conference, March 20-24, 2002,Asilomar Conference Grounds, California.2Department of Biological Sciences, Clemson University,Clemson, South Carolina 29634-0326. E-mail: sagth@clemson.edu3Department of Biological Sciences, Clemson University, Clemson, South Carolina 29634-0326.through the atmosphere (Eastwood 1967). Investigatorsbegan using low-powered surveillance radars (airplaneand marine units) to monitor the movements of birdswithin a range of a few kilometers of the radar in theearly 1960s (Graber and Hassler 1962, Casement 1966,Flock 1972, Williams et al. 1972). Since that time, lowpowered (5-25 kW) marine radars have been used tomonitor bird migration and assess the impact of transmission lines, wind turbines, and other man-madestructures on bird movements (Gauthreaux 1985,Cooper et al. 1991, Harmata et al. 1999, Deng andFrederick 2001) and to monitor the movements ofendangered and threatened species between feeding andbreeding areas (Bertram et al. 1999, Burger 2001).Researchers have also used high-powered weather andairport surveillance radars to detect migrating birds atranges out to 240 km (Flock 1968; Gauthreaux 1970;Gauthreaux and Belser 1998, 1999; Koistinen 2000) andhave used long term data sets to monitor the decline inmigratory birds returning from the tropics (Gauthreaux1992). These studies demonstrate how radar can beused in the conservation of migratory birds, and in thispaper we discuss some new approaches to the conservation of migratory birds using radar ornithology.BIRDRADWe currently have four projects with a radar we callBIRDRAD (bird radar). All of the projects emphasizebird movements studied at small spatial scales (withina range of 6 km) but the radar can detect large flocks ofbirds (migrating raptors) at ranges out to 15 km. Theunit is a high resolution, marine surveillance radar(Furuno 2155 BB) with a 50 kW transceiver that transmits at 3 cm (X-band, 9415 MHz 30 MHz) wavelength at pulse lengths from 0.07 µsec to 1.2 µsecdepending on the range selected (fig. 1A). The blackbox (BB) version eliminates the large radar monitorbecause the radar processor is in a flat black boxmounted on a wall (fig. 1B) and the video display canbe virtually any size non-interlaced, multi-sync personal computer monitor (CRTs as well as flat panelcolor LCDs with SXGA – 1280 x 1024 – resolution).Instead of the slotted waveguide array (T-bar) antennawe use a parabolic antenna (1 m diameter) attached tothe transceiver unit by a special mount (fig. 1A). Thisconfiguration produces a beam of 2.5º that can beelevated from 0º to 90º.USDA Forest Service Gen. Tech. Rep. PSW-GTR-191. 2005871
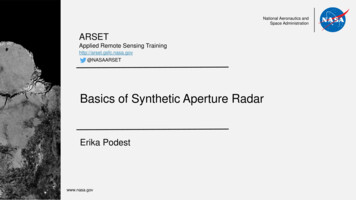
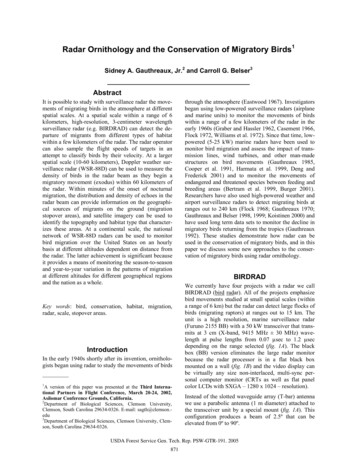
Radar Ornithology and Conservation—Gauthreaux and BelserABCDEFFigure 1— The high-resolution surveillance radar BIRDRAD. (A) The parabolic antenna-antenna mount-transceiverattached to metal cart. The transceiver is connected to the radar processor and electrical power with an 18.2 m cable; (B)the black box radar processor is attached to the left wall of the utility trailer and other power packs (e.g., rectifier) and a GPSdisplay are mounted on the forward wall. The radar display controller keyboard, the personal computer, and monitor are onthe desktop; (C) a radar image (5.6 km or 3 nautical mile range and 30 antenna elevation) showing the arrival of flocks oftrans-Gulf migrants over the southwestern Louisiana coast on 22 April 2001 at 20:19 UTC; (D) a radar image (1.42 km or0.75 nautical mile range and 22 antenna elevation) showing a stream of migrating raptors during the glide phase overBentsen-Rio Grande Valley State Park, Texas on 4 April 2001 at 15:51 UTC; (E) a radar image (1.42 km range and 22 antenna elevation) showing the beginning of an exodus of migrants from Bentsen-Rio Grande Valley State Park, Texas onthe evening of 9 April 2001 at 01:27 UTC. More bird targets are departing from the area just north of the radar site (abovecenter) where trees have thicker foliage than from the area just south of the radar site (below center) where trees have lessfoliage and are dying; (F) a radar image (2.84 km or 1.5 nautical mile range and 10 antenna elevation) showing thedeparture of waterfowl from wetlands to the lower left of the display at Pt. Mugu Naval Air Station, Ventura, CA. In images CE the echo trail color is green; in image F the echo trail color is blue. Echo-trails are set for 30 sec.USDA Forest Service Gen. Tech. Rep. PSW-GTR-191. 2005872
Radar Ornithology and Conservation—Gauthreaux and BelserMoving targets on the radar display are readily detected because of the radar's echo-trail feature. The current position of a target is shown in one color while theprevious positions of the target are shown in a differentcolor (figs. 1C-F). Echo-trail duration can be selectedfrom 30 sec to continuous. Because targets may leavethe radar beam before 30 sec or enter the beam after thestart of a 30 sec sample, it is not possible to determinethe speed of movement from echo trails. It is alsopossible to plot manually the speed and direction of 10individual targets on the display using an electronicplotting aid (EPA). A target is marked and then after aperiod of time (at least 30 sec) the target is markedagain and the following data are generated on the display: range, and speed and direction of movement. Theradar is also integrated with a Geographical PositioningSystem (GPS) so that the latitude and longitude oftargets under the control unit cursor can be easily determined. All pertinent radar data (e.g., mode, pulselength, echo-trail length, date, time, and GPS coordinates) are displayed as alpha-numerics in the image.Additional characteristics of the Furuno 2155 BB canbe found at the Furuno web site (http://www.furuno.com/).We record radar images with a frame grabbing board(Foresight Imaging HI*DEF Accura) in a Pentiumprocessor personal computer. Auto-SYNC softwareautomatically configures the HI*DEF Accura board tothe radar analog video source and the software alsoenables individual image capture at original resolution(SXGA – 1280 x 1024). Images are saved in a bitmapfile format. We are currently using BIRDRAD tomonitor the arrival of trans-Gulf migrants on the northern coast of the Gulf of Mexico (fig. 1C), the migrationof raptors through south Texas in the spring (fig. 1D)and South Carolina in the fall, the exodus of migrantsfrom different types of habitat (fig. 1E), and birdmovements in the vicinity of military airfields (fig. 1F).The benefits of using BIRDRAD to study themovements of birds through the atmosphere outweighthe costs. The radar unit is less expensive (about 30,000 US) than larger more powerful surveillanceradars and can be easily moved from location to location and operated on a gasoline generator. Because ofthe high resolution of the radar (short pulse length andnarrow beam width) we can often see the shapes oflarge flocks and can estimate altitudes of targets. Theecho trail and EPA plotting features provide detaileddata on the direction and speed of target movement. Byusing a frame grabber we do not need to photographthe video display. Ground clutter (radar echoes returned from stationary ground objects) can sometimesdominate a display, but it is still possible to detectmoving targets (fig. 1F). The radar would be moreuseful if it displayed quantitatively the reflectivity oftargets, had moving target indicator (MTI) circuitrythat displayed only moving targets without stationaryground clutter, and provided radial velocity of targets.However these features would greatly increase the costof the radar.WSR-88D (Doppler WeatherSurveillance Radar)We currently have two projects that use the WSR-88D.One emphasizes the mapping of migration stopoverareas throughout the United States and monitoringinput to and output from those areas. The other concerns mapping the distribution and abundance patternsof migration over the United States based on data fromthe national network of WSR-88D stations. The WSR88D (referred to as NEXRAD for next generation radarduring the developmental and early operational years)has a peak transmitter power of 750 kW and a frequency range of 2.7 GHz to 3.0 GHz (10.3-11.1 cm or Sband). The antenna is 9 m and the beam width is 0.96ºwith pulse widths of 1.57 µsec to 4.5-5.0 µsec. Thecharacteristics of bird echoes on the WSR-88D and itsuse for studying bird movements can be found inGauthreaux and Belser (1998, 1999).Migration Stopover AreasWe use two WSR-88D products: base reflectivity andbase velocity images to detect migration stopover areasduring spring and fall. The base velocity image showsthe radial velocity of radar echoes and is used withwinds aloft data to distinguish birds from other reflectors in the atmosphere. The 2-5 reflectivity images thatshow the beginning of bird migration on a given nightand are free of obscuring precipitation or other radarinterference within 120 km of the radar are compiledfor further processing. Generally from 8 to 17 nightsper site per year meet the above criteria. The reflectivity images are then processed to emphasize areas ofhigh relative bird density (birds km-3) and the resultingimagery is converted to rectangular raster and importedinto ArcInfo. The map showing important migrationstopover areas is then compared with land cover mapsbased on classified Landsat data (figs. 2A and B).Preliminary findings suggest that most stopover areasalong the Gulf and Atlantic Coasts are associated withfloodplain topography and upland areas are used less.Forested wetlands are used almost exclusively as important stopover areas and extensive pine flatlands arerarely used (Gauthreaux, unpubl. data).USDA Forest Service Gen. Tech. Rep. PSW-GTR-191. 2005873
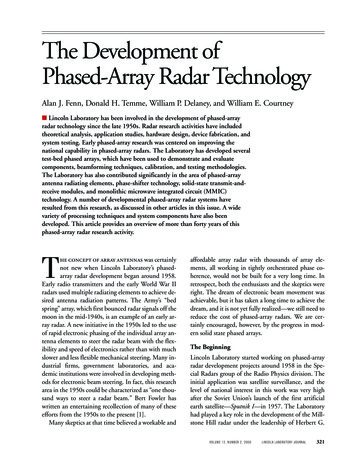
Radar Ornithology and Conservation—Gauthreaux and BelserABCFigure 2— WSR-88D migration projects. (A) migration stopover areas based on radar data from southwestern Louisianacollected during spring migration from 1998 through 2001. All the pixels represent bird densities at least 0.5 standarddeviations above the mean, (B) classified forest type from LANDSAT data showing deciduous forested wetlands (brown),evergreen pine forest (light green) and mixed deciduous and pine forest (dark green). Migration stopover areas areassociated with the floodplain forest, (C) national migration map for the nights 4-9 May 2000 showing the mean density anddirection of migration between 108 and 1724 m above ground level. The colors represent mean numbers of birds km-3 (seetext for additional details).Mapping Patterns of Migration over theUnited StatesTo construct national migration maps of the relativedensity and direction of bird migration for each nightduring spring and fall we used two WSR-88Dproducts—base reflectivity and base velocity images.Images were collected each night between 2-3 hoursafter sunset and near the peak of a night's migrationfrom each of 70 WSR-88D stations near weatherstations that measured winds aloft, because winds aloftdata were necessary for subsequent processing of radarimagery. Each station reflectivity image was previewedto eliminate those containing obscuring weather orother interference. To determine the extent of insectcontamination or other aerial plankton in an image, weused winds aloft data. The tabular wind data from theatmospheric sounding (radiosonde) were converted toraster GIS to produce a wind base velocity product, andthis product was used to threshold the radar basevelocity raster data. If the mean radial velocity of aresolution cell (pixel) did not exceed a threshold of 10knots above the radial velocity of the wind, theresolution cell was eliminated. The surviving radarbase velocity raster data (containing velocities appropriate for birds) were used to mask the radar baseUSDA Forest Service Gen. Tech. Rep. PSW-GTR-191. 2005874
Radar Ornithology and Conservation—Gauthreaux and Belserreflectivity data so that only reflectivity resolution cellscontaining velocities defined as birds were selected.We then used velocity to infer direction by finding thedirection of maximum outgoing velocity within analtitudinal zone (table 1) and then calculating the meannumber of birds km-3 in a 30 wedge centered on thatdirection. In the map an arrow shows the direction ofmigration for a radar station, and the color of the arrowindicates the average number of birds km-3 in the 30 wedge (fig. 2C). As the radar beam moves out from thelocation of the radar it samples increasing altitudes.Because of the expansion of the radar beam, its tilt, andthe curvature of the earth, at increasing ranges thealtitudinal strata sampled by the radar beam overlap(table 1). Because of this we generate a migration mapfor each altitudinal zone.Literature CitedBertram, D. F., L. Cowen, and A. E. Burger. 1999. Use of radarfor monitoring colonial burrow-nesting seabirds. Journalof Field Ornithology 70: 145-157.Burger, A. E. 2001. Using radar to estimate populations andassess habitat associations of marbled murrelets. Journalof Wildlife Management 65: 696-715.Casement, M. B. 1966. Migration across the Mediterraneanobserved by radar. Ibis 108: 461-491.Cooper B. A., R. H. Day, R. J. Ritchie, and C. L. Cranor. 1991.An improved marine radar system for studies of birdmigration. Journal of Field Ornithology 62: 367-377.Deng, J., and P. Frederick. 2001. Nocturnal flight behavior ofwaterbirds in close proximity to a transmission powerline in the Florida Everglades. Waterbirds 24: 419-424.Eastwood, E. 1967. Radar ornithology. London: Methuen; 278 p.Table 1ņ The altitudes sampled by the WSR-88D witha 0.96 beam width when the antenna is tilted 0.5 above the horizontal.Range from radarantenna to 40 km40 km to 80 km80 km to 120 km120 km to160 kmaAltitudes sampled (AAH)aantenna height to 754 m108 m to 1724 m431 m to 2909 m970 m to 4309 mFlock, W. L. 1968. Monitoring bird movements by radar.IEEE Spectrum 5:62-66.Flock, W. L. 1972. Flight safety aspects of precision radarnear air bases in bird-aircraft collision avoidance.Technical Report No. AFWL-TR-72-25. Kirkland AirForce Base, NM: Air Force Weapons Laboratory, Air ForceSystems Command; 66 p.Gauthreaux, S. A., Jr. 1970. Weather radar quantification ofbird migration. BioScience 20: 17-20.Above radar levelThe use of a standardized procedure to generate national migration maps based on radar data will not onlydocument the temporal and spatial patterns of migration for four altitudinal zones nationwide but alsopermit quantitative season-to-season and year-to-yearcomparisons among different regions of the UnitedStates (Gauthreaux et al. 2003). In the long term themaps can be used to monitor the health of the NorthAmerican bird migration system.Gauthreaux, S. A., Jr. 1985. Radar, electro-optical, and visualmethods of studying bird flight near transmission lines.EPRI EA-4120, Palo Alto, CA: Electric Power ResearchInstitute; 76 p.Gauthreaux, S. A., Jr. 1992. The use of weather radar to monitor long term patterns of trans-Gulf migration inspring. In: J. M. Hagan and D. W. Johnston, editors. Ecology and conservation of neotropical migrant landbirds.Washington, DC: Smithsonian Institution Press; 96-100.Gauthreaux, S. A., Jr. and C. G. Belser. 1998. Displays of birdmovements on the WSR-88D: Patterns and quantification. Weather and Forecasting 13: 453-464.Gauthreaux, S. A., Jr. and C. G. Belser. 1999. Reply to Blackand Donaldson. Weather and Forecasting 14: 1041-1042.AcknowledgmentsRadar work at the Clemson University Radar Ornithology Laboratory is supported by the Department ofDefense, Legacy Resource Management Program andthe Department of the Navy, Naval Facilities Engineering Command Headquarters. Houston Audubon Society provided initial funding for our WSR-88D workalong the northeastern Gulf coast of Texas. We wish tothank D. Van Blaricom and A. Cunningham for theirwork on the file format of the WSR-88D products,development of computer programs and GIS work. Weappreciate the helpful reviewer comments from D.Bonter and R. Millikin.Gauthreaux, S. A., Jr., C. G. Belser, and D. Van Blaricom. 2003.Using a network of WSR88-D weather surveillance radars to define patterns of bird migration at large spatialscales. In: P. Berthold, E. Gwinner, and E. Sonnenschein,editors. Avian Migration. Germany: Springer-Verlag; 335-345.Graber, R. R. and S. S. Hassler. 1962. The effectiveness of aircraft-type (APS) radar in etecting birds. Wilson Bulletin74: 367-380.Harmata, A. R., K. M. Podruzny, J. R. Zelenak, and M. L.Morrison. 1999. Using marine surveillance radar tostudy bird movements and impact assessment. WildlifeSociety Bulletin 27: 44-52.Koistinen, J. 2000. Bird migration patterns on weatherradars. Physics and Chemistry of the Earth (B) 25: 11851193.Williams, T. C., J. Settel, P. O’Mahoney, and J. M. Williams.1972. An ornithological radar. American Birds 26: 555-557.USDA Forest Service Gen. Tech. Rep. PSW-GTR-191. 2005875
it provides a means of monitoring the season-to-season and year-to-year variation in the patterns of migration at different altitudes for different geographical regions and the nation as a whole. Key words: bird, conservation, habitat, migration, radar, scale, stopover areas. Introduction I