Transcription
LOW FLOW STATISTICS TOOLSA How-To Handbook for NPDES Permit tober 2018Office of Water
[This page was intentionally left blank]i
DisclaimerThe U.S. Environmental Protection Agency (EPA) Office of Water, through its Office of WastewaterManagement, funded the preparation of this report under EPA Contract No. EP-C16-0003. Any opinions,findings, conclusions, or recommendations do not change or substitute for any statutory or regulatoryprovisions. This document does not constitute a regulation, impose legally binding requirements, conferlegal rights, impose legal obligations, or implement any statutory or regulatory provisions. Thishandbook is a living document and may be revised periodically without public notice. EPA welcomesinput on this report at any time. Mention of trade names or commercial products is not intended toconstitute endorsement or recommendation for use.AcknowledgementsThis document was notably improved by input from USGS and several NPDES permit writersrepresenting both EPA and state programs.Photos reproduced on the cover of this document were provided courtesy of PG Environmental, ZakErickson, and Anthony D’Angelo.ii
[This page was intentionally left blank]iii
Disclaimer. iiAcknowledgements. ii12345An Introduction to Low Flow Statistics and This Handbook . 1-11.1Who Is the Intended Audience for This Handbook? . 1-11.2What Is a Low Flow Statistic?. 1-11.3What Topics Does This Handbook Cover? . 1-21.4What Software Tools Are Discussed in This Handbook? . 1-21.5When Should I Use Each of These Tools? . 1-2Investigating the Watershed . 2-12.1Introduction . 2-12.2Step-by-Step Instructions for Exploring with StreamStats . 2-1Estimating Low Flow Statistics with SWToolbox and WREG. 3-13.1Introduction . 3-13.2Using SWToolbox to Estimate Low Flow Statistics on a Gaged Waterbody . 3-13.3Using WREG to Estimate Low Flow Statistics on an Ungaged Waterbody . 3-8Frequently Asked Questions . 4-14.1General Questions . 4-14.2Troubleshooting Tips . 4-6References . 5-1Appendix A: K Values Tables . A-1iv
1 An Introduction to Low Flow Statistics and This Handbook1.1 Who Is the Intended Audience for This Handbook?National Pollutant Discharge Elimination System (NPDES) permit writers often need to calculate low flowstatistics for reasonable potential analyses and water quality-based effluent limitation (WQBEL)calculations or to confirm estimates provided by the permittee during the NPDES permit developmentprocess. The typical calculation procedures for low flow statistics are complex and cumbersome toexecute by hand or with spreadsheet-based tools. However, several software applications that greatlysimplify this process are available to permit writers. The purpose of this handbook is to help permitwriters estimate low flow statistic values in a variety of situations using these free, publicly availabletools.1.2 What Is a Low Flow Statistic?Low flow statistics are estimates of the lowest flow event in a stream or river that would be expected tooccur over some period of record. NPDES permit writers typically use these estimates when authorizinga regulatory mixing zone and associated dilution credits or dilution factors for use in reasonablepotential analyses and/or WQBEL calculations. As described inSection 3.2 of EPA’s Technical Support Document for WaterMost permitting authoritiesQuality-based Toxics Control (hereafter, the Technical Supportuse either the term “credit” orDocument), EPA recommends that authorized dilution credits“factor” to refer to the level ofreflect the behavior of a permitted discharge as it mixes with thedilution authorized in a permit.receiving water. In flowing rivers and streams, dilution credits areFor convenience, thisbased on the critical conditions of the receiving water, which aretypically defined in the applicable water quality standards (e.g.,document primarily uses the7Q10 receiving water flow). Critical conditions are conservativelyterm “dilution credit,” but bothbased on receiving water low flow estimates to ensure theare equally valid terms.discharge does not cause or contribute to an excursion abovewater quality standards.Low flow values are defined on a hydrologic design or biological design basis. Both are equallyacceptable for use in NPDES permitting. Low flow values are expressed in terms of their averagingperiod (for example, a 4-day average flow or a 7-day average flow) and their recurrence frequency(generally once in 10 years for hydrologically based flows and once in 3 years for biologically basedflows).A hydrologically based low flow is computed using the single lowest flow event from each year ofrecord, followed by application of distributional models (typically the Log Pearson Type III distribution isassumed) to infer the low flow value. The 1Q10 is the lowest one-day average flow that occurs (onaverage) once every 10 years. The 7Q10 is the lowest 7-day average flow that occurs (on average) onceevery 10 years.A biologically based low flow is computed based on all low flow events within a period of record, even ifseveral occur in one year, and reflects the empirically observed frequency of biological exposure duringa period of record. The 4B3 is the lowest four-day average flow that occurs once every three years. The1B3 is the lowest one-day average flow that occurs once every three years.An Introduction to Low Flow Statistics1-1
1.3 What Topics Does This Handbook Cover?Section 2: Investigate the Watershed—Are there stream gages in the watershed of interest? Where arethey and are they useful to the permit writer? This section will provide the permit writer with strategiesfor finding and evaluating appropriate streamflow data sources using the StreamStats web application.Section 3: Estimating Low Flow Statistics with SWToolbox and WREG—After exploring the watershedand identifying the available data sources, this section will guide permit writers with tips for loading dataand managing settings to obtain the low flow estimates needed for NPDES permit development.Section 4: Frequently Asked Questions—This section will answer some questions that arise frequentlywhen permit writers estimate low flow statistics.1.4 What Software Tools Are Discussed in This Handbook?This handbook will discuss three pieces of software: StreamStats, SWToolbox, and WREG. The U.S.Geological Survey (USGS) distributes all three of these publicly available tools on the web.StreamStatsStreamStats (version 4) is a web application that provides access to an assortment of geographicinformation system (GIS) analytical tools that are useful for water resources planning and management,as well as engineering and design purposes. StreamStats is an excellent tool for mapping and exploringthe drainage area and stream gages near a discharge location of interest. The StreamStats webapplication can be accessed at: Toolbox is a desktop application that builds upon past tools, such as SWSTAT and DFLOW, whichpermit writers have historically used to estimate low flow statistics from stream gage data. SWToolboxallows users to compute n-day frequency analyses (i.e., 1Q10 or 7Q10) and biologically based flows. Italso facilitates the use of USGS National Water Information System (NWIS) streamflow data, as well asuser-provided data files. The SWToolbox desktop application can be downloaded at:https://water.usgs.gov/osw/swtoolbox/WREGWREG is a desktop application that is used to develop a regional estimation equation for streamflowcharacteristics (e.g., low flow values). Users can apply these estimates at ungaged basins, or use them toimprove the corresponding estimate at continuous-record streamflow gages with short records. Theregional estimation equation results from a multiple-linear regression that relates observable basincharacteristics, such as drainage area, to streamflow characteristics. The desktop application andadditional supporting documentation for WREG can be downloaded at:https://water.usgs.gov/software/WREG/1.5 When Should I Use Each of These Tools?When deciding which of these tools to use and when to use them, you should consider: The specific need you are attempting to address.The data and information available to you.The uses of the tools at your disposal.An Introduction to Low Flow Statistics1-2
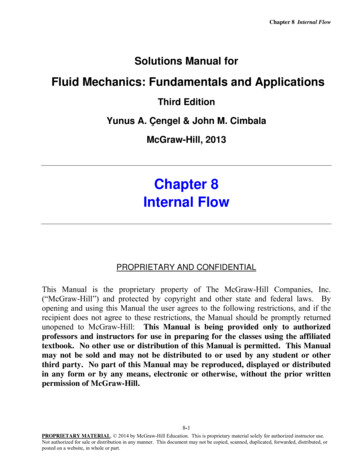
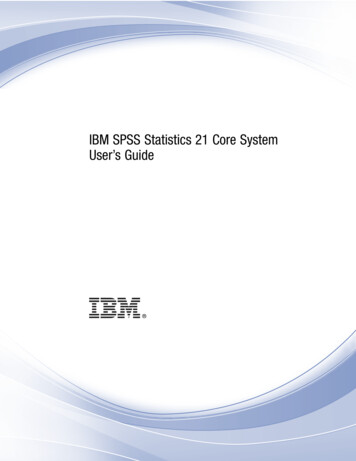
Figure 1 displays a decision tree flowchart to help you evaluate these questions and pick the right toolfor the job.Figure 1. A decision tree for evaluating which tool to use when calculating low flow statistics.An Introduction to Low Flow Statistics1-3
2 Investigating the Watershed2.1 IntroductionYour first step when estimating low flow statistics during the permit writing process is to take stock ofthe character and quantity of information available to you. You should identify the following pieces ofinformation: The location of the permitted discharge for which you are seeking a dilution creditauthorization.The availability, location, and proximity of any flow gages upstream or downstream of thedischarge location.The presence and location of any impoundments, tributaries, water withdrawals, otherdischarges, or other factors that might influence the quantity of flow occurring at the dischargelocation.The availability of flow gages within nearby drainage basins if the stream segment where thedischarge is occurring is ungaged.In addition, once you identify stream gages, you should evaluate the quality and quantity of historicalflow data available for estimating low flow values.Several tools are available to help locate USGS flow gages and explore the watershed. The principal tooldiscussed in this section is USGS’s StreamStats web application. However, you may also find thefollowing alternative resources useful: USGS’s NWIS website provides direct links to a variety of USGS monitoring sites—includingstreamflow gages—through a searchable map interface at:https://nwis.waterdata.usgs.gov/nwisSWToolbox also includes a GIS interface allowing users to visually explore a watershed andidentify potentially useful stream gage locations.Commercial satellite imagery and mapping software (e.g., Google Earth or similar) may be usefulfor locating the permitted discharge outfall on the waterbody of interest and for identifyingother points of interest.StreamStats provides a GIS interface like that of the NWIS website, but also provides additional mappingand drainage area delineation tools that may be useful. You can access StreamStats online athttps://water.usgs.gov/osw/streamstats/ by selecting the “StreamStats Application” button on thenavigation bar.2.2 Step-by-Step Instructions for Exploring with StreamStatsNext, let’s discuss some step-by-step instructions a permit writer can use when investigating thewatershed with StreamStats. Illustrations accompany the instructions, which you can use to follow alongon your own computer. The illustrations depict the process of locating potential stream gages for theCookeville Wastewater Treatment Plant located at 1870 South Jefferson Ave., Cookeville, Tennessee.The plant discharges to Pigeon Roost Creek, which is a tributary to the Falling Water River.Investigating the Watershed2-1
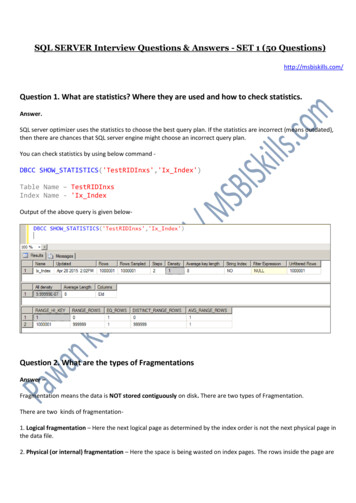
Step 1.After opening the web application, search for a location of interest in the search bar. You cansearch using a street address or latitude and longitude coordinates for the facility.Step 2.Select the appropriate “State or Regional Study Area” that is presented in the search window.If an appropriate option does not appear, you should revisit the location information used inthe search and verify its accuracy, or try using different search information.Step 3.Navigate to the discharge location of interest and zoom in until the stream network datalayer (i.e., a pixelated, blue tracing of the local stream) appears.Investigating the Watershed2-2
Step 4.Click the “Delineate” button on the left-hand toolbar, then click on the discharge locationwithin the waterbody. After processing for several moments, StreamStats will display theupstream portion of the basin network that drains to the discharge location.Step 5.Using the map interface, explore nearby locationsupstream and downstream of the discharge forstreamflow gages. If gages are unavailable,examine nearby watersheds that are similar to thedrainage area into which the permitted outfalldischarges.After identifying relevant stations, click on theiricons to find links to their NWIS and StreamStatspages.Investigating the WatershedStreamStats will present differentsites using various colors todenote useful information foreach gage station. Expand the“National Layers” button in thelegend to show an expandedlegend explaining each symbolused in the map.2-3
The NWIS page provides facts about the area that drains to the station (e.g., total drainagearea and contributing drainage area), as well as the monitoring beginning date, monitoringending date, and number of records available for the site.On the StreamStats page, you can find additional USGS information for the site, which mayinclude pre-calculated low flow statistics. If the appropriate low flow statistic you are seekingis listed on the page, you should obtain the original research report that documents theestimate. You should then verify that the period of record and other factors the estimate isbased upon are appropriate to the circumstances of your permit authorization before usingthe estimate. Most direct estimates reported on the StreamStats gage webpage will be basedon streamflow measurements that are less recent than those available to the permit writer.For more information on identifying the underlying references these estimates are basedupon, please refer to Section 4, “Frequently Asked Questions.”Step 6.Based on the available information, you should decide whether sufficient data exist on thestream segment of interest to directly calculate low flow statistics using SWToolbox, or if youshould base your estimate on a regression of nearby watershed gages using WREG. Refer toSection 1.5 of this handbook for additional discussion on making this determination. Section3 further describes the use of SWToolbox and WREG. Refer to Section 4 for more discussionon determining whether data are sufficient for use in your NPDES permit.Investigating the Watershed2-4
Step 7.Before leaving StreamStats, you should return to the discharge location’s delineation andcollect information on its size. You can do this by clicking on “Continue” and collecting thebasin characteristics, as these are likely to be useful later.StreamStats will export a “Basin Characteristics Report” as a comma separated values (.csv)file, which can be saved and viewed later using a spreadsheet application. In addition, thedelineation for the basin can be downloaded as a shapefile (or in other formats) for use inother GIS applications.In the case of the Cookeville Wastewater Treatment Plant, there are no gages upstream ofthe permitted outfall, but there are two downstream gages. The first is approximately 1.8miles downstream (Station ID No. 03422900) but does not have data available for downloador information on any data associated with the station. The second is 4 miles downstream onthe Falling Water River (Station ID No. 03423000) and has data available for download datingfrom 1932 to 2018.In general, the first station is preferable in terms of its location (i.e., nearby and on the samestream segment); however, the flow data are not available for review. The second station,while farther downstream, is likely to be representative and has a substantial amount of dataavailable for use.Investigating the Watershed2-5
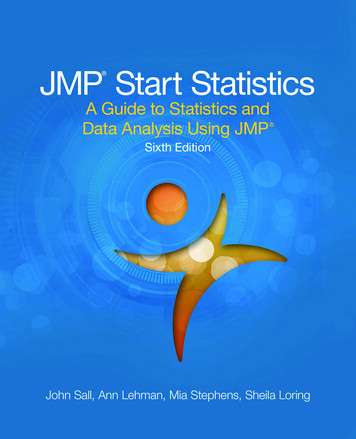
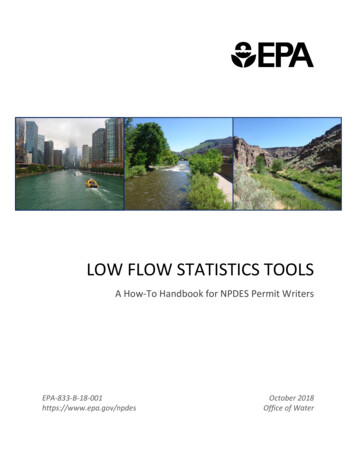
3 Estimating Low Flow Statistics with SWToolbox and WREG3.1 IntroductionIn this section, we will discuss how to use SWToolbox and WREG to estimate low flow statistics. Asdiscussed in Sections 1 and 2, you would use SWToolbox for situations where the permittee’s outfalllocation and a stream gage are on the same stretch of astream or river. WREG is typically used when it is notpossible to directly measure the waterbody’s low flowSome experienced readers will havestatistics. Instead, low flow statistics are calculated forused other tools, such as DFLOW,nearby, gaged basins (e.g., using SWToolbox) and relatedBasins, and SWSTAT, to estimateto the discharge location of interest via regressionlow flow statistics on a gagedequations.stream in the past. EPA and USGSThis section provides step-by-step instructions for usingdeveloped SWToolbox to replacethese applications while writing permits. This handbookthese applications. SWToolboxassumes that you will use SWToolbox to access andincorporates the functionality anddownload daily flow measurements for USGS gagecomputational methods used in allstations. However, please note that this information maythree legacy applications.also be obtained manually from the NWIS website. Formore information on manually loading data sets intoSWToolbox and WREG, or to learn about uses of thesoftware beyond calculating low flow statistics, please refer to the applications’ user manuals.3.2 Using SWToolbox to Estimate Low Flow Statistics on a Gaged WaterbodyNext, let’s walk through step-by-step instructions using SWToolbox to calculate low flow values. Thegeneral workflow when using SWToolbox is as follows:1.2.3.4.In SWToolbox, locate the flow monitoring stations identified while investigating the watershed.Import the flow station data into SWToolbox.Define the calculations you wish to run.Run the analysis.Illustrations accompany the instructions, which you can use to follow along on your own computer. Theillustrations depict the process for calculating a 7Q10 value for the City of Claremont WastewaterTreatment Plant (located at 338 Plains Road, Claremont, New Hampshire, 03743) using USGS’s nearbyStation ID No. 01152500. Both the permitted outfall and the gage are located on the Sugar River in NewHampshire, as illustrated on the StreamStats screenshot below.Estimating Low Flow Statistics with SWToolbox and WREG3-1
OUTFALLGage No01152500Step 1.Open SWToolbox and start a “New Project.”Step 2.A map of the United States will appear. Zoom and pan to the location of the stream gage tobe used (Station ID No. 01152500 in our example) to estimate flow statistics. (Hint: Add state,county, and major roads to the map in the left-hand “Legend” menu to help navigate to thelocation of interest.)Estimating Low Flow Statistics with SWToolbox and WREG3-2
Step 3.Click “Select” in the toolbar and click on the drainage basin that includes the stream gage ofinterest. The selected basin will be highlighted yellow.Step 4.Click “Build” in the “Build New USGS SW Toolbox Project” dialog window. Save the mapprojection to the default location. The software will download and then display data layersassociated with the selected basin.Estimating Low Flow Statistics with SWToolbox and WREG3-3
Step 5.Using zoom and pan, navigate to the stream gage previously identified in StreamStats. Clickon the “Identify” button in the toolbar and click on the stream gage to display identifyinginformation. The selected object will be highlighted yellow. Zoom so only the station ofinterest is visible.Step 6.Under the File menu, click “Download Data.” Adialog box will appear to select the data todownload. In the “Regions to Download”dropdown menu, select “View Rectangle.” Under“Data Values from US Geographical ServiceNational Water Information System,” select “DailyDischarge.” Click “Download” at the bottom.Estimating Low Flow Statistics with SWToolbox and WREGAlternatively, permit writerscan directly specify the gagestation if they already know itsID number from StreamStats,and they can download its databy selecting the “Station IDs”option in the “Region toDownload” dropdown menu.3-4
Step 7.A new dialog window, “Data Sources,” will appear. In the window, select the station ofinterest. (Hint: This dialog box will label stations according to their station number.) Thenselect “USGS Integrated Design Flow (IDF)” under the Analysis menu. Next, select the stationof interest and click “OK.”Estimating Low Flow Statistics with SWToolbox and WREG3-5
Step 8.The “Integrated Design Flow” window will appear. Under the “Select Dates” tab, specify “Low”in the “Flow Condition” window, the water year/season boundaries that will be used in thecalculation, and the timespan of data to include in the analysis. For more discussion on what a“water year” is and how it fits into these calculations, please refer to Section 4, “FrequentlyAsked Questions.”For our example, we will specify an April 1–March 31 water year and use all data available fromthis station (i.e., Station ID No. 01152500).Step 9.Next, click on the “N-Day, Trend, Frequency” tab. Specify the averaging period of the lowflow statistics of interest (e.g., 1 for 1Q10, 7 for 7Q10) under “Number of Days,” as well asthe recurrence interval (typically 10 for hydrologically based estimates). Make sure to leavethe “Logarithmic” toggle selected.Click on the “Frequency Grid” or “Frequency Report” buttons to calculate the values of theselected flow statistics.Estimating Low Flow Statistics with SWToolbox and WREG3-6
For this gage location, the 7Q10 flow was estimated at 34.6 cubic feet per second(22.4 million gallons per day [MGD]). You can copy the data report to the clipboard and saveit in the project file for future reference on this or subsequent permit reissuances.Step 10.Finally, make any adjustments necessary to account for differences in the locations of thepermitted outfall and stream gage. For example, if the outfall is located some distancedownstream of the gage (as is the case with the Claremont Wastewater Treatment Plant),the low flow statistic would likely be slightly greater in magnitude at the outfall location thanat the gage location. This is due to the larger area that is contributing flow to the outfalllocation. Conversely, an outfall located upstream of the gage location would have a smallerlow flow statistic.If there are no other contributors of flow between the outfall and gage location (e.g., otherpermitted discharges), and if no man-made impoundments or water withdrawal systems areintervening, you can make the adjustment using the rule of proportions (i.e., by multiplyinggage low flow value by a ratio of the outfall drainage area and the gage drainage area). Thefollowing equation demonstrates this 𝑜𝑜𝑜𝑜𝑜𝑜 𝑄𝑄𝑔𝑔𝑔𝑔𝑔𝑔𝑔𝑔 𝑔Estimating Low Flow Statistics with SWToolbox and WREG3-7
Where:QoutfallQgageAoutfallAgage Low flow statistic at outfall location Low flow statistic at gage location Area draining to outfall Area draining to gageIn general, the rule of proportions method for adjusting low flow values will provide moreaccurate results when the two drainage areas are roughly the same size. According toHortness (2006), a good rule of thumb is to apply this method when the ratio between theAoutfall/Agage is around 0.5 to 1.5.In the Claremont Wastewater Treatment Plant example, we will use the delineation tool inStreamStats (refer to Section 2, Step 7) to estimate the area of the watershed draining to theoutfall (272 square miles) and the NWIS page for Station ID No. 01152500 (269 square miles).Therefore, the 7Q10 estimate for the outfall is given �𝑜𝑜𝑜𝑜 22.4 𝑀𝑀𝑀𝑀𝑀𝑀 272 𝑠𝑠𝑠𝑠𝑠𝑠𝑠𝑠𝑠𝑠𝑠𝑠 𝑚𝑚𝑚𝑚𝑚𝑚𝑚𝑚𝑚𝑚 22.6 𝑀𝑀𝑀𝑀𝑀𝑀269 𝑠𝑠𝑠𝑠𝑠𝑠𝑠𝑠𝑠𝑠𝑠𝑠 𝑚𝑚𝑚𝑚𝑚𝑚𝑚𝑚𝑚𝑚If intervening flow sources, impoundments, or withdrawal systems exist, you may need toobtain supplementary data regarding these sources to better understand how they are likelyto influence low flows within the waterbody near the discharge.3.3 Using WREG to Estimate Low Flow Statistics on an Ungaged WaterbodyNext, let’s walk through step-by-step instructions for using WREG to calculate low flow values onungaged waterbodies. The general workflow when using WREG is as follows:1.2.3.4.5.Create input files for use in WREG.Create a WREG project directory with all input files and the WREG executable file.Run WREG and define the variables for the regression analysis.Create regression equations in WREG.Estimate dependent variables for the ungaged basin and enter them into the regressionequation to estimate ungaged basin low flow statistics.Regression relationships between basin characteristics and low flow statistics are not plug-and-playtools—once developed, the user should perform diagnostic and quality control evaluations to determinethe accuracy and reliability of the derived models. This handbook section focuses on the use of theWREG software package. More in-depth discussion of quality control evaluation diagnostics ofregression relationships is beyond its scope, but you may find the following additional resources usefulwhen designing regression models: Helsel, D.R., and R. M. Hirsch. 2002. Statistical Methods in Water Resources Techniques of WaterResources Investigations (Chapters 9–11). U.S. Geological Survey.https://pubs.usgs.gov/twri/twri4a3/.Ries, K.G., J.B. Atkins, P.R. Hummel, M. Gray, R. Dusenbury, M.E. Jennings, W.H. Kirby, H.C.Riggs, V.B. Sauer, and W.O. Thomas, Jr. 2007. The National Streamflow Statistics Program: AEstimating Low Flow Statistics with SWToolbox and WREG3-8
Computer Program for Estimating Streamflow Statistics for Ungaged Sites. U.S. GeologicalSurvey. edinger, J., and G.D. Tasker. 1985. “Regional Hydrologic Analysis: 1. Ordinary, Weighted, andGeneralized Least Squares Compared.” Water Resources Research 21: 1.WREG requires the manual creation of a variety of input files. The WREG user’s manual (Eng et al.,2009) includes detailed instructions for creating these files using Microsoft Excel or text editors, andyou should refer to this resource for the mechanics of creating the text input files. This handbookwill walk you through calculating the distributional shape parameters and basin characteristics foruse in the input files.Illustrations accompany the instructions, which you can use to follow along on your own computer.The illustrations depict the process of calculating a 7Q10 value for the City of West Liberty SewageTreatment Plant (located at 615 East A St., West Liberty, Iowa, 52776), which discharges toWapsinonoc Creek. The creek is ungaged near the discharge.Step 1.Using the gages selected, download the station timeseries data from the relevant NWISwebsites (which can be accessed through StreamStats) or following the data downloadprocedures for SWToolbox (Section 3.2, Steps 1–6).For West Liberty’s plant, we will use five gage stations located in nearby drainage areas(Station ID Nos. 05454090, 05454300, 05454500, 05455700, and 05465000).Step 2.WREG requires input files that describe site, basin, and flow characteristics for the gagelocations of interest, as well as shape parameters for the Log-Pearson Type III distributionsthat fit to the flow data for those locations. In addition, you may also include two additionalfiles when using a weighted least squares or generalized least squares regression method—when using ordinary least squares regression, these optional files are not required. Thishandbook will assume the use of a weighted least squares regression. For more informationon other regression techniques, refer to the WREG user’s manual (Eng et al., 2009) or to thesupplementary resources listed both above and in Section 4.Table 1 (reproduced from the WREG user’s manual) describes the input files needed.Table 1. WREG Input FilesFile xtDescriptionSite information and basin characteristics tobe used in the regression (the independentvariables)Flow characteristics to be used in theregression (the dependent variables)Skew for Log-Pearson Type III distributionK for Log-Pearson Type III distributionStandard deviation for Log-Pearson Type IIIdistributionEstimating Low Flow Statistics with SWToolbox and WREGWREG RequirementsAlways requiredAlways requiredAlways
handbook is a living document and may be revised periodically without public notice. EPA welcomes input on this report at any time. Mention of trade names or commercial products is not intended to . 3 Estimating