Transcription
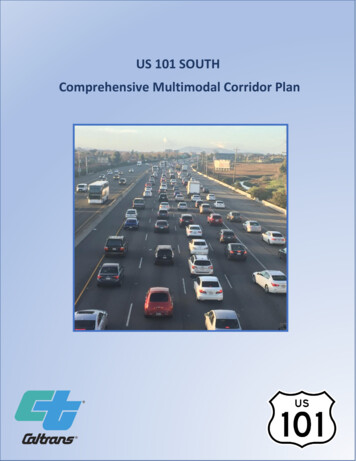
US 101 SOUTHComprehensive Multimodal Corridor Plan
US 101 SOUTHComprehensive MultimodalCorridor PlanAPPROVED BY:
I accept this Comprehensive Multimodal Corridor Plan for the US 101 South Corridor as adocument informing the regional transportation planning process.ACCEPTED BY:
Approval Recommended by:
AcknowledgmentsCaltransBrian Johnson, Associate Transportation PlannerZachary Chop, Associate Transportation PlannerFredrick Schermer, Associate Transportation PlannerMTCTherese Trivedi, Assistant Planning DirectorAdam Noelting, Principal Planner/AnalystVTACasey Emoto, Deputy Director, Mobility & Project DevelopmentMarcella Rensi, Deputy Director, Programming & GrantsAmin Surani, Principal Transportation PlannerEugene Maeda, Senior Transportation PlannerC/CAGSean Charpentier, Program DirectorSusy Kalkin, Transportation Programs SpecialistSMCTAJoe Hurley, Director, Transportation Authority ProgramSamTrans and CaltrainPeter Skinner, Manager, Grants and Fund ProgrammingSamTransMillie Tolleson, Principal PlannerSFCTAEric Cordoba, Deputy Director for Capital ProjectsMike Tan, Administrative Engineer
Table of ContentsExecutive Summary. iChapter 1: Introduction . 11.1 Caltrans Policy Development . 11.2 Senate Bill 1 and the Solutions for Congested Corridors Program . 11.3 US 101 South Corridor Planning. 21.4 Document Structure. 31.5 Stakeholders . 3Chapter 2: Corridor Goals, Objectives and Performance Measures . 5Chapter 3: Corridor Overview . 93.1 Corridor Limits . 93.2 Route Significance . 123.3 Route Designations . 123.4 Demographics . 133.5 Commute Patterns and Trip Generators . 153.6 Smart Mobility Framework, Regional Transportation Plan & Communities of Concern . 163.7 Environmental Considerations and Sea Level Rise . 28Chapter 4: Multimodal Facilities . 314.1 Transit Services . 314.2 Park-and-Ride Facilities . 374.3 Private Commuter Shuttle Services . 394.4 Bicycle and Pedestrian Facilities . 404.5 Transportation Systems Management and Operations. 464.6 Transportation Demand Management . 504.7 Broadband. 504.8 Freight Network, Facilities and Trip Generators . 54Chapter 5: Freeway Performance . 565.1 Existing Conditions . 565.2 Future Operating Conditions and Alternatives . 75Chapter 6: Public Outreach . 1006.1 Santa Clara County Valley Transportation Plan 2040 . 1006.2 San Mateo Countywide Transportation Plan 2040 . 100
6.3 San Francisco Transportation Plan 2040 . 1016.4 Plan Bay Area 2040 . 1026.5 Plan Bay Area 2050 . 1026.6 Caltrans District 4 Bike Plan . 1026.7 US 101 Mobility Action Plan. 1036.8 US 101 Express Bus Feasibility Study . 1036.9 Silicon Valley Express Lanes Program . 1046.10 San Mateo US 101 Managed Lanes Project . 104Chapter 7: Recommended Strategies . 1067.1 Project Lists . 1067.2 Project Evaluation . 139List of TablesTable ES-1. MTC Top 50 Congested Locations for US 101 South in 2017 . iiiTable 2-1. US 101 South CMCP Goals, Objectives and Performance Measures . 6Table 3-1. US 101 South CMCP Segments . 10Table 3-2. US 101 South Route Designations. 13Table 3-3. Demographic Data of US 101 South Corridor . 14Table 3-4. Commute Choice by Mode . 15Table 3-5. Place Type Descriptions . 19Table 3-6. Transportation Strategies Examples . 19Table 3-7. Environmental Consideration for the US 101 South Corridor . 28Table 3-8. US 101 Highway Centerline Miles Vulnerable to Sea Level Rise . 29Table 4-1. Caltrans Owned Park-and-Ride Facilities . 38Table 4-2. Other US 101 Park-and-Ride Facilities . 38Table 4-3. Planned Park-and-Ride Facilities . 39Table 4-4. Origins and Destinations of Private Commuter Shuttles by County . 40Table 4-5. Other ITS/TOS Elements. 48Table 5-1. 2015 AADT. 58Table 5-2. Bottlenecks. 60Table 5-3. Congestion Locations in HOV Lanes . 60Table 5-4. Peak Hour Travel Times in Minutes . 62Table 5-5. Three-Year Accident Analysis for US 101 Mainline from August 1, 2012 to July 31, 2015 . 63Table 5-6. 2015 AADT. 63Table 5-7. Three-Year Accident Analysis for US 101 Mainline from August 1, 2012 to July 31, 2015 . 65Table 5-8. 2015 Bottlenecks. 69Table 5-9. US 101 Travel Times . 70
Table 5-10. Three-Year Accident Analysis for US 101 Mainline from August 1, 2012 to July 31, 2015 . 70Table 5-11. Vehicle Occupancy and Truck Percentage . 73Table 5-12. 2016 Bottlenecks. 74Table 5-13. Travel Times . 74Table 5-14. Three-Year Accident Analysis for US 101 Mainline from August 1, 2012 to July 31, 2015. 74Table 5-15. 2035 Peak Hour Traffic Demand Volumes . 76Table 5-16. 2035 Peak Hour Travel Time in Minutes . 76Table 5-17. Vehicle and Person-Throughput in 2035 . 77Table 5-18. 2035 AM Peak Period Network Performance . 77Table 5-19. 2035 PM Peak Period Network Performance . 78Table 5-20. 2040 Peak Hour Volumes . 79Table 5-21. 2020 Bottlenecks No Build Scenario . 80Table 5-22. 2020 Bottlenecks Build Scenario . 81Table 5-23. 2020 AM Peak Travel Time Comparison . 84Table 5-24. 2020 PM Peak Travel Time Comparison . 85Table 5-25. 2020 AM Peak Period Network Performance Measure Results . 86Table 5-26. 2020 PM Peak Period Network Performance Measure Results . 86Table 5-27. 2040 AM Peak Travel Time Comparison . 89Table 5-28. 2040 PM Peak Travel Time Comparison . 90Table 5-29. 2040 AM Peak Period Network Performance Measure Results . 91Table 5-30. 2040 PM Peak Period Network Performance Measure Results . 91Table 5-31. Bottleneck Conditions, All 2020 Scenarios . 95Table 5-32. Travel Time. 98Table 5-33. Percentage Change in Person Throughput in 2020 – Base Year 2015 . 99Table 6-1. Summary of Public Outreach . 100Table 7-1. US 101 South Corridor Recommended Future Highway and Transit Projects . 107Table 7-2. Recommended Active Transportation Improvement Projects . 127Table 7-3. SHOPP Projects . 137Table 7-4. Short-Term Highway Project Evaluation Results . 140Table 7-5. Short-Term Transit Project Evaluation Results . 144List of FiguresFigure ES-1. US 101 South Congestion March 2016 . iiFigure 3-1. Corridor Segmentation US 101 South . 11Figure 2-2. Example Place Type Map . 18Figure 3-3. Priority Development and Priority Conservation Areas Santa Clara County. 23Figure 3-4. Priority Development and Priority Conservation Areas San Francisco and San Mateo Counties. 24Figure 3-5. MTC’s 2017 Communities of Concern Santa Clara County . 26Figure 3-6. MTC’s 2017 Communities of Concern San Francisco and San Mateo Counties . 27Figure 3-7. Sea Level Rise Map . 30Figure 4-1. Bicycle Facilities in 2017 in Santa Clara County . 44
Figure 4-2. Bicycle Facilities in 2017 in San Mateo and San Francisco Counties . 45Figure 4-3. Smart Corridor Limits. 47Figure 4-4. Ramp Metering Locations. 49Figure 4-5. Strategic Broadband Corridors . 53Figure 4-6. Trucking Facilities . 55Figure 5-1. INRIX March 2011 Speed Contours US 101 from Cochrane Road to Oregon Expressway . 57Figure 5-2. INRIX March 2016 Speed Contours US 101 from Cochrane Road to Oregon Expressway . 57Figure 5-3. US 101 Project Study Area Location and Study Limits . 58Figure 5-4. Degraded HOV Lane Segments . 59Figure 5-5. Mixed Flow Level of Service and Location for AM Peak Period . 61Figure 5-6. Mixed Flow Level of Service and Location for PM Peak Period. 62Figure 5-7. INRIX March 2011 Speed Contours US 101 San Benito County Border to Bailey Avenue . 64Figure 5-8. INRIX March 2016 Speed Contours US 101 San Benito County Border to Bailey Avenue . 64Figure 5-9. NB US 101 (SR 25 in Gilroy to Bernal Road in San José) . 65Figure 5-10. SB US 101 (SR 85 in San José to SR 25 in Gilroy) . 66Figure 5-11. US 101 Project Study Area Location and Study Limits . 67Figure 5-12. INRIX March 2011 Speed Contours US 101 from Willow Road to I-380 . 68Figure 5-13. INRIX March 2016 Speed Contours US 101 from Willow Road to I-380 . 68Figure 5-14. INRIX March 2011 Speed Contours US 101 from I-380 to Bacon Street . 72Figure 5-15. INRIX March 2016 Speed Contours US 101 from I-380 to Bacon Street . 72Figure 5-16. INRIX March 2011 Speed Contours I-280 from Monterey Boulevard to Fifth Street. 72Figure 5-17. INRIX March 2016 Speed Contours I-280 from Monterey Boulevard to Fifth Street. 72Figure 5-18. Silicon Valley Express Lanes. 79Figure 5-19. 2020 Bottlenecks No Build Scenario. 82Figure 5-20. 2020 Bottlenecks Build Scenario . 83Figure 5-21. 2040 Bottlenecks No Build Scenario. 87Figure 5-22. 2040 Bottlenecks Build Scenario . 88Figure 5-23. Proposed US 101/I-280 Conversion to Managed Lane . 93Figure 5-24. Expected Congestion Locations 2020 No Build . 94Figure 5-25. Expected Congestion Location in 2020 2 HOV Lane Conversion. 96Figure 5-26. Expected Congestion Location in 2020 3 HOV Lane Conversion. 97Figure 5-27. Expected Congestion Location in 2020 3 HOV Lane Conversion. 98
Executive SummaryThe US 101 South Comprehensive Multimodal Corridor Plan (CMCP) presents a holistic approach formanaging congestion, improving safety and maximizing flow for all modes and incorporates measures toreduce air pollution and greenhouse gases. Key strategies include the addition of managed/express lanesto maximize the efficient use of the existing highway for motorists, the development of express busservices, rail and local transit improvements and improved bicycle/pedestrian facilities.The CMCP was developed pursuant to the statutory mandate for Caltrans to conduct long-range corridorplanning, as well as in response to the Road and Repair Accountability Act of 2017, also known as SenateBill 1 (SB 1), that was passed in April 2017. Among the multiple programs established by SB 1 is theSolutions for Congested Corridors Program (SCCP). This program provides 250 million annually on acompetitive basis to Caltrans and regional agencies for projects designed to achieve a balanced set oftransportation, environmental, and community access improvements within highly- congested travelcorridors throughout the State. Eligible projects should make specific performance improvements andmust be included in a CMCP. The program also identifies the “Route 101 and Caltrain corridor connectingSilicon Valley with San Francisco” as an example of the kind of congested corridor intended for fundingfrom the SCCP.In response to the significant changes within the Corridor recently and the SCCP requirements, Caltransin coordination with stakeholders along US 101 determined that the US 101 South Corridor is a priorityroute in the region, and that the CMCP should be developed to capture all the anticipated changes,identify multimodal needs and recommend improvement projects and strategies. The US 101 South CMCPcorridor limits are from US 101 from the San Benito/Santa Clara County line to the end of the CentralFreeway in San Francisco. It also includes Interstate 280 (I-280) from the US 101/I-280 Interchange to theend of I-280 in San Francisco. With input from the stakeholders, the CMCP includes eight corridor goals:1.2.3.4.5.6.7.Provide a safe transportation system to all users within the CorridorReduce recurring freeway congestion and improve freeway efficiency in moving peopleImprove trip time reliability within the CorridorSupport an accessible and inter-connected multimodal transportation system within the CorridorReduce pollutants and GHG emissions within the CorridorSupport economic prosperityEfficiently manage transportation assets within the Corridor to protect existing and futureinvestment8. Efficient Land Use improving Job/Housing imbalanceThe US 101 South Corridor is a major south-north connector between Silicon Valley in the South Bay andSan Francisco, two Bay Area centers of great significance to the State’s economy. The portion of theCorridor running through Santa Clara, San Mateo, and San Francisco Counties is home to some of theworld’s most innovative and fastest-growing companies that contribute economic strength to the Stateand national economies. Land uses along the Corridor include State/regional parks, agricultural lands,residential uses in urban and suburban communities, commercial uses in dense urban centers and officeparks as well as industrial uses and a number of institutional uses and sports venues. The Corridor serveslocal, regional, interregional and even international traffic of people and movement of goods. US 101 isi
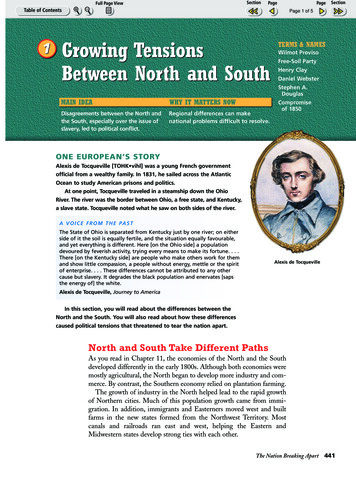
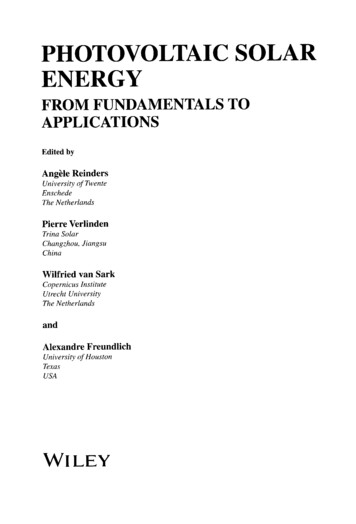
the main access route to the San Francisco International Airport and the Norman Y. Mineta San JoseInternational Airport.In addition to demographics and a list of major trip generators along the Corridor, the US 101 South CMCPincludes a place type analysis based on Caltrans Smart Mobility Framework and recommends appropriatetransportation strategies for each place type within the Corridor. The CMCP also documents PriorityDevelopment Areas and communities of concern within the Corridor as identified in Plan Bay Area 2040(2017), the San Francisco Bay Area’s Regional Transportation Plan (RTP) and Sustainable CommunitiesStrategy (SCS).As a multimodal transportation corridor, the US 101 South Corridor serves the movement of people andgoods with a variety of transportation modes. This CMCP describes public transit services, Park and Ridefacilities, private commuter shuttle services, and bicycle and pedestrian facilities as critical transportationmodes within the US 101 South Corridor. It identifies programmed, planned and in some cases proposedprojects within the Corridor. In addition, it summarizes the Transportation Systems Management andOperations (TSMO) strategies and equipment that are currently deployed within the Corridor andexamines the networks and major trip generators for freight movement.US 101 South is among the most congested corridors in the Bay Area. According to the San Mateo CountyEconomic Development Association (SAMCEDA), an estimated 5.4 billion in economic productivity is lostdue to traffic congestion along the Corridor. Figure ES-1 shows the congestion locations on US 101 forMarch 2016 (Tuesdays, Wednesdays and Thursdays). Eight locations within the US 101 South Corridorwere listed in the Top 50 Congested Locations of 2017 as reported by Metropolitan TransportationCommission’s (MTC) Vital Signs, and they are shown in Table ES-1.Figure ES-1. US 101 South Congestion March 2016Source: INRIX, accessed by Caltrans December 18, 2019ii
Table ES-1. MTC Top 50 Congested Locations for US 101 South in 2017DailyDelay inhoursCongestionDuration14,66012:20 PM–10:30 PMCesar Chavez to Treasure Island Tunnel7,2602:10 PM–8:25 PMFair Oaks Avenue to Oakland RoadNB4,2302:40 PM–7:55 PMWhipple Avenue to East Hillsdale BoulevardSanta ClaraNB3,9706:25 AM–11:00 AMStory Road to North Fair Oaks AvenueSan MateoSB1,5907:00 AM–10:55 AMBroadway/Airport Blvd to Hillsdale Blvd31Santa ClaraNB1,5906:25 AM–9:30 AMBlossom Hill Rd/Silver Creek Vly Rd to Tully Rd41San FranciscoNB1,3406:50 AM–11:15 AMThird Street to Cesar Chavez Street46San MateoSB9607:20 AM–10:35 AMSR 84/Woodside Road to University Avenue50Santa ClaraNB8705:35 AM–8:25 AMSan Martin Avenue to East Dunne AvenueRankCountyDirection1San Francisco3Santa ClaraUS 101 NBand I-80 EBSB13San Mateo1530LocationDue to time and resource constraints, this CMCP utilizes a “hybrid” approach as described in the CaliforniaTransportation Commission’s (CTC) 2018 Comprehensive Multimodal Corridor Plan Guidelines. As such,the CMCP is primarily based on the US 101 South Comprehensive Corridor Plan (2018), but also integratesexisting plans, studies, reports and project-specific information with limited new analysis. Some examplesof the existing plans/reports being integrated include MTC’s Plan Bay Area 2040, Caltrans District 4 BikePlan, countywide transportation plans from the three counties along the Corridor, project-leveldocuments for the managed lanes projects within the Corridor, as well as local development plans andstudies.The freeway performance analysis mainly focuses on bottleneck locations, queue length and changes insome of the network performance measures such as travel times, vehicle occupancy rate, personthroughput and vehicle miles traveled, as a result of implementing the three managed lanes projects listedabove. The recommended strategies include highway and transit projects, active transportation projectsand maintenance and operational projects. See Chapter 7 for short, medium and long-term highway andtransit projects, bicycle and pedestrian projects and State Highway Operation and Safety Program (SHOPP)projects. Chapter 7 also includes a qualitative evaluation of short-term highway and transit projects, withrespect to how they would contribute to the corridor goals.This CMCP will help fulfill Caltrans statutory responsibility of identifying deficiencies within and proposingimprovements to the US 101 South Corridor and serve the purpose of supporting funding applications forthe SCCP.The US 101 South CMCP was developed during the COVID-19 pandemic. Future travel patterns, modepreferences, and transportation needs may change as a result of modified behaviors directly linked to thispandemic.iii
Chapter 1: Introduction1.1 Caltrans Policy DevelopmentSystem Planning is the long-range Transportation Planning process for the California Department ofTransportation (Caltrans). The System Planning process fulfills Caltrans statutory responsibility asowner/operator of the State Highway System (SHS) (Gov. Code §65086) by identifying deficiencies andproposing improvements to the SHS. Through System Planning, Caltrans focuses on developing SystemPlanning products that address integrated multimodal transportation system needs and help advanceCaltrans Mission, Vision and Goals. Over the past several years, especially with the passage of county-levelsales tax measures for transportation funding, Caltrans has worked closely with local agencies such as theAlameda County Transportation Commission (Alameda CTC) and the Metropolitan TransportationCommission (MTC) to conduct system planning for the SHS.This Comprehensive Multimodal Corridor Plan (CMCP) was developed in alignment with the goals,objectives and performance targets outlined in Caltrans Strategic Management Plan 2015-2020.1 It isconsistent with recommendations from the System Planning to Programming (SP2P) study and thePlanning for Operations (P4Ops) Strategic Work Plan, both developed in 2017 by Caltrans Headquartersto help redefine System Planning’s roles and products. It also follows the corridor planning processdescribed in Caltrans Corridor Planning Process Guide, adopted in 202021.2 Senate Bill 1 and the Solutions for Congested Corridors Program 3The Road and Repair Accountability Act of 2017, also known as Senate Bill 1 (SB 1), provides the firstsignificant, stable, and on-going increase in State-directed transportation funding in more than twodecades. SB 1 presents a balance of new resources and reasonable reforms to ensure efficiency,accountability, and performance from each dollar invested to improve California’s transportation system.Among the multiple programs established by SB 1 is the Solutions for Congested Corridors Program(SCCP). This program provides 250 million annually on a competitive basis to Caltrans and regionalagencies for projects
in coordination with stakeholders along US 101 determined that the US 101 South Corridor is a