Transcription
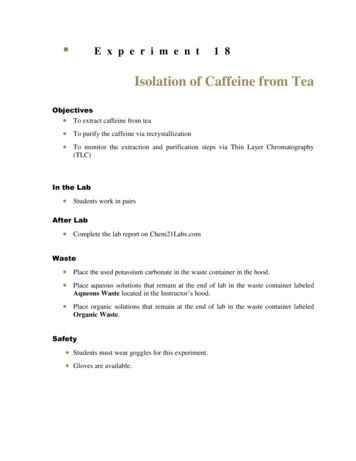
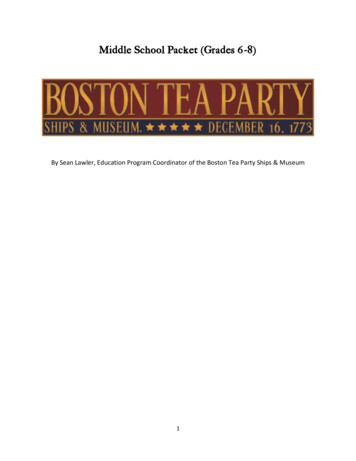
SUSTAINABLE COMMODITIESMARKETPLACE SERIES 2019Global Market Report: TeaVivek Voora, Steffany Bermúdez, Cristina LarreaSeries Editor: Sofia BaliñoGlobal Demand for Tea Is Growing DespiteSustainability ChallengesTea, a dried leaf–infused beverage derived from theleaves of a small shrub originally from China, hasbecome the world’s second most popular beverage afterwater, with 3 billion cups consumed every day acrossthe world.1,2 In 2017, total tea production accountedfor 5.98 million tonnes, of which approximately 35 percent was exported, worth USD 8 billion.3,4,13 That sameyear, the sector had a retail value of approximatelyUSD 50 billion.5,6 Tea was grown in 48 countriesin 2016, including 12 Low Human DevelopmentCountries (LHDCs). Tea production employs 13million people, 9 million of whom are smallholderfarmers, while the remainder work in tea estates; inChina, Sri Lanka and Kenya, which account for halfof the world’s tea production, the majority of tea isproduced by smallholder farmers.7,8 Production isconcentred in a few countries, with the top sevengrowing countries accounting for 90 per cent of theglobal tea supply in 2015.9The largest tea-exporting countries in 2017 were China(USD 1.6 billion), Sri Lanka (USD 1.5 billion) andKenya (USD 1.4 billion), while the largest importingcountries were Pakistan (USD 550 million), Russia(USD 525 million) and the United States (USD487 million).10,11 A significant amount of tea is alsoconsumed domestically. For instance, the amount of teaconsumed in China, India and Turkey in 2015 was morethan in all other tea-consuming nations combined.9Standard-Compliant Tea Accounted for At Least 19.4% of Total Tea Production in 2016Figure 1. Global tea production trend, 2008–2016.446,000,000Metric Tonnes5,500,0005,000,000VSS CompliantPotentiallyVSS S-compliant production volumes refer to tea produced in compliance with one or more VSSs. Conventional production volumes do not comply with any existingVSS. Production volumes that are defined as potentially VSS-compliant cannot be definitively listed in either category with the data currently available.
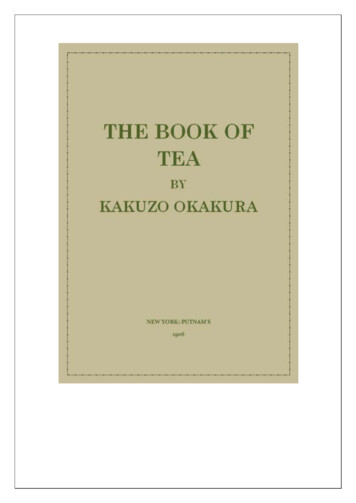
How Much Tea is Certified by Each Standard?Figure 2. Standard-compliant tea productionvolumes in 2016.44Rainforest Alliance1,084,910 MTFairtrade International253,870 MTUTZ Certified119,642 MTOrganic87,830 MTGlobal tea supply growth outpaced demand growth in2016 and 2017 at rates of 4.4 per cent and 4.3 per cent,respectively, resulting in a surplus of approximately200,000 tonnes for both years.4,12,13 The global supply–demand balance of tea closed in 2018 with a smallsurplus and this trend is projected to continue until2020.12,13 As tea-producing countries are also thelargest consumers of tea, production and consumptionare strongly correlated.14 The Food and AgricultureOrganization of the United Nations (FAO) reports abalanced production and consumption growth of about4.4 per cent between 2007 and 2016.14The sector is projected to experience continued growthdue to increasing demand primarily from Asian andPacific countries, particularly those experiencingincreasing incomes; a growing clientele among youngurban consumers; interest in the health benefits ofdrinking tea; and the expansion of new products andflavourings, such as ready-to-drink tea, premium tea,and herbal and fruit fusions.15–19 In addition, demandfor green tea is expected to outpace demand for blacktea.4,12,19 The considerable expansion of sustainable teaproducts is also worth noting. In 2016, 19.4 per cent ofthe market was made up of tea compliant with VoluntarySustainability Standards (VSS), versus 2.4 per cent in2008. However, only 6.6 per cent of tea production ispotentially VSS-compliant, thus leaving 74 per cent oftea as conventional.According to the FAO and a number of market researchcompanies, the tea sector is expected to grow at acompound annual growth rate (CAGR) of about 4 to5.5 per cent from 2017 to 2024 and is projected to reachUSD 73 billion in retail value by 2024.15–19Despite this positive projection, the tea industryfaces important challenges that are unique to thesector. Access to tea-processing facilities is essentialfor tea estates and smallholder tea farms to remainviable, as picked leaves need to be processed within6 hours. Therefore, international tea manufacturershave established their processing plants close to thefields, which has created a vertically integrated valuechain. In fact, the tea supply chain is controlled bya small number of companies, which has resultedin a high level of vertical and horizontal integration:approximately 85 per cent of tea is sold by a fewmultinational companies, and 20 per cent of theglobal market is controlled by the three largest teacompanies.12,20 Consequently, it is necessary toestablish a more equitable wealth distribution acrosstea supply chains to improve the sustainability ofthe sector. Furthermore, 70 per cent of global teaproduction is sold via auctions through anonymoustransactions, in which intermediaries can easily switchbetween suppliers, pushing down prices and reducingmargins for farmers.12 Tea cultivation areas are alsogeographically limited, as tea is a sensitive cropthat requires specific growing conditions to thrive.15Climate change is also expected to affect temperatureand rainfall patterns, which can significantly impactyields.21 Tea estates are already reporting heavier rainsand longer dry seasons leading to increased soil erosionand further use of fertilizers, pesticides and irrigationto maintain productivity.21 Additional challengesfacing the tea sector include forced and child labour,which are still rampant; poor tea plantation workingconditions; low wages; and pesticide residues in thefinal product.15,22–24
Demand for More Sustainably Produced Tea IsGrowing and Could Help Address the Sector’sChallengesLIVELIHOODSOver 13 million people employed in tea productionVoluntary Sustainability StandardsA (VSS) have beenused in the tea sector for almost 40 years to addressthe various challenges facing the sector and to providetea consumers with more sustainable options.25 VSScompliant tea is produced to meet consumer preferenceswhile aiming to maintain the sector’s long-termsustainability by requiring agricultural practices thatenable climate resilience, prevent soil erosion, lowerpesticide use, increase profitability for smallholders, andimprove workers’ conditions, such as providing the rightto collective bargaining and access to sanitation andclean drinking water.269 million smallholder farmersDemand for more sustainable tea historically camefrom outside producing countries, primarily fromEurope and North America. Tea producers with theresources to become VSS-compliant saw an opportunityto access these potentially lucrative export marketswhile being able to fall back on the growing domesticdemand.15,26 Considering their significance in meetingglobal demand for more sustainable tea, VSSs have hadan important role in improving the working conditionsof tea workers and the profitability of smallholders.26VSSs aim to create a virtuous cycle where demand formore sustainable tea results in better conditions for theproducers and environments that support its production,which, in turn, should lead to greater investment in amore sustainable and profitable sector for producers.VSS production in LHDC Tanzania is up by 79%On the supply side, VSS-compliant tea has grownsignificantly since the first tea plantation was certifiedorganic in 1983.25 From 2008 to 2016, VSS-complianttea experienced a CAGR of about 35 per cent,accounting for at least 19 per cent of tea productionoverall. The Rainforest Alliance, Fairtrade, UTZCertified and Organic are the main VSSs in the teasector when ranked by production size. In 2016, 1.15million tonnes of tea were VSS-compliant, and valuedat USD 2 billion.27,28 This value is derived from averageproducer prices per country, as reported by the FAO,which were then applied to the volume of VSS-complianttea produced by each country.27,28 The majority ofA70% of global production comes from 8 millionsmallholder farmers in Asia and AfricaMARKET VALUEOver USD 2 Billion VSS-compliant teabased on 2016 tea producer pricesCAGR 2008–2016Conventional production is up by 0.71%while VSS production is up by 35%TEA PRODUCTION IN LHDCS5% of total tea produced12% of VSS-compliant tea producedbased on 2016 dataVSS-compliant tea comes from Africa (Kenya, Malawi,Rwanda) and Asia (India, Turkey, Indonesia).On the demand side, several important corporatesustainable sourcing commitments drive the demandfor VSS-compliant tea. In 2017, the five largest teaconsuming companies purchased more than 1.2 milliontonnes of tea, at least 900,000 tonnes of which wereVSS-compliant. Based on the sourcing commitmentsof these five companies and current tea-sourcinginformation, an additional 245,000 tonnes of sustainabletea could be consumed by 2020. These leading buyers’sourcing commitments are driven mainly by finalconsumer preferences to purchase more sustainableand healthy products.12 European and North Americancountries are the main destinations of VSS-complianttea,29 and they are expected to continue being the majorconsumers of sustainable tea in the coming years, andwill likely develop increased demand as consumersThe United Nations Forum on Sustainability Standards (UNFSSs) defines VSSs as “standards specifying requirements that producers, traders, manufacturers,retailers or service providers may be asked to meet, relating to a wide range of sustainability metrics, including respect for basic human rights, worker health and safety,the environmental impacts of production, community relations, land use planning and others.” To review the purpose of various VSSs and the set of requirementsproducers need to comply with under each scheme, please access State of Sustainability Initiatives Reviews in the following link: https://www.iisd.org/ssi/
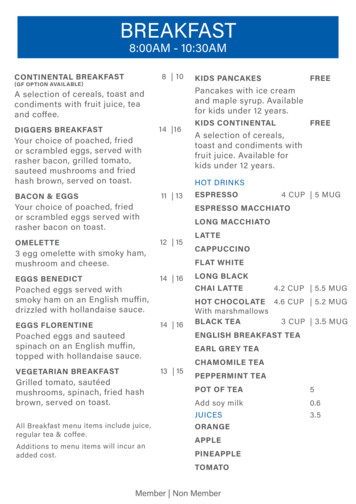
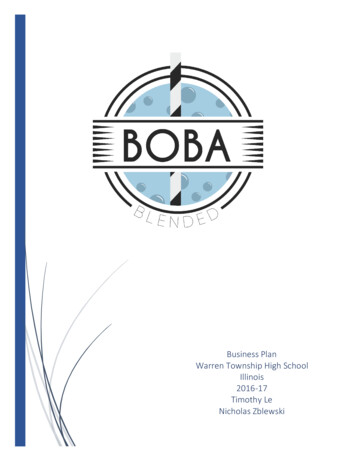
Good Progress Toward Sourcing More Sustainable Tea6,31–43, 59-61Figure 3. Major tea-consuming companies and their estimated sustainable sourcing volumes andcommitments**In 2017, Tata Global Beverages' estimatedtotal tea consumption was 244,042 metrictonnes, of which an estimated 61.51% wassustainably sourced. They are close toreaching their goal of 100% by 2020.100% sustainable sourcing by 2022James Finlay65,700* McLeod RusselCommitment to 100% sustainable sourcing by 2020115,00061.51% SustainableConsumption in 2016100% sustainable sourcing by 2020Tata Global Beverages38.49% ConventionalConsumption in 2016244.042 MT244,042100% sustainable sourcing by 2020TwiningsSustainable Consumption(MT, 2017)183,032100% sustainable sourcing by 2020UnileverConventional Consumption(MT, 2017)610,106750,000500,000250,0000Metric TonnesSustainable SourcingCommitment (% and year)* data not found for sustainablesourcing commitments** consult methodology for estimating sourcing volumes at the end of the documentbecome more willing to pay more for standardcompliant and premium tea.29,30Despite this positive outlook, growing demand forVSS-compliant tea remains a challenge as the largesttea-producing countries are also the largest consumers,and they tend toward consuming conventionally grownoptions over more costly sustainable versions.4,15,20 Thissituation influences the oversupply of VSS-complianttea, which is another formidable challenge, as it leads tocertified tea being sold as conventional.4,26 Nevertheless,recent efforts have been made to develop national VSSs,such as the Trustea standard in India and the Lestaristandard in Indonesia, which have grown significantly to400,000 tonnes of verified tea supporting livelihoods for350,000 workers and 40,258 smallholders.42–44Demand for VSS-compliant tea is expected to continuegrowing in some of the largest producing countries,such as China, India, Indonesia and Sri Lanka, with thegrowing middle classes developing a taste for specialtyand more sustainable tea.15,29 Furthermore, there ispotential to develop demand for VSS-compliant tea overthe next decade in the fastest-growing conventionaltea markets, which are projected to be in East Africa:Rwanda, Uganda and Kenya have forecasted growthof 9 per cent, 5 per cent and 4.4 per cent, respectively.Consumers in these countries could develop tastesfor more sustainable options over time, particularly inKenya where almost all of the country’s tea productionis VSS-compliant, with an increasing interest fromthe government of this country to promote domesticconsumption.45 VSS-compliant tea production needsto translate into equivalent sales if it is to continueexpanding over time.26Increasing VSS-Compliant Tea Productionby Focusing on the Top Three Tea-ProducingAsian CountriesGoing forward, there is an opportunity to increaseVSS-compliant tea production. Demand for moresustainable tea is expanding, primarily in Europe and
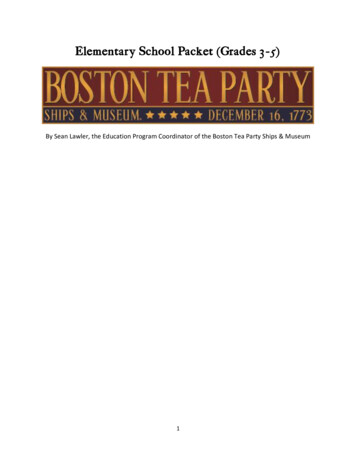
Tea-Growing Regions of the WorldJapanChinaThailandViet NamIndonesiaBangladeshMyanmar(Burma)Sri ure 4. Distribution of tea production in the top 15 tea-producing countries in 2016LowHighMediumVery HighConventional ProductionHarvest AreaPotentially VSS CompliantPrevalent VSS-Compliant AreaVSS ComplianttonnesSignificant Producer HDI1,000,000500,0000Sources: see endnotes 13, 56, 57Download high resolution version of the map at ons/ssi-global-market-map-tea.pdfNorth America, which could potentially balance theexisting oversupply.12,26,28,46 Consumption of organictea is also expected to grow in the Asian-Pacific regiondue to a rise in consumer preferences for more naturalproducts.30,47 To realize this potential, the industry mustaddress the above-mentioned challenges, includingmore equitable wealth distribution across supply chains,increased profitability for smallholders, better labourconditions and wages for tea workers, and improvedresilience to climate change impacts on yields.As tea cultivation is confined to specific places aroundthe world that offer suitable growing conditions, thegreatest potential for expanding VSS-compliant tea liesin existing producing countries, especially consideringtheir total tea output and the current presence of VSSs.China, India and Sri Lanka currently account for almost70 per cent of total global tea production but only 26per cent of total VSS-compliant tea production (2, 16and 15 per cent, respectively), indicating that there areopportunities for expansion.48 In contrast, and despitebeing the third-largest producer in the world, almost allof Kenya’s tea production (approximately 99 per cent) isalready VSS-compliant. Other tea-producing countriessuch as Vietnam, Turkey and Myanmar also offer goodprospects for increased sustainable tea production.Another important consideration in assessingopportunities for expanding VSS-compliant teaproduction is the human development level of teaproducing countries, as measured by the HumanDevelopment Index (HDI). Out of 48 tea-growingcountries in 2016, 12 were LHDCs according to theHDI, and 6 of them produced VSS-compliant tea(Burundi, Ethiopia, Malawi, Rwanda, Uganda andTanzania). These LHDCs accounted for approximately5 per cent of the total tea grown in 2016 and wereresponsible for 12 per cent of the total VSS-complianttea produced worldwide that year.According to our analysis, some of these LHDCs showpromising signs of growth in VSS-compliant production.For instance, between 2008 and 2016, VSS-complianttea production in Tanzania increased at a CAGR of
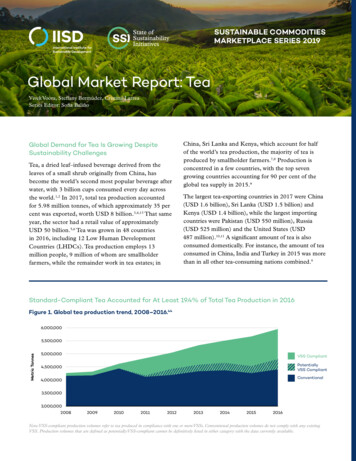
approximately 79 per cent to almost 27,000 tonnes,and five additional LHDCs started producing VSScompliant tea during this same time period. The largestVSS-compliant production volumes from LHDCs camefrom Rainforest Alliance, Fairtrade, UTZ Certifiedand Organic in 2016. VSSs have also been shown tosupport more sustainable tea production comparedto conventionally grown tea in some contexts. Forinstance, certified tea farmers and workers earned 5.3million Euros in Fairtrade premiums in 2017, andalmost all Rainforest Alliance–certified tea plantationsin Kenya were found to provide their workers with cleandrinking water while a little more than 50 per cent ofconventional tea plantations do not.49,50If properly implemented as part of broader sustainabledevelopment strategies, the expansion of VSS-compliant teaproduction in LHDCs could result in important sustainabledevelopment benefits via improved agricultural practicesthat enable climate resilience and better working conditionsfor tea workers, and could potentially contribute to improvedprofitability for workers and smallholders. The expansionof VSSs can also lead to positive development outcomes innon-LHDCs where tea workers and smallholders continue toexperience poverty.In terms of the opportunities to expand VSS-complianttea production in LHDCs and maximize their potentialto deliver sustainable development outcomes, theSouth-South Trade Dominated Tea Flows in 2016Figure 5. Trade flows of the largest tea-producing countries in 2016, in tonnesChina324,793 [26.06%]Africa & Middle East474,322 [38.06%]India233,297 [18.72%]Asia232,962 [21.10%]Kenya402,179 [32.27%]Europe212,100 [17.02%]Latin America &the Caribbean10,985 [0.88%]North America48,687 [3.91%]Sri Lanka278,987 [22.39%]Turkey6,969 [0.56%]Oceania11,495 [0.92%]South Asia225,460 [18.09%]Sources: see endnotes 13, 58These five countries represent 79 percent of total tea production in 2016. The percentage in brackets for each country represents the proportion of the total volume of greenand black tea exported in 2016 by these countries. The percentage in brackets for each region represents the proportion of the total volume of green and black tea importedin 2016, from the five countries.
countries that show the most potential for growthin light of their share of total tea production, thepresence of VSSs and their HDI value are Burundiand Uganda, followed by Mozambique, Tanzania andPapua New Guinea, according to our analysis basedon 2016 figures. For the most part, VSS-compliant teaproduction is new in many LHDCs and its potentialbenefits are likely yet to be felt. The potential supportthat VSSs can bring in the form of training, extensionservices and access to markets should assist both teafarmers and plantation workers to improve their livingconditions. For instance, Fairtrade reports that their350,000 participating tea farmers and workers across 12countries sold 12,100 tonnes of tea in 2016 and raisedapproximately USD 7.5 million in premiums used topay for beneficial community projects such as access toclean water, schools and health centres.49 Nevertheless,reports of instances where VSS requirements havenot been respected on certified tea plantations rangefrom exceeding maximum pesticide residues tocontinued incidences of forced and child labour.22,24,51Expanding sustainable tea production in LHDCs mayalso become subject to more competition as labourshortages undermine the economic viability of teaestates and plantations around the world, particularly inemerging economies, where more lucrative employmentopportunities can be found.52–54Clearly, VSSs must ensure that their interventionslead to a better tea sector where these sustainabilitychallenges are addressed. Expanding VSS-compliant teaproduction in LHDCs and the largest tea-producingcountries, China, India and Sri Lanka, offers thepotential for tea to become a crop that empowersproducers, restores natural environments and enablesresilient value chains.55Despite the efforts of VSSs in the tea sector, moresustainable tea consumption and production willrequire dialogue and a determined and coordinatedapproach among all tea supply chain stakeholders,trade unions and the public sector to address some ofthese challenges. Examples of efforts to bring togetherstakeholders to grapple with challenges includeTea 2030 – Forum for the Future, the Ethical TeaPartnership and the Intergovernmental Group on Teasupported by the FAO. Along with VSSs, these multistakeholder initiatives and efforts are crucial for thesector to become sustainable in perpetuity.
FIGURE 3 NOTES: BRIEF EXPLANATION OF THE METHODOLOGY USED TO ESTIMATE SOURCING VOLUMESUnilever: Source (*) volume total, 2017 (610,106 MT): This figurewas estimated by multiplying the company’s tea marketshare (10% of world’s tea production in 2017)31 by theglobal tea production in 2017 (6,101,060 MT) as reportedby the FAO Corporate Statistical Database (FAOSTAT).13 Subtract the 49 per cent of Tata Tea sold in Indiaas conventional (93,923 Mt) from the company’stotal sourced volume at the global level (India,EMEA and CAA) in 2017 (244,042 Mt), as calculatedabove, assuming that 100 per cent of Tetley teaand other brands sold in EMEA and CAA is 100per cent sustainable, according to the company’sreports.33Source volume standard-compliant certified, 2017(494,185 MT): This figure was estimated by comparingthe company’s report of purchasing 81 per cent VSScompliant tea32 to the total sourcing volume in 2017.Tata Global Beverages (minimum values): The total sourced volume of VSS-compliant tea forthe company at the global level was estimated asfollows:Source volume total, 2017 (244,042 MT): This figure wasestimated by multiplying the company’s tea marketshare (4 per cent of the world’s tea production in 2010,extrapolated to 2017)39 by the global tea production in2017 (6,101,060 MT), as reported by FAOSTAT13Source volume standard-compliant certified, 2017(150,119 MT): This figure was obtained by estimatingthe consumed volumes in 2017 as a proxy for sourcingvolumes of VSS-compliant tea for the brands Tetley (soldin Europe, Middle East and Africa [EMEA] and Canada,America and Australia [CAA] markets) and Tata Tea (soldin India).33 Both brands represent approximately 75% oftotal sales for the company in 2017.33Tata Tea in India (total, 2017: 191,681 MT): This figurewas estimated by multiplying the brand’s marketshare in India (19.7% of India’s tea consumption)39by the total volume of tea consumed in India in 2017(973,000 MT), as reported by Statista.41Tata Tea in India (VSS-compliant, 2017: 97,757.31 MT):This figure was obtained by multiplying the 51 percent of VSS-compliant tea reported by the brand inIndia,33 by the total tea sales volume estimated forthe brand in 2017.Tetley (EMEA and CAA, total, 2017: 41,062 MT):This figure was estimated by converting 45 milliondaily cups of Tetley tea consumed around the world,as reported by the company,34 into the number ofcups consumed annually. The resulting amount wasconverted into tonnes using the ratio of 2.5 grams oftea/cup60 and 1 tonne 1,000,000 gramsTetley (EMEA and CAA, VSS-compliant, 2017: 41,062MT): This figure was estimated by assuming that100 per cent of Tetley tea consumed in 2017 wasVSS-compliant, since the company reported that100 per cent of their tea sold in EMEA and CAAmarkets (in which all Tetley Tea is sold) was VSScompliant in 2017.33James Finlay (sourcing volumes refer to their own plantationsonly, due to the absence of data) Source volume total, 2017 (65,700 MT): This figurewas obtained by converting total tea production fromthe company’s own plantations in 2017,37 measured inkilograms, into tonnes (65,700,000 kg/1,000). Source volume standard-compliant certified, 2017(65,700 MT): This figure was estimated by multiplyingthe 100 per cent of VSS-compliant tea reported by thecompany37 by the total produced volume in 2017.Twinings Source volume total, 2017 (183,031 MT): This figure wasestimated by multiplying the company’s tea marketshare (3 per cent of the world’s tea production in 2010,extrapolated to 2017)39 by the global tea production in2017 (6,101,060 MT), as reported by FAOSTAT.13 Source volume standard-compliant certified, 2017(146,425 MT): This figure was estimated by multiplyingthe 80 per cent of VSS-compliant sourced tea reportedby the company59 by the total purchased volume in 2017.McLeod Russel Source volume total, 2017 (115,000 MT): This figure wasobtained by converting the total tea production fromthe company’s own plantations in 2017, measured inkilograms, into tonnes (115,000,000 kg/1,000).38 Source volume standard-compliant certified, 2017(92,000 MT): This figure was estimated by multiplyingthe 80 per cent of VSS-compliant sourced inputs(including tea) reported by the company38 by the totalproduced volume in 2017.(*): Source volume can refer to: produce, purchase or use volumeof tea depending on where the company stands in the valuechain.
ENDNOTES1.Anderson, R. (2014). Tea industry’s future depends on corporate collaboration. Retrieved from https://www.bbc.com/news/business-261239442.Tea. (n.d.) In Merriam-Webster’s online dictionary (11th ed.). Retrieved from ited Nations Department of Economics and Social Affairs. UN Comtrade Database: International TradeStatistics. Retrieved from https://comtrade.un.org/data4.Intergovernmental Group on Tea. (2018). Current Market Situation and Medium Term Outlook. In Committeeon Commodity Problems (CCP:TE 18/CRS1; vol. CCP:TE 18/CRS1). Retrieved from Food and AgricultureOrganization of the United Nations website: http://www.fao.org/3/BU642en/bu642en.pdf5.Friend, E. (2013). Dual Opportunities for Tea in Retail and Foodservice. Market Research Blog. Retrieved s-for-tea-in-retail-and-foodservice/6.Statista. (n.d.). Value of the global tea market from 2017 to 2024 (in billion U.S. dollars). Retrieved from tea-beverage-market-size/7.Solidaridad Network. (2014). Tea. Retrieved from ea8.Ethical Tea Partnership. (2019). Smallholder Tea Farmers Archives. Retrieved from areas/smallholder-tea-farmers/9.Bolton, D. (2016). Global Tea Production 2015. World Tea News. Retrieved from ures/global-tea-production-201510.Workman, D. (2019). Tea Exports by Country. World’s Top Exports. Retrieved from ntry/11.Workman, D. (2019). Tea Imports by Country. World’s Top Exports. Retrieved from ntry/12.Intergovernmental Group on Tea. (2018). Emerging Trends in Tea Consumption: Informing a Generic PromotionProcess. In Committee on Commodity Problems (CCP:TE 18/2; vol. CCP:TE 18/2). Retrieved from Food andAgriculture Organization of the United Nations website: http://www.fao.org/3/MW522EN/mw522en.pdf13.Food and Agriculture Organization of the United Nations (FAO). (n.d.). FAOSTAT. Retrieved from http://www.fao.org/faostat/en/#data/QC14.Bolton, D. (2019). Market Research Reflects and Predicts Growth. World Tea News. Retrieved from h15.FAO. (2018). Global tea consumption and production driven by robust demand in China and India. Retrievedfrom e/16.Technavio Research. (2017). Global Tea Market - Drivers and Forecasts by Technavio. BusinessWire. Retrieved echnavio17.Kumar, S., & Deshmukh, R. (2019). Tea Market by Type (Green Tea, Black Tea, Oolong Tea, Fruit/Herbal Tea, andOthers), Packaging (Plastic Containers, Loose Tea, Paper Boards, Aluminum Tin, and Tea Bags), Distribution Channel(Supermarkets/Hypermarkets, Specialty Stores, Convenience Stores, Online Stores, and Others), and Application(Residential and Commercial): Global Opportunity Analysis and Industry Forecast, 2017-2023. Allied Market Research.Retrieved from Mordor Intelligence. (2018). Tea market growth, trends and forecasts (2019-2024). Retrieved from s/tea-market19.Zion Market Research. (2018). Global Tea Market Will Reach USD 49,456.52 Million by 2024. GlobeNewswire.Retrieved from 0.Intergovernmental Group on Tea. (2018). Fostering Sustainability in Tea Production and Trade: Assessing theImpact of Certification Schemes on Farm Income, Inclusive Rural Development and Market Access. In Committeeon Commodity Problems (vol. CCP:TE 18/4). Retrieved from Food and Agriculture Organization of the UnitedNations website: http://www.fao.org/3/MW523EN/mw523en.pdf
21.Chang, K., & Brattlof, M. (2015). Socio-economic implications of climate change for tea-producing countries. Marketand Policy Analyses of Raw Materials, Horticulture and Tropical (RAMHOT) Products Team, Food andAgriculture Organization of the United Nations, p. 11.22.Verité. (2019). Tea Commodity Atlas Research Page with a Map. Retrieved from ene, M. (2014). Pesticide traces in some tea exceed allowable limits. CBC News. Retrieved olton, D. (2014). Calls to harmonize pesticide residue levels. World Tea News. Retrieved from ntergovernmental Group on Tea. (2016). Report of the Working Group on Organic Tea. In Committee onCommodity Problems (vol. CCP:TE 16/CRS13). Food and Agriculture Organization of the United Nations, p. 1–5.26.Potts, J., Lynch, M., Wilking, A., Huppe, G., Cunningham, M., & Voora, V. (2014). State of Sustainability InitiativesReview 2014: Standards and the Green Economy. Winnipeg, Canada: International Institute for SustainableDevelopment, In
drinking tea; and the expansion of new products and flavourings, such as ready-to-drink tea, premium tea, and herbal and fruit fusions.15–19 In addition, demand for green tea is expected to outpace demand for black tea.4,12,19 The considerable expansion of sustainable tea