Transcription
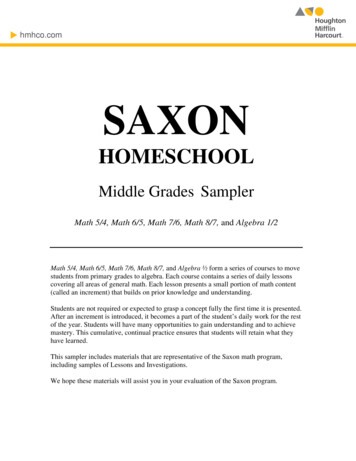
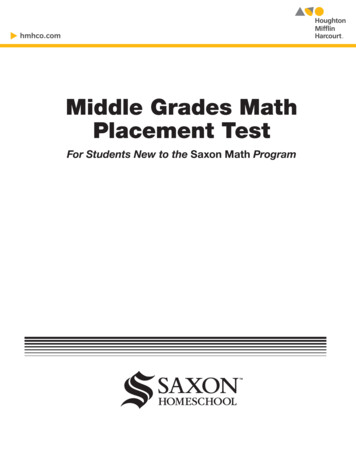
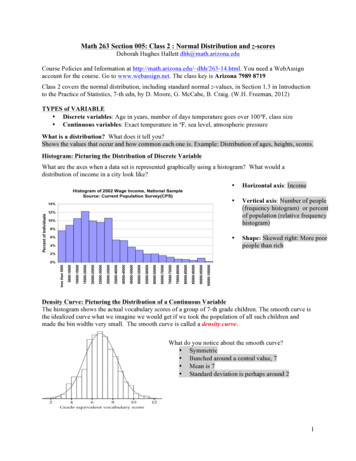
Math 263 Section 005: Class 2 : Normal Distribution and z-scoresDeborah Hughes Hallett dhh@math.arizona.eduCourse Policies and Information at http://math.arizona.edu/ dhh/263-14.html. You need a WebAssignaccount for the course. Go to www.webassign.net. The class key is Arizona 7989 8719Class 2 covers the normal distribution, including standard normal z-values, in Section 1.3 in Introductionto the Practice of Statistics, 7-th edn, by D. Moore, G. McCabe, B. Craig. (W.H. Freeman, 2012)TYPES of VARIABLE Discrete variables: Age in years, number of days temperature goes over 100 , class size Continuous variables: Exact temperature in , sea level, atmospheric pressureWhat is a distribution? What does it tell you?Shows the values that occur and how common each one is. Example: Distribution of ages, heights, scores.Histogram: Picturing the Distribution of Discrete VariableWhat are the axes when a data set is represented graphically using a histogram? What would adistribution of income in a city look like?Histogram of 2002 Wage Income, National SampleSource: Current Population Survey(CPS)Percent of Individuals14% Horizontal axis: Income Vertical axis: Number of people(frequency histogram) or percentof population (relative frequencyhistogram) Shape: Skewed right: More poorpeople than -200005000-1000010000-15000less than 50000%Density Curve: Picturing the Distribution of a Continuous VariableThe histogram shows the actual vocabulary scores of a group of 7-th grade children. The smooth curve isthe idealized curve what we imagine we would get if we took the population of all such children andmade the bin widths very small. The smooth curve is called a density curve.What do you notice about the smooth curve? Symmetric Bunched around a central value, 7 Mean is 7 Standard deviation is perhaps around 21
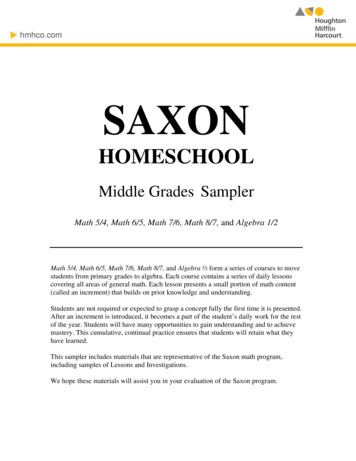
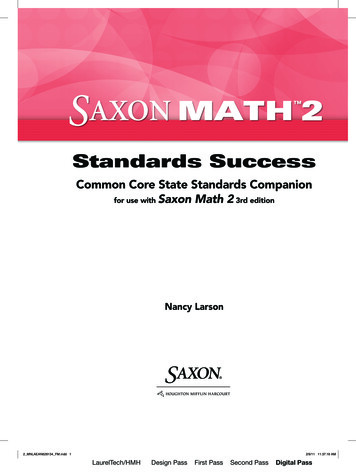
Using a distribution to measure proportions and probabilitiesFor a discrete variable, such as age in years, we can calculate the proportion of the population that has anexact value—for example, the proportion of 10-year olds in a school.For a continuous variable, such as the quantity of oil discovered in a region. We expect no discoveries tolead to exactly 2 trillion cubic feet of oil, for example, so the proportion having any particular value iszero. We can only calculate the proportion between two values. Thus we have: Histogram: Proportion, or probability, is height of bars Density Curve: Proportion, or probability, is area under curveProportion given byareaaxbThe proportion of data valueslying between two values isthe area under the densitycurve between these values.The NORMAL DISTRIBUTIONRepresented by a bell shaped curve, bunched around the mean.exHeights of men1. Estimate the mean and standard deviation.Mean: 68.2 inchesStandard Deviation: 2.7 inchesexHow do the mean and standard deviation of a normal distribution affect the graph?Normal DistributionMean 0, Standard deviation 1-6.00-4.00-2.00Normal DistributionMean 1, Standard deviation 00-6.00-4.00-2.000.00.002.004.00 Mean fixes center of graph; Standard deviation measures spreadNotice that each graph spreads roughly three times the standard deviation on either side of the mean. Thusthe standard deviation is approximately 1/6 of the range.1From Jessica Utts, Seeing Through Statistics 3rd edition. Thomson-Brooks Cole.26.00
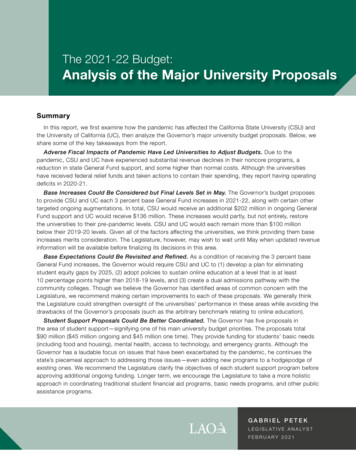
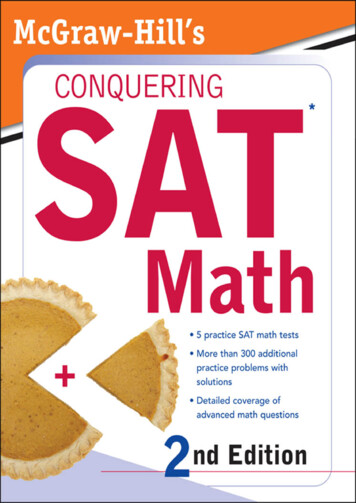
ex: How does a normal distribution look with mean 3 and standard deviation 1? With mean 0 andstandard deviation 0.5? Sketch these distributions.Normal Distribution: Mean 3, StandardDeviation 1-6.00-4.00-2.000.002.00Normal Distribution: Mean 0, Standard Deviation 0.54.006.00-6.00-4.00-2.000.002.004.006.00Ex. Which of the following quantities are likely to be normally distributed? Make rough sketch. Incomes in a city Not normal—because not symmetric. There are more low incomes than high; a fewvery high incomes makes the distribution skewed right.Scores on a standardized test (for example ACT, SAT) Approximately normal. Math SAT-2008:Mean 515, SD 116. The maximum and minimum scores possible on the text are 800 and 200.Since 3 116 348 and 515 348 863 and 515 348 167, the distribution cannot beexactly normal.Distribution of SAT Math Scores 01002003004005006007008009003
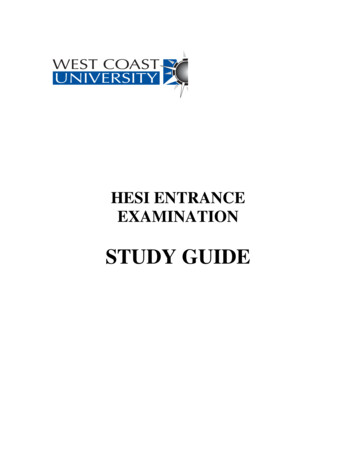
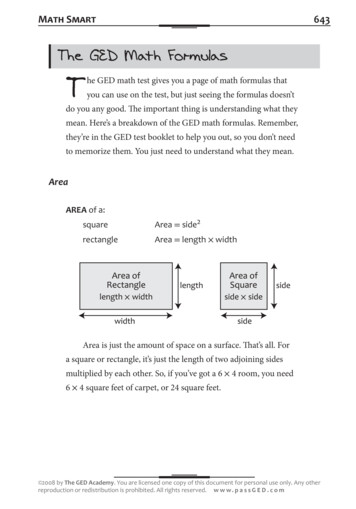
“Rule of Thumb”: for the Normal DistributionFor all normal curves, it can be shown that, approximately68% of the data lies within 1 std dev of mean95% of the data lies within 2 std dev of mean99.7% of the data lies within 3 std dev of meanex: Women’s heights are normally distributed with mean 65 inches (165 cm) and standard deviation 2.5inches (6.4 cm).(a) What proportion of women are less than 60 inches? (5ft)(b) What proportion of women are less than 70 inches?(c) What proportion is more than 72 inches? (6ft)(a) 60 inches is two standard deviations below the mean. About 2.5% of women are less than 60 inches.(2.5 (100 – 95)/2)(b) 70 inches is two standard deviations above the mean. About 97.5% of women are less than 70 inches.(97.5 100 – 2.5)(c) 72 inches is close to 72.5 inches, which is three standard deviations above the mean. The proportionof women above 72.5 inches is 0.15%. (0.15 (100 – 99.7)/2). The true answer is slightly larger than this.How do we compute proportions if the value given is not an exact multiple of standard deviationsaway from the mean? (Like the 72)? We use the 𝒛-score (or 𝒛-value), defined next.4
THE Z-SCORE: Comparing Values in Different Normal DistributionsTo compare values from different normal distributions (with different means and standard deviations), wefind how many standard deviations each value is above or below its mean. This is the z-score:Value Mean𝑧 Standard deviationThe values of z have the standard normal distribution, with mean 0 and standard deviation 1.Ex: On the 2008 SAT, which of the following scores represents the best performance:2 580 on reading,595 on math, or 575 on writing?MeanStandard DeviationReading501112Math515116!"#!!"# 0.71We find the z-scores for each test.Reading 𝑧 Math 𝑧 !!"!"!!!"!Writing493111 0.69!!"!"!!!"#Writing 𝑧 0.74!!!Thus the writing score was the most impressive, as it was 0.74 standard deviations above the mean. Theother two scores were 0.69 and 0.71 standard deviations above their respective means.𝒁-TABLESThe normal table shows the 𝑧-values to the left (with the second decimal place across the top); the bodyof the table shows the proportion of values to the left of each 𝑧-value. (See picture at top of table.)Finding the Proportion of Data in a Normal Distribution using the TableexFind the proportion of data that has z-score less than 0.7.From the table, the proportion is 0.7580 75.8%exFind the proportion with z-score above 1.2.The proportion below 𝑧 1.2 is 0.8848. To get the proportion above 𝑧 1.2, we subtract from the wholearea, which is 1 (or 100%). Thus, we have 1 0.8848 0.1151, or 100 – 88.49% 11.51%ex Find the proportion with z-score between –0.20 and 1.4.Looking up 1.4 gives 91.92% less than 1.4; similarly there are 42.07% less than –0.2. ThusProportion between is 91.92% – 42.07% 49.85%exWhat z-score is at the 70th percentile?We want a z-score with 70% of the data to the left of it. From the table, this is between 𝑧 0.52 and𝑧 0.53.exWhat z-score has 75% of the data above it?The score we want is at the 25th percentile, so about 𝑧 – 0.67.ex: Find the proportion of women who are shorter than 72 inches. (Heights are normally distributed withmean 65 inches and standard deviation 2.5 inches.)SinceValue Mean𝑧 ,Std Dev2The College Board’s Total Group Profile Report: 2009 College-Bound Seniors5
we have72 65 2.8,2.5From the table, the proportion below 𝑧 2.8 is 0.9974 99.74%; this is the proportion of women withheight below 72 inches.𝑧 Ex: Find the proportion of women taller than 72 inches.Since the 72 inches is the same, as in the previous example, the 𝑧-value is the same and so is theproportion from the table. To find the proportion above 𝑧 2.8, we subtract from 1, so the proportion is1 0.9974 0.0026 0.26%. This is the proportion taller than 72 ins.Ex: How tall is a woman who is at the 30th percentile in height?Look for 0.3 in the body of the table; it is between 𝑧 0.52 and 𝑧 0.53; it’s closer to 𝑧 0.52 sowe pick that. Thus, if 𝑥 is the value we are looking for, we have𝑥 65 0.52 .2.5Solving gives𝑥 65 2.5 0.52 63.7.Thus, if a woman has height 63.7 inches, she is taller than 30% of women.Ex: What percentile is a SAT reading score of 700? (Mean reading score is 503; standard deviation 113).SinceValue Mean𝑧 ,Std Devwe have700 503𝑧 1.74,113so we look up 𝑧 1.74 in the table and find that it has 95.91% of the data below it. So 95.91% is thepercentile.exWhat SAT math score is at the 90th percentile? (Mean math score is 518; standard deviation 115.)We want a z-score with 90% of the data below it. From the table, this is 𝑧 1.28. If the SAT score is x,we have𝑥 5181.28 115𝑥 518 1.28 115𝑥 518 1.28 115 665.Finding proportions using a TI-83/84To find proportion between 𝑎 and 𝑏, look under “Distr” menu and usenormalcdf (𝑎, 𝑏, mean, standard deviation)To find the 𝑥 value that corresponds to a proportion 𝑝, useinvNorm(𝑝, mean, standard deviation)Finding proportions using ExcelTo find the proportion of the data to the left of x, use NORMDIST (𝑥, mean, standard deviation, true).To find the x value that corresponds to a proportion 𝑝, use NORMINV (𝑝, mean, standard deviation)6
Scores on a standardized test (for example ACT, SAT) Approximately normal. Math SAT-2008: Mean 515, SD 116. The maximum and minimum scores possible on the text are 800 and 200. Since 3 116 348 and 515 348 863 and 515 348 167, the distribution cannot be exactly normal. 0 -6.00 -4.00 -