Transcription
FMEA and FTAVít Hampl
FMEA - Failure mode and effects analysisFMEA is a bottom-up technique used to identify, prioritize, and eliminate potential failuresfrom the system, design or process before they reach the customer.HistoryFMEA was developed as military procedure MIL-P-1629 and published on 9. November1949, titled Procedures for Performing a Failure Mode, Effects and Criticality Analysis.Later in 1960's it was used in aerospace and rocket industry. In 1974 FMEA becomemilitary standard Mil-Std-1629. In the late 1970’s Ford Motor Company introduced FMEAto automotive industry.TypesThere are several types of FMEA according to the stage in which they are used:Concept FMEA, which is used to analyze concepts in the early stagesbefore hardware is defined. It focuses on potential failure modes associated with theproposed functions of a concept proposal. This type includes the interaction of multiplesystems and interaction between the elements of a system at the concept stages. CFMEAhelps select the optimum concept alternatives, or determine changes to designspecifications, identifies potential failure modes caused by interactions within the concept,increases the likelihood all potential effects of a proposed concept’s failure modes areconsidered. It also identifies system level testing requirements and helps determine ifhardware system redundancy may be required within a design proposalDesign FMEA, which is used to analyze products before they are released to production.It focuses on potential failure modes of products caused by design deficiencies. DFMEAsare normally done at three levels – system, subsystem, and component levels. This type ofFMEA is used to analyze hardware, functions or a combination. DFMEA aids in theobjective evaluation of design requirements and design alternatives, in the initial designfor manufacturing and assembly requirements. It increases the probability that potentialfailure modes and their effects have been considered in the design/development process,provides additional information to help plan thorough and efficient test programs.Develops a list of potential failure modes ranked according to their effect on the customer.It also establishes a priority system for design improvements, provides an open issueformat for recommending and tracking risk reducing actions and future reference to aid inanalyzing field concerns.Process FMEA, which is normally used to analyze manufacturing and assembly processesat the system, subsystem or component levels. This type of FMEA focuses on potential
failure modes of the process that are caused by manufacturing or assembly processdeficiencies. PFMEA identifies potential product related process failure modes. assessesthe potential customer effects of the failures, identifies the potential manufacturing orassembly process causes and identifies process variables on which to focus controls ormonitoring. It develops a ranked list of potential failure modes, establishing a prioritysystem for corrective action considerations, documents the results of the manufacturing orassembly process and identifies process deficiencies. It also identifies confirmed criticalcharacteristics and/or significant characteristics and operator safety concerns. PFMEAfeeds information on design changes required and manufacturing feasibility back to thedesigners.Service FMEA, which is used to analyze services and their design. Analyzes serviceindustry processes before they are released to impact the customer.Software FMEA, which is used to analyze software products. This type of FMEA is usedto analyze software in combination with hardware.Usage of FMEAFMEA should be used in these situations:- When a process, product or service is being designed or redesigned, and after qualityfunction deployment.- When an existing process, product or service is being applied in a new way.- Before developing control plans for a new or modified process.- When improvement goals are planned for an existing process, product or service.- When analyzing failures of an existing process, product or service.- Periodically throughout the life of the process, product or serviceFMEA should be used to identify:- critical or hazardous conditions.- potential failure modes- need for fault detection.- effects of the failures.In long term view, FMEA:- aids in producing block-diagram reliability analysis- aids in producing diagnostic charts for repair purposes and maintenance handbooks.- is used to design a built-in test (BIT), failure detection & redundancy.- helps in analysis of testability.- is used for retention as formal records of the safety and reliability analysis, which are tobe used as evidence in product safety law-suit.
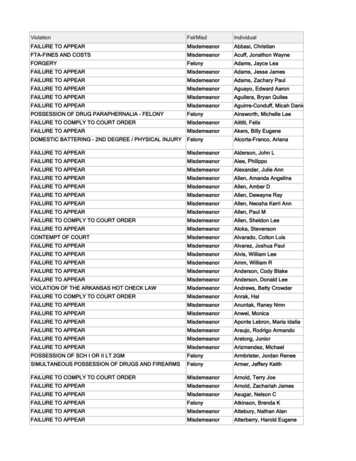
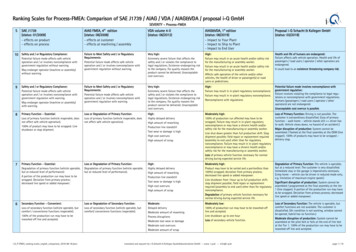
Process of FMEAFMEA consists of three main phases. In the first phase of identification, one needs todetermine what can go wrong. In the second phase of analysis, one is required to identifythe probability of failure, its consequences and according to this calculate the risk prioritynumber. In the third phase one should think out how to eliminate the occurrence or reducethe severity of undesired results.Example of filled FMEA sheetFMEA measurementsEase of DetectionA – EasyImmediately detected and alarmedB – Limited Detected with delay or needs observationC – Difficult No detection availableFrequency of OccurrenceA – Operational eventsB – Likely eventsMore than once per year1/y 10-2/yC – Unlikely events 10-2 10-4/yD – Extremely unlikely eventsLess than 10-4/yRisk PotentialI – NormalOperational caution requiredII – Danger Limited function
III – Minor hazard Immediate halt and repairIV – Major hazard Accident, damage of facilityV – Extreme Possible environmental effectAlternative risk potential categories:Category I - Catastrophic: A failure which may cause death or weapon system loss (i.e.,aircraft, tank, missile, ship, etc.)Category II - Critical: A failure which may cause severe injury, major property damage, ormajor system damage which will result in mission loss.Category III - Marginal: A failure which may cause minor injury, minor property damage,or minor system damage which will result in delay or loss of availability or missiondegradation.Category IV - Minor: A failure not serious enough to cause injury, property damage orsystem damage, but which will result in unscheduled maintenance or repair.
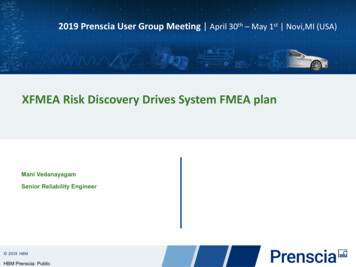
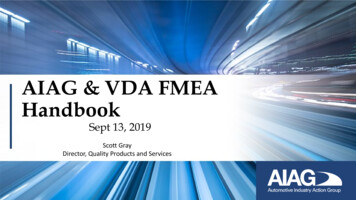
Example of FMEA worksheet with categorization
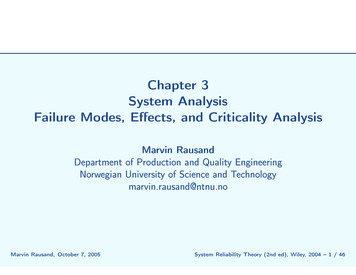
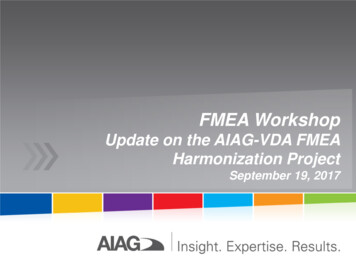
How to perform FMEA (by asq.org)1. Assemble a cross-functional team of people with diverse knowledge about the process,product or service and customer needs. Functions often included are: design,manufacturing, quality, testing, reliability, maintenance, purchasing (and suppliers), sales,marketing (and customers) and customer service.2. Identify the scope of the FMEA. Is it for concept, system, design, process or service?What are the boundaries? How detailed should we be? Use flowcharts to identify thescope and to make sure every team member understands it in detail. (From here on, we’lluse the word “scope” to mean the system, design, process or service that is the subject ofyour FMEA.)3. Fill in the identifying information at the top of your FMEA form. The remaining stepsask for information that will go into the columns of the form.Example of a FMEA worksheet4. Identify the functions of your scope. Ask, “What is the purpose of this system, design,process or service? What do our customers expect it to do?” Name it with a verb followedby a noun. Usually you will break the scope into separate subsystems, items, parts,assemblies or process steps and identify the function of each.5.For each function, identify all the ways failure could happen. These are potential failure
modes. If necessary, go back and rewrite the function with more detail to be sure thefailure modes show a loss of that function.6. For each failure mode, identify all the consequences on the system, related systems,process, related processes, product, service, customer or regulations. These are potentialeffects of failure. Ask, “What does the customer experience because of this failure? Whathappens when this failure occurs?”7. Determine how serious each effect is. This is the severity rating, or S. Severity is usuallyrated on a scale from 1 to 10, where 1 is insignificant and 10 is catastrophic. If a failuremode has more than one effect, write on the FMEA table only the highest severity ratingfor that failure mode.8. For each failure mode, determine all the potential root causes. Use tools classified ascause analysis tool, as well as the best knowledge and experience of the team. List allpossible causes for each failure mode on the FMEA form.9. For each cause, determine the occurrence rating, or O. This rating estimates theprobability of failure occurring for that reason during the lifetime of your scope.Occurrence is usually rated on a scale from 1 to 10, where 1 is extremely unlikely and 10 isinevitable. On the FMEA table, list the occurrence rating for each cause.10. For each cause, identify current process controls. These are tests, procedures ormechanisms that you now have in place to keep failures from reaching the customer.These controls might prevent the cause from happening, reduce the likelihood that it willhappen or detect failure after the cause has already happened but before the customer isaffected.11. For each control, determine the detection rating, or D. This rating estimates how wellthe controls can detect either the cause or its failure mode after they have happened butbefore the customer is affected. Detection is usually rated on a scale from 1 to 10, where 1means the control is absolutely certain to detect the problem and 10 means the control iscertain not to detect the problem (or no control exists). On the FMEA table, list thedetection rating for each cause.12. (Optional) Is this failure mode associated with a critical characteristic? (Criticalcharacteristics are measurements or indicators that reflect safety or compliance withgovernment regulations and need special controls.) If so, a column labeled “Classification”receives a Y or N to show whether special controls are needed. Usually, criticalcharacteristics have a severity of 9 or 10 and occurrence and detection ratings above 3.13. Calculate the risk priority number, or RPN, which equals S O D. Also calculateCriticality by multiplying severity by occurrence, S O. These numbers provide guidancefor ranking potential failures in the order they should be addressed.14. Identify recommended actions. These actions may be design or process changes to
lower severity or occurrence. They may be additional controls to improve detection. Alsonote who is responsible for the actions and target completion dates.15. As actions are completed, note results and the date on the FMEA form. Also, note newS, O or D ratings and new RPNs.FMECA – FMEA with Criticality AnalysisThe purpose of the Criticality Analysis is to rank each failure mode as identified in theFMEA, according to each failure mode's severity classification and its probability ofoccurrence. MIL-STD-1629 is an excellent data source for the implementation of aCriticality Analysis. The result of the Criticality Analysis will leads itself to thedevelopment of a Criticality Matrix. The failure mode criticality number for each specificfailure mode (Cm) is calculated as follows: Cm βαλpt, whereCm is failure mode criticality numberβ is conditional probability of failure effectα is failure mode ratioλp is part failure rate per million hourst is duration of relevant mission phaseThe resulting FMECA analysis will enable a criticality matrix to be constructed. Thecriticality matrix displays the distribution of all the failure mode criticality numbersaccording to the severity category and referring to the criticality scale. According to MilStd-1629 the scale is divided into five levels:Level A - Frequent. The high probability is defined as a probability which is equal orbigger than 0.2 of the overall system probability of failure during the defined missionperiod.Level B - Reasonable probable. The reasonable (moderate) probability is defined asprobability which is more than 0.1 but less than 0.2 of the overall system probability offailure during the defined mission period.Level C - Occasional probability. The occasional probability is defined as a probability,which is more than 0.01 but less than 0.1 of the overall system probability of failure duringthe defined mission period.Level D - Remote probability. The remote probability is defined as a probability, which ismore than 0.001 but less than 0.01 of the overall system probability of failure during thedefined mission period.
Level E - Extremely unlikely probability. The extremely unlikely probability is defined asprobability which is less than 0.001 of the overall system probability of failure during thedefined mission period.Compiled from following //www.mtain.com/relia/relfmeca.htm
FTA – Fault Tree AnalysisFTA is a top-down failure analysis used for discovering the root causes of failures orpotential failures. It uses boolean logic to combine a series of lower-level events.The symbols used in a single FTA Logic Diagram are called Logic Gates and are similar tothe symbols used by electronic circuit designers. A FTA is a status driven analysis wherethe inputs to a Logic Gate represent the status of a part and/or other factor being includedin the analysis. Other factors can include such things as training, tools, safety equipment,supervision etc. The output from a Logic Gate is a logic state that represents a conditionthat exists in the system. An event occurs when the output of a Gate changes state.If a part or other factor is functioning correctly, the state is TRUE. If the part or other factoris malfunctioning, the state is FALSE. When a logic statement is TRUE it is assigned aBoolean logic value of one (1). When a logic statement is FALSE it is assigned a Booleanlogic value of zero (0). The FTA Logic Diagrams included in this analysis use the symbolslisted in attached Logic Symbol Diagram. All Boolean Algebra rules are applicable.An FTA is performed by systematically determining what happens to the system when thestatus of a part or other factor changes. The minimum criteria for success is that no singlefailure can cause injury or an undetected loss of control over the process. Where extremehazards exist or when high value product is being processed, the criteria may be increasedto require toleration of multiple failures.An FTA requires consideration of both positive and negative events. The logic treesegments leading to a Negative Event, such as an accident, defines all of the things thatcould go wrong to cause the negative event. Logic tree segments for negative eventsusually use more OR gates than AND gates, except for redundant safeguards.The logic tree segment leading to a positive event defines all of the things that must worktogether for the machine to operate or to complete a successful mission. Logic trees forpositive events generally use more AND gates than OR gates, except for redundancy.Maintenance troubleshooting trees are a good examples of logic trees for positive events.Inverting the output of a positive event converts it into a negative event.NAND and NOR gates are used primarily to define countermeasures that, if true, willallow the system to tolerate conditions that would otherwise result in safety hazards ormachine failure. Bass Associates Inc. combines Positive Events, Negative Events andCountermeasures into the FTA Logic Diagram to provide a comprehensive systemanalysis.
History of FTAFTA was developed at Bell Laboratories in 1962 by H.A. Watson. It was aimed to evaluatethe Minuteman I Intercontinental Ballistic Missile. In 1966, Boeing further developed andrefined procedures and began to use it in civil aircraft design. After crash of Apollo 1, FTAwas performed on the whole Apollo system. Other notable usages consists of failureanalysis of NPP Three Mile Island accident in 1979 and Challenger space shuttle accidentin 1986. FTA has also been adopted by the automotive industry, chemical process industry,rail industry and robotics industry.StandardizationFTA standardized in several industry and government standards, including NRCNUREG–0492 for the nuclear power industry, an aerospace-oriented revision to NUREG–0492 for use by NASA, SAE ARP4761 for civil aerospace, MIL–HDBK–338 for militarysystems for military systems. IEC standard IEC 61025 is intended for cross-industry useand has been adopted as European Norme EN 61025.FTA procedure (by faa.org)1. Assume a system state and identify and clearly document state the top level undesiredevent(s). This is often accomplished by using the PHL or PHA. Alternatively, designdocumentation such as schematics, flow diagrams, level B & C documentation mayreviewed.2. Develop the upper levels of the trees via a top down process. That is determine theintermediate failures and combinations of failures or events that are the minimum to causethe next higher level event to occur. The logical relationships are graphically generated asdescribed below using standardized FTA logic symbols.3. Continue the top down process until the root causes for each branch is identified and/oruntil further decomposition is not considered necessary.4. Assign probabilities of failure to the lowest level event in each branch of the tree. Thismay be through predictions, allocations, or historical data.5. Establish a Boolean equation for the tree using Boolean logic and evaluate theprobability of the undesired top level event.6. Compare to the system level requirement. If it the requirement is not met, implementcorrective action. Corrective actions vary from redesign to analysis refinement.
Based on available data, probabilities of occurrences for each event can be assigned.Algebraic expressions can be formulated to determine the probability of the top levelevent occurring. This can be compared to acceptable thresholds and the necessity anddirection of corrective action determined.The FTA shows the logical connections between failure events and the top level hazard orevent. "Event," the terminology used, is an occurrence of any kind. Hazards and normal orabnormal system operations are examples. For example, both "engine overheats" and"frozen bearing" are abnormal events. Events are shown as some combination of
rectangles, circles, triangles, diamonds, and "houses." Rectangles represent events that area combination of lower level events. Circles represent events that require no furtherexpansion. Triangles reflect events that are dependent on lower level events where theanalyst has chosen to develop the fault tree further. Diamonds represent events that arenot developed further, usually due to insufficient information. Depending upon criticality,it may be necessary to develop these branches further.FTA symbols can depict all aspects of NAS events. The example reflects a hardware basedproblem. More typically, software (incorrect assumptions or boundary conditions), humanfactors (inadequate displays), and environment conditions (ice) are also included, asappropriate.Events can be further broken down as primary and secondary. A primary event is acoolant pump failure caused by a bad bearing. A secondary event would be a pump failurecaused by ice through the omission of antifreeze in the coolant on a cold day. The analystmay also distinguish between faults and failures. An ignition turned off at the wrong timeis a fault, an ignition switch that will not conduct current is an example of failure.Events are linked together by "AND" and "OR" logic gates. An "AND" gate is used for theignition failure illustrating that the ignition systems are redundant. That is both must failfor the engine to fail. These logic gates are called Boolean gates or operators. Boolean
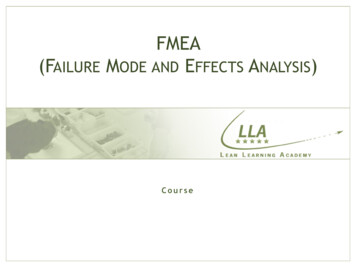
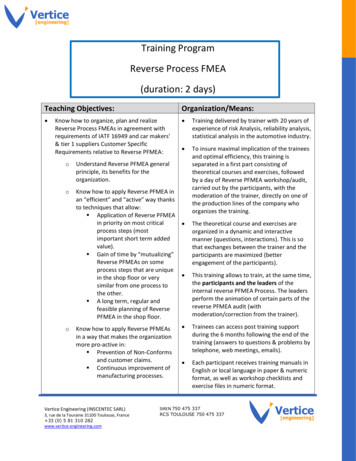
algebra is used for the quantitative approach.As previously stated, the FTA is built through a deductive "top down" process. It is adeductive process in that it considers combinations of events in the "cause" path asopposed to the inductive approach, which does not. The process is asking a series oflogical questions such as "What could cause the engine to fail?" When all causes areidentified, the series of questions is repeated at the next lower level, i.e., "What wouldprevent fuel flow?" Interdependent relationships are established in the same manner.When a quantitative analysis is performed, probabilities of occurrences are assigned toeach event. The values are determined through analytical processes such as reliabilitypredictions, engineering estimates, or the reduction of field data (when available). Acompleted tree is called a Boolean model.Example of FTA graph
The probability of occurrence of the top level hazard is calculated by generating a Booleanequation. It expresses the chain of events required for the hazard to occur. Such anequation may reflect several alternative paths. Boolean equations rapidly become verycomplex for simple looking trees. They usually require computer modeling for solution. Inaddition to evaluating the significance of a risk and the likelihood of occurrence, FTAsfacilitate presentations of the hazards, causes, and discussions of safety issues. They cancontribute to the generation of the Master Minimum Equipment List (MMEL). The FTA'sgraphical format is superior to the tabular or matrix format in that the inter-relationshipsare obvious. The FTA graphic format is a good tool for the analyst not knowledgeable ofthe system being examined. The matrix format is still necessary for a hazard analysis topick up severity, criticality, family tree, probability of event, cause of event, and otherinformation.Software FTASoftware fault tree analysis was developed in 1983. The process paralleled standard FTAprinciples, starting with a top event and working backwards through the tree, generating apath that showed the necessary hardware as well as software events that had to occur.SFTA, like FTA starts with a defined top event. This event is described through a hazardanalysis and is usually a safety critical event. The process assumes, that the system hasfailed according to the defined event and works backwards to determine the set ofpossible paths that allow the event to occur. This path is made up of further decomposedevents connected by hates similar to those in FTA. Events are continually expanded untileither they cannot be developed further due to lack of information or insufficientconsequences or they no longer require analysis. Once the tree has been fully expandedand analyzed, it can be shown that the program either allows or disallows the top eventstate to be reached. This information is then used to correct the program, if required,eliminating the undesired event's occurrence. Each event in the set of undesirable events isthen analyzed in a similar fashion. It has been shown, that for large systems the use ofpartial SFTA can be effective in finding faults and in identifying critical modules that mayneed further analysis.Unlike hardware fault trees where each hazard or event can be assigned a givenprobability of failure due to big amounts of historical data, software failures are in and ofthemselves logical, not lending themselves to a level of probability. The software eitherworks or it does not. This distinction between probabilistic hardware fault trees andlogical software fault trees is important in understanding the complexity involved intrying to conduct a complete software analysis.In summary, SFTA can be used to determine software safety requirements, detect logic
errors and identify multiple failure sequences involving different parts of the system thatlead to hazardous events.Competing technologiesAlternatives to FTA include Dependance Diagram (DD), also known as Reliability BlockDiagram (RBD) and Markov Analysis. A Dependence Diagram is equivalent to a SuccessTree Analysis (STA), the logical inverse of an FTA, and depicts the system using pathsinstead of gates. DD and STA produce probability of success (i.e., avoiding a top event)rather than probability of a top event.Compiled using following dfhttp://www.faa.gov/library/manuals/aviation/risk management/ss handbook/media/Chap9 1200.pdfhttp://www.dtic.mil/cgi-bin/GetTRDoc?AD ADA303377&Location U2&doc GetTRDoc.pdfhttp://syque.com/quality tools/toolbook/FTA/example.htm
FTA and FMEA comparisonFTA is a deductive, top-down method aimed at analyzing the effects of initiating faultsand events on a complex system. This contrasts with Failure Mode and Effects Analysis(FMEA), which is an inductive, bottom-up analysis method aimed at analyzing the effectsof single component or function failures on equipment or subsystems. FTA is very good atshowing how resistant a system is to single or multiple initiating faults. It is not good atfinding all possible initiating faults. FMEA is good at exhaustively cataloging initiatingfaults, and identifying their local effects. It is not good at examining multiple failures ortheir effects at a system level. FTA considers external events, FMEA does not. In civilaerospace the usual practice is to perform both FTA and FMEA, with a Failure ModeEffects Summary (FMES) as the interface between FMEA and FTA.
How to perform FMEA (by asq.org) 1. Assemble a cross-functional team of people with diverse knowledge about the process, product or service and customer needs. Functions often included are: design, manufacturing, quality, testing, reliability, maintenance, purchasing (and suppliers),