Transcription
Failure Modes and EffectsAnalysis (FMEA)New 7 Step Approach!QSG Quarterly MeetingOctober 25, 2019Laura 36-1124 www.qualitysupportgroup.com 2019
Agenda FMEA Alignment of AIAG & VDA 7 Step Approach Revised Rating Tables Key Changes Transition Strategy2888-336-1124 www.qualitysupportgroup.com 2019
FMEA Alignment of AIAG & VDA3888-336-1124 www.qualitysupportgroup.com 2019
FMEA Alignment of AIAG & VDA4888-336-1124 www.qualitysupportgroup.com 2019
FMEA Alignment of AIAG & VDA Automotive suppliers to both North American and GermanOEMs were required to assess their failure modes andeffects differently Differences between the Severity, Occurrence, and Detection ratingtables in the AIAG and VDA FMEA Manuals Caused confusion and added complexity to productdevelopment and process improvement activities Alignment was needed in order to create a common set ofrequirements so suppliers can have a single FMEA businessprocess meeting needs and expectations of any of theirautomotive customers5888-336-1124 www.qualitysupportgroup.com 2019
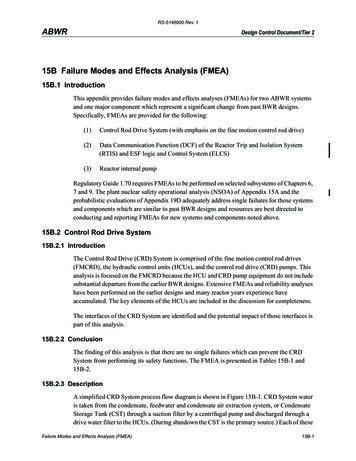
7 Step Approach6888-336-1124 www.qualitysupportgroup.com 2019
7 Step Approach7888-336-1124 www.qualitysupportgroup.com 2019
Source: AIAG / VDA FMEA Handbook8888-336-1124 www.qualitysupportgroup.com 2019
Step 1: Planning & PreparationFive T’sQuestions to AnswerInTent Have all Core Team Members received training on FMEAs? Have all Core Team Members allocated time to fully participate?Timing What APQP Phase or VDA Maturity Level is the project in? What is the FMEA Start Date and Target Completion Date?Team Have the team members been assigned with clearly defined rolesand responsibilities (Leader, Facilitator, Champion, Core TeamMember, Extended Team Member)?Task Tools Will a spreadsheet or specific software program be used todocument the results?Is the scope of the study clear?Has the documentation/reporting methodology been clarified?Will the FMEA Report be shared with customers?Will the FMEA results be audited?9888-336-1124 www.qualitysupportgroup.com 2019
Step 2: Structure AnalysisDFMEA Identification of designinterfaces, interactions,close clearance Tools: Structure tree Block diagram Boundary diagramPFMEA Identification of processsteps and sub-steps Tools: Structure tree Process flow diagram10888-336-1124 www.qualitysupportgroup.com 2019
Step 3: Function AnalysisDFMEA Association ofrequirements to functions Tools: Function analysis tree Parameter diagramPFMEA Association ofcharacteristics to functions Tools: Function analysis tree Parameter diagramSource: AIAG / VDA FMEA Handbook11888-336-1124 www.qualitysupportgroup.com 2019
Step 4: Failure AnalysisDFMEA Potential Failure Effects,Failure Modes, FailureCauses for each productfunction Tools: Parameter diagramPFMEA Potential Failure Effects,Failure Modes, FailureCauses for each processfunction Tools: Fishbone diagram (4M)Source: AIAG / VDA FMEA Handbook12888-336-1124 www.qualitysupportgroup.com 2019
Step 5: Risk AnalysisDFMEA Assignment of PreventionControls to Risk Causes Risk Ratings (Dev, Occ, Det) Evaluation of Action PriorityPFMEA Assignment of PreventionControls to Risk Causes Risk Ratings (Dev, Occ, Det) Evaluation of Action PrioritySource: AIAG / VDA FMEA Handbook13888-336-1124 www.qualitysupportgroup.com 2019
Step 6: OptimizationDFMEA Assignment ofresponsibilities and duedates Implementation of actionsPFMEA Assignment ofresponsibilities and duedates Implementation of actionsSource: AIAG / VDA FMEA Handbook14888-336-1124 www.qualitysupportgroup.com 2019
Step 7: Results Documentation Communicate results and conclusions of theanalysis Within organization With customers and/or suppliers (as appropriate) Document actions taken including effectiveness15888-336-1124 www.qualitysupportgroup.com 2019
Revised Rating Tables16888-336-1124 www.qualitysupportgroup.com 2019
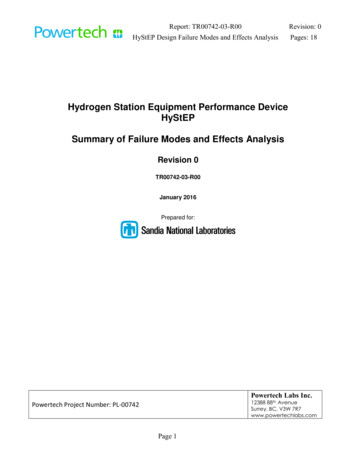
DFMEA Severity TableSource: AIAG / VDA FMEA Handbook17888-336-1124 www.qualitysupportgroup.com 2019
DFMEA Occurrence Table18888-336-1124 www.qualitysupportgroup.com 2019
19888-336-1124 www.qualitysupportgroup.com 2019
DFMEA Detection TableSource: AIAG / VDA FMEA Handbook20888-336-1124 www.qualitysupportgroup.com 2019
PFMEA Severity TableSource: AIAG / VDA FMEA Handbook21888-336-1124 www.qualitysupportgroup.com 2019
Source: AIAG / VDA FMEA Handbook22888-336-1124 www.qualitysupportgroup.com 2019
PFMEA Occurrence TableSource: AIAG / VDA FMEA Handbook23888-336-1124 www.qualitysupportgroup.com 2019
PFMEA Detection TableSource: AIAG / VDA FMEA Handbook24888-336-1124 www.qualitysupportgroup.com 2019
Source: AIAG / VDA FMEA Handbook25888-336-1124 www.qualitysupportgroup.com 2019
Action Priority High (H): Required to identify appropriate action to improve Preventionand/or Detection Controls; OR justify and document why currentcontrols are adequate Priority Medium (M): Should identify appropriate actions to improve prevention and/ordetection controls; OR, at the discretion of management, justify anddocument why current controls are adequate Priority Low (L): Could identify actions to improve prevention or detection controls26888-336-1124 www.qualitysupportgroup.com 2019
FMEA Action Priority TableSource: AIAG / VDA FMEA Handbook27888-336-1124 www.qualitysupportgroup.com 2019
Source: AIAG / VDA FMEA Handbook28888-336-1124 www.qualitysupportgroup.com 2019
Key Changes29888-336-1124 www.qualitysupportgroup.com 2019
DFMEA Structure AnalysisAIAG 4th Ed FMEANew AIAG-VDA 1st Ed FMEAItem &Function30888-336-1124 www.qualitysupportgroup.com 2019
DFMEA Function AnalysisAIAG 4th Ed FMEANew AIAG-VDA 1st Ed FMEAItem &Function31888-336-1124 www.qualitysupportgroup.com 2019
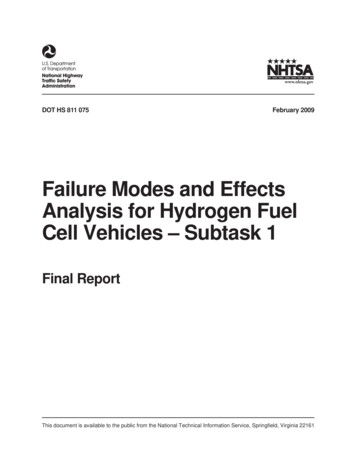
DFMEA Failure AnalysisAIAG 4th Ed FMEAClassificationPotentialEffect(s) ofFailureSeverityPotentialFailureModeNew AIAG-VDA 1st Ed FMEAPotentialCause(s)/Mechanism(s)of Failure32888-336-1124 www.qualitysupportgroup.com 2019
DFMEA Risk AnalysisRemoved – special characteristic identification not required in DFMEA; can useFilter Code column (optional)33888-336-1124 www.qualitysupportgroup.com 2019
PFMEA Structure Analysis34888-336-1124 www.qualitysupportgroup.com 2019
PFMEA Function Analysis35888-336-1124 www.qualitysupportgroup.com 2019
PFMEA Failure AnalysisNew AIAG-VDA 1st Ed FMEAAIAG 4th Ed FMEAPotential Failure Mode Potential Failure EffectsSEVClassPotentialCauses(s)of Failure36888-336-1124 www.qualitysupportgroup.com 2019
PFMEA Risk Analysis37888-336-1124 www.qualitysupportgroup.com 2019
DFMEA Optimization38888-336-1124 www.qualitysupportgroup.com 2019
Transition Strategy39888-336-1124 www.qualitysupportgroup.com 2019
Transition Strategy(Automotive Suppliers) Existing FMEAs developed per the AIAG 4th Edition canremain Plan the transition From current FMEA processes and methods to the new AIAG VDAFMEA process and tools Use existing FMEAs for a starting point Consider: Minor or major change, New rating scales, Analyticalmethods and format New projects Consider: Company leadership mandates, Customer Specific RequirementsTransition date and milestones40888-336-1124 www.qualitysupportgroup.com 2019
Questions?41888-336-1124 www.qualitysupportgroup.com 2019
25.10.2019 · FMEA Alignment of AIAG & VDA Automotive suppliers to both North American and German OEMs were required to assess their failure modes and effects differently Differences between the Severity, Occurrence, and Detection rating tables in the AIAG and VDA FMEA Manuals Caused confusion and added complexity to product