Transcription
The Relationship Between Science andEngineering Education and Employment inSTEM OccupationsAmerican Community Survey ReportsBy Liana Christin LandivarIssued September 2013ACS-23INTRODUCTIONScience, technology, engineering, and mathematics(STEM) workers account for just 6 percent of theU.S. workforce, yet they are essential to economicgrowth, innovation, and global competitiveness. Largeinvestments in science and technology during thetwentieth century led to the creation of new industriesand employment opportunities, increased economicprosperity, and improved quality of life.1 Governmentand private industry have emphasized the need toincrease the STEM workforce. Leaders cite concernswith national security, maintenance of internationalstanding in research and development, and leadershipin innovation. In 2007, Congress passed the AmericaCOMPETES Act, reauthorized in 2010, to increaseeconomic competitiveness by promoting STEM education and increasing research investment.2 The NationalAcademy of Sciences, National Academy of Engineering, and Institute of Medicine report Rising Above theGathering Storm also calls for increased funding forK–12, college, and graduate education in STEM fieldsand for research and development.31Committee on Science, Engineering, and Public Policy, 2010,“Rising Above the Gathering Storm, Revisited: Rapidly ApproachingCategory 5,” National Academy of Sciences, National Academy ofEngineering, and Institute of Medicine of the National Academies, TheNational Academies Press, Washington, DC.2America Creating Opportunities to Meaningfully PromoteExcellence in Technology, Education, and Science Act, Public Law No:110-69, August 9, 2007, ubl69.pdf .3Committee on Science, Engineering, and Public Policy, 2007,“Rising Above the Gathering Storm: Energizing and Employing Americafor a Brighter Economic Future,” National Academy of Sciences,National Academy of Engineering, and Institute of Medicine of theNational Academies, The National Academies Press, Washington, DC.U.S. Department of CommerceEconomics and Statistics AdministrationU.S. CENSUS BUREAUcensus.govA question one might ask is whether increased trainingin science and engineering yields more STEM workers.This report explores the links between educationalattainment, science and engineering training in college, and employment in a STEM occupation.4 Severalpathways may increase the STEM workforce. Scienceand engineering training in college could result insubsequent STEM employment. Alternatively, or inaddition, the number of STEM workers without a bachelor’s degree in a science and engineering field couldgrow. This report uses the 2011 American CommunitySurvey (ACS) to provide statistics on the educationalattainment of STEM workers, detailing how many STEMworkers are college and noncollege graduates. Thisreport also shows the leading STEM occupations byeducational attainment, and the percentage of scienceand engineering graduates who are currently employedin a STEM occupation. Finally, the report shows thegeographic concentration of STEM workers by educational attainment.HIGHLIGHTS In 2011, there were 7.2 million STEM workers aged25 to 64, accounting for 6 percent of the workforce. Half of STEM workers worked in computeroccupations. An additional 7.8 million workers wereemployed in STEM-related occupations, most ofwhich were in health care. About 70 percent of STEM workers had at least abachelor’s degree, while 30 percent of STEM workershad less than a bachelor’s degree.4To learn more about the demographic characteristics of STEMworkers, see www.census.gov/people/io/publications/reports.html .
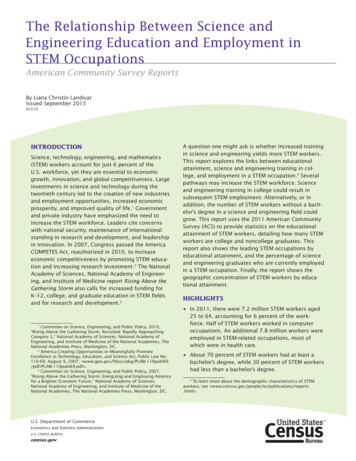
Of the 40.6 million employedcollege graduates aged 25 to 64,36 percent reported a scienceor engineering major for theirbachelor’s degree. The vast majority of workerswho have been trained in science and engineering are notcurrently working in a STEMoccupation. Only 26 percent ofscience and engineering graduates are currently employed in aSTEM occupation. Instead, theyare employed in fields such asnon-STEM management, healthcare, law, education, social work,accounting, or counseling.WHAT IS STEM?Classification (SOC) manual.5 Allfederal statistical agencies usethe SOC to classify workers andjobs into occupational categories.The SOC was first published in1980 with subsequent revisionsin 2000 and 2010. The revisionprocess is carried out by the Standard Occupational ClassificationPolicy Committee (SOCPC), whichincluded representatives of ninefederal agencies for the 2010 revision. The SOC primarily classifiesworkers based on the type of workperformed, rather than the education or training required.6 CensusBureau occupation codes, based onthe 2010 SOC, provide 539 specificoccupational categories arrangedinto 23 major occupational groups.7ACS respondents were asked towrite descriptions of the type ofwork and activities they do on thejob (Figure 1). These responseswere then coded into one of the539 Census Bureau occupations.STEM workers are thoseemployed in science, technology,engineering, and mathematicsoccupations. This includes computer and mathematical occupations, engineers, engineeringtechnicians, life scientists, physical scientists, social scientists,and science technicians. STEM issubject-matter driven. As such,it includes managers, teachers,practitioners, researchers, andtechnicians. Although the majority of the STEMPersonworkforcehas1 (continued)at least a bachelor’s degree, thequestions41 – 46 if this personSTEM workforcealsoincludesL Answerworked in the past 5 years. Otherwise,SKIP to question47.those with associate’sdegreesand high school diplomas. The41 – 46 CURRENT OR MOST RECENT JOBACTIVITY.Describe clearlythis person’s chiefCensus Bureaujoboccupationcodeactivity or business last week. If this personhad more than one job, describe the one atlist contains 63whichSTEMoccupathis person worked the most hours. If thisperson had no job or business last week, giveinformationhis/her lasttions, accountingfor forabout6job or business.41Wasthisperson–percent of the civilianworkforceMark (X) ONE box.aged 25 to 64. an employee of a PRIVATE FOR-PROFITFigure 1.Reproduction of theWrite-In Questions onOccupation From the2011 AmericanCommunity Survey45 What kind of work was this person doing?(For example: registered nurse, personnel manager,supervisor of order department, secretary,accountant)There has been a lack of consensuson who qualifies as a STEM worker.8To enhance comparability of dataacross statistical agencies andorganizations studying the STEMworkforce, the SOCPC convenedthroughout 2011 at the request ofthe Office of Management andBudget (OMB) to create guidelinesfor the classification of STEMworkers.9 The SOCPC identifiedthree occupational domains: (1)science, engineering, mathematics, and information technologyoccupations; (2) science- andengineering-related occupations;and (3) nonscience and engineering occupations. The final recommendations issued by the SOCPCwere reviewed by outside agenciesand approved by the OMB in April2012.10 This report follows theSOCPC recommendations and is thefirst Census Bureau report issuedwith the recommended STEMworker classification. To apply therecommendations to Census Bureauoccupations, some exceptions werenecessary because of a lack ofdetail to separate STEM and nonSTEM workers (e.g., postsecondaryteachers are not separated by subject matter) (Table1). The final list13191119of Census Bureau occupations usedd. Socialor RailroadisRetirement.in Securitythis reportavailable at www.census.gov/people/io .00Yes ,No/methodology/ .TOTAL AMOUNT for past12 months8e. SupplementalSecurityIncome (SSI).DavidLangdon,George46 What were this person’s most importantactivities or duties? (For example: patient care,directing hiring policies, supervising order clerks,typing and filing, reconciling financial records)47 INCOME IN THE PAST 12 MONTHSTheMarkSOCis foravailableat(X) manualthe "Yes" boxeach type ofonlineincome thiscompany or business, or of an individual, forperson received, and give your best estimate of the www.bls.gov/soc .wages, salary, or commissions?TOTAL AMOUNT during the PAST 12 MONTHS.6(NOTE:The "past 12 months"is the periodfromClassificationPrinciple2 states,an employee of a PRIVATE NOT-FOR-PROFIT, SOCtoday’s date one year ago up through today.)tax-exempt, or charitable organization? “Occupationsare classified based on the work5CLASSIFICATIONa local GOVERNMENT employeeMarkand,(X) thein"No"box tocasesshow typesincomeperformedsomeon oftheskills,NOT received.education, and/or training needed to performa state GOVERNMENT employee?net income was a loss, mark the "Loss" box tothe workIftheata competentlevel.”rightof the dollar amount.Occupational Classificationa Federal GOVERNMENT employee?7The Census Bureau has developed andFor income received jointly, report the appropriateSELF-EMPLOYED in own NOT INCORPORATEDownpersonoccupationlist sinceshareitsfor each– or, if that’scodenot possible,business,practice, or farm? maintainedOccupation statisticsareprofessionalcompiledthe whole amountfor onlyone person andit startedreportcollectingdata onoccupationinmark the "No" box for the other person.SELF-EMPLOYED in own INCORPORATEDfrom data that are codedbasedonbusiness, professional practice, or farm? 1850. The Census Bureau occupation codea. Wages, salary,commissions,ofbonuses,list has followedthe structurethe Standardthe 2010 Standard workingOccupationalWITHOUT PAY in family businessor tips from all jobs. Report amount beforeor s.deductionsfor taxes, bonds,dues, orimplemented in 1980, but the Census Bureau42 For whom did this person work? .00Yes categoriesaggregates smallerfor confidentiIf now on active duty in,the Armed Forces, mark (X) this box Noality and statisticalprecision.(city, county, etc.)?TOTAL AMOUNT for past12 monthsand print the branch of the Armed Forces.Name of company, business, or other employer243 What kind of business or industry was this?STEM Occupation ClassificationDescribe the activity at the location where employed.(For example: hospital, newspaper publishing, mailorder house, auto engine manufacturing, bank)McKittrick, DavidBeede, Beethika Khan, and Mark Doms, 2011, .00Yes ,“STEM: Good JobsNow and for the Future,”NoTOTALAMOUNTfor pastAdministration,EconomicsandStatistics12 monthsIssue Brief #03-11, ntsf. Anypublic assistance or welfare paymentsfromthe state or local welfare office./stemfinalyjuly14 1.pdf .9The SOCPC formed a STEM workgroup .00Yes ,with representativesfrom Department ofNoLabor, Bureauof LaborStatistics, andTOTAL AMOUNTfor pastmonthsEmployment 12TrainingAdministration; theDepartmentoforCommerce,Census Bureau;g. Retirement,survivor,disability pensions.Do theNOT includeSocial Security.Departmentof Defense, DefenseManpower Data Center; the Equal.00Yes EmploymentOpportunityCommission; the,NoDepartmentofAMOUNTHealthforandTOTALpast Human Services,12 monthsHealth Resourcesand Services Administration;theDepartmentof Education, Nationalh. Any other sources of income receivedregularlysuchas EducationVeterans’ (VA)Statistics;payments, and theCenterforunemployment compensation, child supportNationalScienceNational Centeror alimony.Do NOTincludeFoundation,lump sum paymentssuchas moneyfrom andan inheritanceor the saleStatistics.of aforScienceEngineeringhome. 10The final recommendations are availableonline www.bls.gov/soc/#crosswalks .00Yes atNo,TOTAL AMOUNT for past12 monthsb. Self-employment income from own nonfarmU.S.businesses or farm businesses, includingproprietorships and partnerships. Report48 What was this person’s total income during theNET income after business expenses.PAST 12 MONTHS? Add entries in questions 47aYes No ,to 47h; subtract any losses. If net income was a loss,enter the amount and mark (X) the "Loss" box next tothe dollar amount.00TOTAL AMOUNT for past12 monthsLossNone OR .00Census Bureau
Table 1.Classification of STEM, STEM-Related, and Non-STEM OccupationsHigh-level occupation aggregationOccupation groupManagement, business, science, and artsManagementBusiness and financial operationsComputer, math, engineering, andscienceEducation, legal, community service,arts, and mediaHealthcare practitioners and techniciansServiceSTEM occupation classificationNon-STEM (exc. computer and information systems managers, architectural andengineering managers, and natural sciencemanagers)Non-STEMSTEM (exc. architects; incl. computer andinforma tion systems managers, architecturaland engineering managers, natural sciencemanagers, and sales engineers)Non-STEMSTEM-related (incl. architects)Healthcare supportNon-STEMProtective serviceNon-STEMPerson1Food preparationand servingNon-STEM11 What is the highest degree or level of schoolthis person has COMPLETED? Mark (X) ONE box.Building and grounds cleaningNon-STEMIf currently enrolled, mark the previous grade or Please copy the name of Person 1 from page 2,highest degree received.then servicecontinue answering questions below.Personal care andNon-STEMNO SCHOOLING COMPLETEDLast NameNo schooling completedSales and officeSales and relatedFirst NameOffice and administrative supportNatural resources, construction, and maintenance7 Wherethis person born?Farming, fishing,andwasforestryNon-STEMIn the United States – Print name of state.Construction and extractionNon-STEMInstallation, maintenance, and repairNon-STEMProduction, transportation, and material movingOutside the United States – Print name offoreign country, or Puerto Rico, Guam, etc.Field of Degree ClassificationThe ACS provided statistics onfield of bachelor’s degree for thefirst time in 2009. Respondentsaged 25 and over who held aU.S. Census BureauKindergartenYes, born in Puerto Rico, Guam, theU.S. Virgin Islands,or Northern Marianasoccupation-specificclassificationis availableYes, born abroad of U.S. citizen parentor parentsYes, U.S. citizen by naturalization – Print yearof naturalization(For example: Italian, JamaCambodian, Cape VerdeanFrench Canadian, Haitian,Nigerian, Mexican, Taiwan14 a. Does this person speaEnglish at home?Grade 1 through 11 – Specifygrade 1 – 11YesNo SKIP to que12th grade – NO DIPLOMAb. What is this languageHIGH SCHOOL GRADUATEProductionNon-STEM Regular high school diplomaGED or alternative credentialTransportationNon-STEMCOLLEGE OR SOME COLLEGE8 Is this person a citizen of the United States?Material moving Yes, born in the United States SKIP toNon-STEMSome college credit, but less than 1 year of10aNote: The full list of Census STEM occupations used in this report and www.census.gov/people/io/methodology/ .STEM occupations consist primarily of those employed in computerand mathematical occupations,engineers, life scientists, physicalscientists, and social scientists.STEM-related occupations consistprimarily of architects, healthcarepractitioners, and healthcare technicians. Non-STEM occupations areall other occupations not classifiedin STEM or STEM-related occupations. According to the CensusBureau occupation code list, thereare 63 specific STEM occupations,35 STEM-related occupations, and437 non-STEM occupations (excluding military-specific PRESCHOOLTHROUGH GRADE 12MINon-STEM Nursery school13 What is this person’s anatFor example: Korean, Itac. How well does this peVery wellcollege creditWell1 or more years of college credit, no degreeNot wellAssociate’s degree (for example: AA, AS)Not at allBachelor’s degree (for example: BA, BS)AFTER BACHELOR’S DEGREEbachelor’s degree were asked toMaster’s degree (for example: MA, MS, MEng,FigureMEd,2. MSW, MBA)write in the specific field(s) of anyProfessional degree beyond a bachelor’s degreeNo, not a U.S. citizen(forexample: MD, DDS, ofDVM, LLB,JD)Reproductionthebachelor’s degree earned (FigureDoctorate degree (for example: PhD, EdD)9 When did this person come to live in theWrite-In Question onUnited States?Print numbersin boxes.2). The Census BureaucodedtheseYearField of Degree Fromresponses into 188 majors. TheseF Answer question 12 if this person has abachelor’sdegreeor higher. Otherwise,the2011Americanmajors were 10thencategorizedintoa. At any time IN THE LAST 3 MONTHS, has thisSKIP to question 13.person attended school or college? Include Community Surveyonly nurserypreschool, kindergarten,five broad fields and15ordetailedelementary school, home school, and schoolingwhich leads to a high school diploma or a collegefields (Table 2). Thebroad set ofdegree.12 This question focuses on this person’sNo, has not attended in the last 3BACHELOR’S DEGREE. Please print below thefields includes: scienceengimonthsand SKIP toquestion 11specific major(s) of any BACHELOR’S DEGREESthis person has received. (For example: chemicalYes, public school, public collegeneering; science- andengineeringengineering, elementary teacher education,Yes, private school, private college,organizational psychology)home schoolrelated; business;education;andb. What grade or level was this person attending?(X) ONE box.arts, humanities, Markandother. DataNursery school, preschoolon field of degree arenot availableKindergartenGrade 1 through 12 – Specifyfor vocational, graduate,or profesgrade 1 – 12sional degrees.1115 a. Did this person live in1 year ago?Person is under 1question 16Yes, this house No, outside the UnPuerto Rico – Prinor U.S. Virgin Islanthen SKIP to quesNo, different housPuerto Ricob. Where did this personAddress (Number andName of city, town, oName of U.S. countymunicipio in Puerto RName of U.S. state orPuerto RicoCollege undergraduate years (freshman tosenior)Graduate or professional school beyond abachelor’s degree (for example: MA or PhDprogram, or medical or law school)11The field of degree classificationpresented in this reportis§.4 v consistent with8the field of degree classification in AmericanFactFinder tables. The National ScienceFoundation uses slightly different field ofdegree categories, consistent with the ACSPublic Use Microdata Sample files: www.census.gov/acs/www/datadocumentation/pums documentation/ .3
Table 2.Field of Bachelor’s Degree ClassificationBroad fieldsDetailed fieldsScience and engineeringComputers, mathematics, and statisticsBiological, agricultural, and environmental sciencesPhysical and related sciencePsychologySocial sciencesEngineeringMultidisciplinary science studiesScience- and engineering-relatedScience- and engineering-related (e.g., nursing, architecture, mathematics teacher education)BusinessBusiness (e.g., business management, accounting)EducationEducation (e.g., elementary education, general education)Arts, humanities, and otherLiterature and languagesLiberal arts and historyVisual and performing artsCommunicationsOther (e.g., criminal justice, social work)THE RELATIONSHIPBETWEEN FIELD OFBACHELOR’S DEGREE ANDEMPLOYMENT IN STEMOCCUPATIONSEmployment inSTEM OccupationsIn 2011, there were 7.2 millionSTEM workers aged 25 to 64,accounting for 6 percent of theworkforce. Half of STEM workersworked in computer occupations(Figure 3). Engineers and engineering technicians were 32 percent ofthe STEM workforce, followed bylife and physical scientists (12 percent), social scientists (4 percent),and workers employed in mathematical occupations (3 percent).12Figure 3.Occupational Distribution of STEM WorkersAged 25 to 64: 2011(In percent. Data based on sample. For information on confidentialityprotection, sampling error, nonsampling error, and definitions, seewww.census.gov/acs/www/)50Computer workers32EngineersLife and physicalscientists124Social scientistsMathematicalworkers3100The estimate for social scientists is notstatistically different from the estimate formathematics occupations.124Source: U.S. Census Bureau, 2011 American Community Survey.U.S. Census Bureau
Table 3.Employment in STEM Occupations: 2011(Civilian employed aged 25 to 64)Occupation1PercentofSTEMworkNumber MOE2 forceOccupation1PercentofSTEMworkNumber MOE2 forceTotal STEM . . . . . . . . . . . . . . . . . . . . . . . . . 7,227,620 48,618 100 .00Computer occupations . . . . . . . . . . . . . . . . . . . . . 3,614,046 33,846Computer and information systems managers . .504,161 13,167Computer and information research scientists. . .14,981 1,747Computer systems analysts . . . . . . . . . . . . . . . . .431,894 12,361Information security analysts . . . . . . . . . . . . . . . .47,196 3,987Computer programmers . . . . . . . . . . . . . . . . . . . .415,229 9,773Software developers, applications and systemssoftware . . . . . . . . . . . . . . . . . . . . . . . . . . . . . . .851,921 16,796Web developers . . . . . . . . . . . . . . . . . . . . . . . . . .149,739 7,382Computer support specialists . . . . . . . . . . . . . . .463,148 12,148Database administrators . . . . . . . . . . . . . . . . . . .97,415 5,637Network and computer systems administrators . .220,363 8,475Computer network architects . . . . . . . . . . . . . . . .91,677 6,922Computer occupations, all other . . . . . . . . . . . . .326,322 10,125Mathematical occupations . . . . . . . . . . . . . . . . . .Actuaries . . . . . . . . . . . . . . . . . . . . . . . . . . . . . . .Mathematicians . . . . . . . . . . . . . . . . . . . . . . . . . .Operations research analysts . . . . . . . . . . . . . . .Statisticians . . . . . . . . . . . . . . . . . . . . . . . . . . . . .Miscellaneous mathematical scienceoccupations . . . . . . . . . . . . . . . . . . . . . . . . . . . 3,9202,690868Engineering occupations . . . . . . . . . . . . . . . . . . . 2,305,215 26,370Architectural and engineering managers . . . . . . .130,207 5,603Surveyors, cartographers, andphotogrammetrists . . . . . . . . . . . . . . . . . . . . . . .35,190 3,191Aerospace engineers . . . . . . . . . . . . . . . . . . . . . .124,902 5,649Agricultural engineers . . . . . . . . . . . . . . . . . . . . .2,389891Biomedical engineers. . . . . . . . . . . . . . . . . . . . . .13,383 1,851Chemical engineers . . . . . . . . . . . . . . . . . . . . . . .47,214 3,203Civil engineers . . . . . . . . . . . . . . . . . . . . . . . . . . .262,066 9,443Computer hardware engineers . . . . . . . . . . . . . .58,517 4,846Electrical and electronics engineers . . . . . . . . . .203,538 8,039Environmental engineers . . . . . . . . . . . . . . . . . . .24,163 2,364Industrial engineers, including health andsafety . . . . . . . . . . . . . . . . . . . . . . . . . . . . . . . . .156,517 6,969Marine engineers and naval architects . . . . . . . .10,005 1,318Materials engineers . . . . . . . . . . . . . . . . . . . . . . .29,445 2,52550 .00 Engineering occupations—Con.6.98Mechanical engineers . . . . . . . . . . . . . . . . . . . . .0.41Mining and geological engineers . . . . . . . . . . . .5.98Nuclear engineers . . . . . . . . . . . . . . . . . . . . . . . .0.65Petroleum engineers . . . . . . . . . . . . . . . . . . . . . .5.75Engineers, all other . . . . . . . . . . . . . . . . . . . . . . .Drafters . . . . . . . . . . . . . . . . . . . . . . . . . . . . . . . .11.79Engineering technicians, except drafters . . . . . .2.07Surveying and mapping technicians . . . . . . . . . .6.41Sales engineers . . . . . . . . . . . . . . . . . . . . . . . . .1.35Lifeand physical science occupations . . . . . . .3.05Natural sciences managers . . . . . . . . . . . . . . . .1.27Agricultural and food scientists . . . . . . . . . . . . . .4.51Biological scientists . . . . . . . . . . . . . . . . . . . . . . .2 .80Conservation scientists and foresters . . . . . . . . .0.31Medical and all other life scientists3 . . . . . . . . . .0.03Astronomers and physicists . . . . . . . . . . . . . . . .1.84Agricultural and food science technicians . . . . . .0.59Biological technicians . . . . . . . . . . . . . . . . . . . . .Chemical technicians . . . . . . . . . . . . . . . . . . . . .0.04Geological and petroleum technicians . . . . . . . .Nuclear technicians. . . . . . . . . . . . . . . . . . . . . . .31 .89Atmospheric and space scientists . . . . . . . . . . .1.80Chemists and materials scientists. . . . . . . . . . . .Environmental scientists and geoscientists . . . .0.49Physical scientists, all other . . . . . . . . . . . . . . . .1.73Miscellaneous life, physical, and social science0.03technicians . . . . . . . . . . . . . . . . . . . . . . . . . . . .0.190.65 Social science occupations . . . . . . . . . . . . . . . . .3.63Economists . . . . . . . . . . . . . . . . . . . . . . . . . . . . .0.81Survey researchers . . . . . . . . . . . . . . . . . . . . . . .2.82Psychologists . . . . . . . . . . . . . . . . . . . . . . . . . . .0.33Sociologists . . . . . . . . . . . . . . . . . . . . . . . . . . . . .2.170.140.41Urban and regional planners. . . . . . . . . . . . . . . .Miscellaneous social scientists and relatedworkers . . . . . . . . . . . . . . . . . . . . . . . . . . . . . . .Social science research assistants . . . . . . . . . . .189,241 6,7727,889 1,2405,681 1,46123,522 3,059396,704 11,787146,622 6,217352,707 8,42556,169 4,25729,144 3,0032.620.110.080.335.492.034.880.780.40848,514 16,31522,536 1,99125,509 2,18472,804 4,92423,764 2,382122,748 6,20411,331 1,76026,166 2,93119,054 2,55361,175 3,88914,888 2,3243,2298688,407 1,40576,339 4,63266,502 4,444180,332 6,78811 ,5163,19618,4427,6742,5646286,5519692,2103 05Occupation codes are based on the 2010 Standard Occupational Classification (SOC).Data are based on a sample and are subject to sampling variability. A margin of error is a measure of an estimate’s variability. The larger the margin of errorin relation to the size of the estimates, the less reliable the estimate. When added to and subtracted from the estimate, the margin of error forms the 90 percentconfidence interval.3Medical and all other life scientists were combined because of a small number of all other life scientists.Source: U.S. Census Bureau, 2011 American Community Survey.12U.S. Census Bureau5
Table 4.Employment in STEM-Related Occupations: 2011(Civilian employed aged 25 to 64)Occupation1NumberMOE2Percent ofSTEMrelatedworkforceNumberMOE2Percent 075 10,1073.70148,5096,9321.90417,450 11,6015.33586,722 14,3837.49Occupation1Total STEM-related . . . . . . . . . . . 7,829,769 49,792 100 .00Medical and health services managers . . 552,493Architects . . . . . . . . . . . . . . . . . . . . . . . . . 154,538Chiropractors . . . . . . . . . . . . . . . . . . . . . .51,545Dentists . . . . . . . . . . . . . . . . . . . . . . . . . . 150,227Dietitians and nutritionists . . . . . . . . . . . .73,771Optometrists . . . . . . . . . . . . . . . . . . . . . .32,083Pharmacists . . . . . . . . . . . . . . . . . . . . . . . 237,451Physicians and surgeons . . . . . . . . . . . . . 809,980Physician assistants . . . . . . . . . . . . . . . . 108,922Podiatrists . . . . . . . . . . . . . . . . . . . . . . . .7,161Audiologists . . . . . . . . . . . . . . . . . . . . . . .13,539Occupational therapists . . . . . . . . . . . . . .85,491Physical therapists . . . . . . . . . . . . . . . . . . 198,104Radiation therapists . . . . . . . . . . . . . . . . .11,051Recreational therapists . . . . . . . . . . . . . .11,004Respiratory therapists . . . . . . . . . . . . . . .98,958Speech-language pathologists . . . . . . . . 118,338Exercise physiologists . . . . . . . . . . . . . . .2,797Therapists, all other . . . . . . . . . . . . . . . . . 129,175Veterinarians . . . . . . . . . . . . . . . . . . . . . .63,858Registered nurses . . . . . . . . . . . . . . . . . . 2,558,418Nurse anesthetists . . . . . . . . . . . . . . . . . 32.680.34Nurse midwives . . . . . . . . . . . . . . . . . . .Nurse practitioners . . . . . . . . . . . . . . . .Health diagnosing and treatingpractitioners, all other . . . . . . . . . . . . .Clinical laboratory technologists andtechnicians. . . . . . . . . . . . . . . . . . . . . .Dental hygienists . . . . . . . . . . . . . . . . . .Diagnostic related technologists andtechnicians. . . . . . . . . . . . . . . . . . . . . .Emergency medical technicians andparamedics . . . . . . . . . . . . . . . . . . . . .Health practitioner supporttechnologists and technicians . . . . . . .Licensed practical and licensedvocational nurses . . . . . . . . . . . . . . . . .Medical records and health informationtechnicians. . . . . . . . . . . . . . . . . . . . . .Opticians, dispensing . . . . . . . . . . . . . .Miscellaneous health technologists andtechnicians. . . . . . . . . . . . . . . . . . . . . .Other healthcare practitioners andtechnical occupations . . . . . . . . . . . . 3515,1761.06Occupation codes are based on the 2010 Standard Occupational Classification (SOC).Data are based on a sample and are subject to sampling variability. A margin of error is a measure of an estimate’s variability. The larger the margin of errorin relation to the size of the estimates, the less reliable the estimate. When added to and subtracted from the estimate, the margin of error forms the 90 percentconfidence interval.Source: U.S. Census Bureau, 2011 American Community Survey.12Software developers was thelargest detailed STEM occupation,employing 12 percent of all STEMworkers (Table 3). An additional7.8 million workers were employedin STEM-related occupations, mostof which were in health care. Thelargest detailed STEM-related occupation was registered
Rising Above the Gathering Storm. also calls for increased funding for K–12, college, and graduate education in STEM fields and for research and development. 3. 1. Committee on Science, Engineering, and Public Policy, 2010, “Rising Above the