Transcription
Maximilian Bäuerle, Jobst Görne, Hochschule Aalen:Comparison and Usage of the Boston Consultingportfolio and the McKinsey-portfolioPreamblePortfolio analysisThe BCG-matrixDescription of the BCG-matrixCriticism of the BCG-matrixThe McKinsey-matrixDescription of the McKinsey-matrixCriticism of the McKinsey-matrixComparison of both portfolio analysesConclusion1
1. PreambleThe strategic management is gaining a lot of importance nowadays. A lot ofcompanies are facing the issue that they have several products and even severalstrategic business units. To achieve competitive advantages in the market, the topmanagement has to decide how to split up resources between these unitsregarding several factors to get a well-balanced and a future-proof portfolio.Furthermore potentials for failure as well as for success have to be identified tostay competitive. An important tool for the strategic management is the portfolioanalyses which has the goal to improve the planning. Based upon the outcome ofthis tool decisions should be made on future activities. There are two well-knownportfolio analyses established that will be presented in this paper, the BostonConsulting-matrix and the McKinsey-matrix. They will also get compared to seewhen to use the one and when to use the other and to analyze their advantagesand disadvantages.2
2. Portfolio analysisThe most portfolio analyses have in common that they display the businessenvironment and the potential of a company on a two-dimensionalrepresentation. They differ in the overall target of the whole portfolio analysis andin the manner, the internal and the strength of the environment is measured. Ingeneral, it is possible to divide all portfolio analyses into two groups. The marketoriented portfolios and the resource-orientated ones. The resource-orientatedportfolios try to give recommendations about the usage and change of resourcesbased on their conditions and the market. The two most known resourceorientated portfolios are the technology portfolio and thee business arearesources portfolio.The BCG-matrix and the McKinsey-matrix are both market oriented portfolios. Themain goal of the market-oriented portfolios is answering the question whichproducts or strategic business units need more financial attention and which unitscould offer this attention. Consequently this leads to considerations on thecreations of a financially balanced equilibrium. (Bea und Haas 2016, S.150)3. The BCG-matrixThe BCG-matrix was developed by the Boston Consulting Group in the late 1960'sand the early 1970's. The well-known company had to deal with the Mead PaperCorporation, which had 45 operating divisions and 6 product lines by this time.They hired the Boston Consulting Group to manage the different business unitsand to define which product groups or business units were losing money. By doingthat, they wanted to be able to create an overall company strategy andfurthermore the top management wanted to know how to allocate or reallocateresources between the different business units. Since this time, this portfolio3
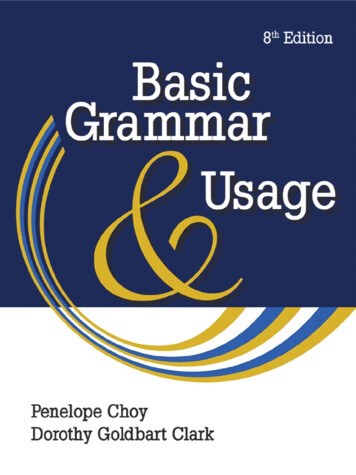
analysis is probably the most important tools for strategy setting and is used by alot of companies and taught by a lot of professors and books. (Paul und Wollny2011, S. 208)Image 1: The Boston Consulting-matrix3.1 Description of the BCG-matric4
To meet all requirements of their customers, the consultants built up a frameworkwhich consisted of four categories. They tried to put every product line and everystrategic business unit into one of these categories and deduce recommendationsfor the future strategic direction of each entity. In practice they consulted, if inparticular, units should be invested or disinvested, should be acquired or sold orliquidated.The ordinate of the four-cell matrix describes the environmental dimension byconsidering the market growth. The abscissa demonstrates the relative marketshare. (Kessler 2013)It is important to mention, that the portfolio approach is based upon the productlifecycle and the experience curve in its whole consideration. The usage of thedimension of the market growth is highly linked to the product lifecycle. Based onthe product lifecycle, it can be assumed that markets undergo four phases whichlead to suggestions about the market growth and the market attractivity.The concept of the experience curve claims that with every duplication of theaccumulated output quantity the real unit costs could potentially decrease by 2030 percent. This means that the company with the highest market share is able toprovide the lowest unit costs. (Paul und Wollny 2011, S. 209)The relative market share is measured by the ratio between the own absolutemarket share and the absolute market share of the biggest competitor. This meansthe factor is a doubled relative value, which is smaller than one when competitivesituation is strong and the company is the market leader. And higher than onewhen the competitive situation is low and the company is the market leader.5
Furthermore, if the value is exactly one, the market share is exactly the same likethe one of the most important competitor. Sometimes the area between one andone and a half is highlighted. This is based on experiences by the Boston ConsultingGroup which says that the cost advantages first starts to become increasinglyimportant when the market share of a company is 50 percent higher than the oneof the biggest competitor.The market growth rate is the result of the development potential of the market inthe coming years measured in percent. "It is generally considered that a growingmarket experiences an increase of around five percent of its sales by volume." Thismeans that the market growth is usually quantified by the increasing respectivelydecreasing turnover measured in a predetermined period, usually one year, in aspecific market. (Pepels 2015, S. 84–85)So, the abscissa and the ordinate define a field which is divided into two sectionswhich leads to four categories as it can be seen in Image 1. Each strategic businessunit or each product gets now evaluated and entered in the matrix, presented by acircle. The size of the circle corresponds to the proportion of the relative turnovercreated by this product or business unit related to the overall turnover of thecompany.The peculiarity of the matrix is that wherever the to be evaluated product getspositioned, the company is able to derive a standard strategy or an advise how tohandle this product in the future.To exemplify the situation which the products or business units find themselves in,the Boston Consulting Group gave the four categories descriptive names:The Poor Dogs describe the quadrant of a low market share as well as a lowmarket growth. Those are usually problem or discontinued products, that find6
themselves in the degeneration respectively saturation phase. The issue is thatthey may block resources that could be used in other areas much more efficiently.There are two given possibilities to handle these markets. To minimize the risk ofthis area and to relocate the resources, it is suggested to disinvest or to stop theproduct completely. The other opportunity is to relaunch a variation of theproduct by concentric, horizontal or lateral diversification. But therefore, it has tobe proven that there is a realistic chance to survive for this relaunched product.Summed up, the development costs, the investments in capacities and themarketing and sales costs are low or zero. The main advised strategy is to stepwisepull selectively out of the productline if it is not able to provide an appreciablecontribution margin or the resources could be used better elsewhere.The Question Marks are characterized by high market growth and a low relativemarket share. Those are new businesses or successor products that are still in avery early stage of the product life cycle. Their name Question Marks concludesthat it is uncertain whether they're able to survive and develop in the market andif it is wise to invest or not. This leads to a selective strategy where it is suggestedto analyze in detail in to which of them further financial resources for developing,sales and marketing and capacities should flow, as they are promising success orwhich of them should be rejected. This is also important as it is usually not possiblefor companies to finance all upcoming projects.If it is decided to develop the business there are high initial costs combined withstill pretty low market shares which leads to a negative cash flow in the beginning.To be able to increase the market share, it has to be driven an offensive and riskystrategy. This means a high investment in improving the value propositions,7
specialization of the product, implementation of the technical innovations and anexpansion in the sales policy.As the risks and the consumption of resources are high, a company is able to onlyhave a limited number of these businesses in their portfolio. On the other hand, itis crucial to invest in these markets to stay long-term competitive.All in all it has to be decided in each particular case whether it is worth it to pushbusiness further or to disinvest and to relocate resources. (Reisinger et al. 2013, S.95f.)The Stars have both, a strong relative market share and a high growth rate. Thismeans on the one hand that they're generating a lot of money but on the otherhand that they need high investments to cope with the high market growth rateand to support the market dominance. Typically, these products would findthemselves in the period of growth in the product life cycle. In this area thestrategic management is advised to invest in developing, marketing and sales tomaintain its large market share and to become a cash cow when market growthrate goes down. The risks in this category should be accepted. Therefore, moreeffort should be put in the product or the strategic business unit by diversifying,widening the customer range, opening new markets and improving and supportingthe sales situation. This means it has to planned with continuously reinvestments.Once the market comes to its saturation phase the endurance and the investmentsto keep the high market share pay off and the product is ready to become a cashcow. Every diversified business portfolio should have some star products in theirbackhand to ensure future cash flows and monetary resources that can bereinvested.8
The Cash Cows are identified by a high relative market share but a low marketgrowth. In this area the return on assets is greater than the market growth rateand thus achieve a higher outcome of money than they consume as it is absolutelyunattractive for competitors to enter the market due to the high market shares.Moreover, the high market share leads, based on the theory of the experiencecurve to a greater potential in cost and efficiency optimization. It is generallyadvised to either not reinvest at all in these areas and to "milk" or "harvest" theseproducts or to invest just very slightly to defend the market share as long aspossible. Another opportunity is to reanimate the business by product variation toturn it again into a Question Mark or a Star. But this is the exceptional case and hasto be weighed up very carefully.Usually the Cash Cows are used as capital providers to turn Question Marks intoStars, to cover administrative costs of the company and fund the research anddevelopment departments and the less lucrative units. As they are this importantfor the whole survival of the company, it is well-considered to have the half of theoverall business portfolio as Cash Cows. (Paul und Wollny 2011)3.2 Criticism of the BCG-matrixAs this strategic tool is very popular and in addition quite old as well, it has to faceof course some points of criticism. To start with, the matrix only differentiatesbetween "high" and "low", the user could be lead to an untrue black-and-whitemindset. Furthermore, critics claim, that the scaling was set randomly and the9
companies should scale their BCG matrix especially for themselves, which is onceagain very difficult and problematic.Another point is that the labeling of the boxes are judgmental. This brings in anemotional component and people employed in a "poor dog" SBU could bediscredited. (Drews 2008, S. 43)As the portfolio analysis tries to combine the environmental analysis and theinternal situation, it is a highly important tool for the strategic planning. A bigdisadvantage is that the BCG-matrix only uses one characteristic for theenvironmental situation and one characteristic for the situation in the owncompany. (Bea und Haas 2016)The chart uses the relative market shares as an indicator for competitive strength.This is mainly founded in the PIMS study, which shows a direct dependence of therelative market shares and the return on investment. As the origin of the study liesin the early 1960's, there were a lot of other studies in the meantime which wereable to refute or at least challenge this old concept. Furthermore, it is obvious,that if the evaluation of the competitive strength only happens through therelative market shares, like it does in the BCG-matrix, companies that drive a costleadership strategy, get rated much better and companies that drive for example adifferentiation or a niche strategy get rated worse. Another important negative10
point in concentrating only in relative market shares is the problem in determiningin the exact market and your own shares in it. The same issue faces the marketgrowth on the x-axis of course as well. (Drews 2008, S. 43)Probably the most important critic of the whole concept is the point that themarket attractivity can't be really measured only by the market growth as thereexist markets that don't grow and are attractive for companies.Another big problem for both axis of the framework is the definition of the marketand its demarcation, as the borders are blurry and fluent and often hard to define.(Paul und Wollny 2011, S. 213)11
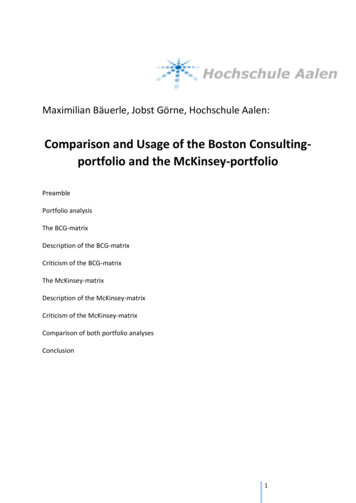
The McKinsey-matrixAs the BCG-matrix had to meet a lot of criticism for the just given reasons, therewas developed another strategic planning tool: the McKinsey-matrix. In the latesixties and early seventies General Electric, a multinational conglomerateoperating in a lot of segments like aviation, healthcare, power, renewable energy,manufacturing, finance, transporting and so on was seeking for a tool todifferentiate the potential for future profit in their many business units. Thecompany was disappointed in the return on investments they had in their variousbusinesses which suggested faults in GE’s approach to investment decisionmaking. The strategic top management of General Electric came to the conclusionthat the BCG-matrix with only one indicator for the external situation and oneindicator for the internal situation isn't eligible for their portfolio approach.That's why they went to McKinsey and Company, another well-known americanconsultancy, to get advised within their portfolio and investment strategy. Thecompany designed an approach for GE that differs in two ways from the BCGmatrix. As it can be seen in Image 2, it has nine instead of four blocks and the axisdescribe the internal and external situation completely differently, using marketattractiveness and competitive strength. The matrix is also known as GE-matrix ornine-box matrix.12
Image 2: The McKinsey-matrix4.1 Description of the McKinsey-matrixTo meet all requirements, the consultants developed a screen and tried to includesome more sub-indicators in the two main indicators. Therefore, the compoundedvalues are based on a scoring model to insure a better coverage of bothdimensions and also to be able to include qualitative aspects in the portfolio.Based on the positioning in the portfolio the user is able to apply standard13
strategies and recommendations to ensure a well-balanced and a future-proofbusiness portfolio.The ordinate of the nine-cell matrix describes the environmental dimension byconsidering the market attractiveness which includes different criteria. Theabscissa is handling the internal company dimension by regarding the competitivestrength which as well includes different factors and criteria. The two axis create anine-cell matrix as they are subdivided by high, middle and low. (Grünig und Kühn2018)After it is defined which factors should be included, the determination is made byscoring points. Each criterion is evaluated individually and included in the overallrating. From this, the average is formed, which defines the position within thescale of abscissa and ordinate.Just like in the BCG-matrix, the size of the circles of the to be evaluated product orbusiness unit corresponds to the turnover related to the overall turnover of thecompany. Furthermore, depending on the position of individual units, it should aswell offer guidelines for strategic behavior. The overall goal of theserecommendations is the maximizing of the return on investment. (Bea und Haas2016)This portfolio analysis is able to respond each company's needs as it is able toinclude different sub-factors in its axis which generates one main factor. To definehow for example the market attractivity has to be defined, it has to be chosenwhich factors should be included. These factors can be weighted and rateddifferently in the framework of a scoring model. (Pepels 2015, S. 96) The rating isinfluenced by quantitative data (for example the turnover in figures), thedescription of quantitative data (for example market leader based on turnover)and by qualitative aspects (for example the degree of the competition). (Paul undWollny 2011, S. 220)14
To determine the market attractiveness and the relative competitive strength it isimportant to understand that there is no predefined list of factors that has to beincluded. In each case it has to be differentiated and considered which factors arecrucial.To give an overview of the given possibilities to describe the market attractivenessthe literature suggests a catalog of four main factors that could be involved. Thefirst one is the market size respectively market growth by analyzing for examplethe market volume, the historical market growth, the development of the market,the stage in the market life cycle, the impact of productivity increase and theexpansion of the market space.The next main criteria the market quality is evaluated by the return on sales, thetechnical know-how which is given in the company and the ability to protect it, theintensity of the competition and the number of competitors, the strengths of themarket entry barriers, the level of needed investments, the potential ofinnovations, seasonal fluctuation, requirements of distribution and serviceperformance and the financial scope of price setting.The third main factor considers the needed resources and the energy supply.Those are affected by the power and the reliability of the suppliers, the givenalternatives of suppliers and the price stability of the supplied goods.Last but not least the environmental situation is influenced by the dependency oneconomic trends, the market acceptance and restrictions due to political laws andeconomies. (Pepels 2015)On the other side the competitive strength is as well determined by four mainfactors, where a big focus is in the area of the value chain. As it will turn out thatthe quantification of the selected aspects of the competitive strength is very hardto do, it is easier to fall back on qualitative elements. Of course, it also depends onthe availability of the needed figures in the market. For rating the following15
factors, it turned out that the sales manager are often able to give qualified andgood assessments.The first variable is the own market position which can be characterized by therelative market share, the financial strength, advantages in pricing or qualities, theprofitability measured in gross profit or EBIT-returns and the growth rate of thecompany compared to competitors.The second ingredient is the production potential, expressed through productivity,locational advantages, economies of scale and scope, capacity, intellectualproperty, technical know-how and flexibility and licenses.Furthermore, the potential of the research and development should beconsidered. This is done by looking at the personal and financial resources andpossibilities and the overall degree of innovation that can be split up in differentfactors.Finally, the qualification and ability of the top management should also beincluded. This can be done by evaluating the professionalism, the workingatmosphere and the company's organization. (Paul und Wollny 2011, S. 225)As with the Boston Consulting Group approach, they should not be applied asplanned strategies without further reflection but should be critically reviewed asguidelines. (Grünig und Kühn 2018, S. 128)As the ordinate and the abscissa are divided into high, middle and low, there arenine areas arising which can be summarized in three zones that determine thethree main norm strategies. These zones are usually colored green, yellow and red.Besides that, it is also possible to derive more differentiated and specializedstrategies from the single boxes.The three cells at the top right-hand side of the matrix are the most attractive inwhich to operate. It is the zone of investment and growth and they contribute tothe future profits. The main objective in this area is the assurance and thedevelopment of potentials for success, as the high market attractiveness and the16
relative competitive strength can suggest. Sub-goals are the increase of theawareness level, the acquisition of companies that are related to the own businessand a high price level. Measures are for example the acceptance of risks, theoptimization of marketing, the increase of the market share and product variety,the empowering of the market barriers and the opening of new markets.Therefore, it has to be invested a lot of resources and the consumption of financialresources is typically greater than the profit. Nevertheless the risks should betaken as these strategic business units or products are the future profit savers.(Reisinger et al. 2013, S. 96)The three boxes at the bottom left-hand side have the least market attractivenessand the least competitive strength, therefore the top management is advised tofollow a policy of harvesting and divestment unless the relative strength can beimproved. The zone is often colored red. Depending position in theportfolio and the expected chances of success it is either recommended tocompletely disinvest and to even sell or reduce commercial units if the marketattractiveness as well as the competitive strength is low. The other two cells arecharacterized by specialization, the exploration of niche markets and analternative consolidation or the harvesting of gainings, the minimization ofinvestments and the planning of a strategic retreat of the product or the strategicbusiness unit. Summing up, the products in this zone are marked by the releaseand the allocation of funds and resources. (Pepels 2015, S. 97)The three cells running diagonally from bottom right to the top left cornerrepresent the yellow zone. They either have a low market attractiveness combinedwith a high competitive strength, a medium attractiveness combined with amedium strength or a high attractiveness combined with a low competitivestrength. Depending on the position and the portfolio's balance, it is advised todefense, to consolidate or to expand. The management of businesses within thiscategory should be more cautious and with a greater emphasis being placed onselective investment and earning retention.17
That's why it is called the zone of selective strategies. The main goals in this areaare the promotion of customer loyalty, the customer acquisition and the rely onconservative financing options. Actions in this area could comprise a growthstrategy, a high market attractiveness and a low competition, which is reached byspecialization, the provision of a niche policy and the assessment of possibleacquisitions. A middle attractiveness as well as a middle competition result in avery selective strategy which is conducted by identifying possible expansion fields,specialization and selective investments. A low market attractiveness and a highcompetitiveness lead to a keep-and-safe strategy, where it is advised to maximizethe return of the cash-flow and to investonly to maintain the product or the strategic business unit. (Paul und Wollny 2011,S. 219)4.2 Criticism of the McKinsey-matrixNow the McKinsey-matrix, like the BCG-matrix and all generic strategy models hasits own set of limitations and points of criticism. The literature often denouncesthat the GE-matrix assumes that there is a causal connection between the includedfactors and the chances of success of a strategic business unit or a product. Thisconnection is often different and can only be suggested. This leads to adegradation of the importance of the derived norm strategies and therefore forthe whole tool.Another point is that the portfolio only looks at the current situation and ignoresmostly how positions might change through changes in the industry and theeconomy.Furthermore, a big problem is that the qualitative circumstances have to beevaluated in a subjective process. But decisions are often characterized throughcomplex structures, unknown interdependencies and unawarenesss of facts. In18
addition, the selection of the included factors and their weighting is facing thesame issue. The accumulation of these subjective assessments leads to the pointthat a previous average of this analysis, the involvement of multiple factors canlead to a big disadvantage. (Macharzina und Wolf 2010, S. 367–368)Moreover, it is obviously that availability and the topicality of the needed data ispresenting a complication. This is also related to the difficulty and the costs thatthis portfolio analysis requires.Finally, the McKinsey-matrix is facing of course the same problems as all portfolioanalysis does which are already described in section 3.2. This includes for examplethat the result of this tool is sensitive to the definition of business markets. (Paulund Wollny 2011, S. 230)5. Comparison of both portfolio analysesThe GE-matrix and the Boston Consulting Matrix are in a lot of points similar.Nevertheless, both analyses have their right to exist as both of them have differentadvantages and operating fields.To begin with, the biggest difference and the biggest criteria, which should be usedis based on the product the business unit is producing. It should be strictlydifferentiated between typical consumer goods which traditionally have a productlifecycle and products that don’t have a product lifecycle, which are typically found19
in technical markets. Due to the strong connection between the market growthaxis of the BCG-matrix and the product lifecycle, this portfolio analysis should beused for products or business units in consumer and anonymous markets thatexperience a product lifecycle. On the other hand the McKinsey matrix is useful fortechnical and known markets That is the reason why in technical sales for examplethe McKinsey-matrix is used as it can’t be expected that the to-be-analyzedproduct has a product lifecycle.Then it should be clarified the difference of the usage of both models. Whereasthe BCG-matrix is mainly used by companies that want to know how to relocateand how to deploy their resources among their various business units andproducts, the GE-matrix is mainly applied to find out how to prioritize investmentsamong strategic business units.So first of all, it should be determined, what exactly the intention of the analysisshould be. Then there are different advantages and disadvantages that should betaken into account. To begin with, the determination of positions in the BCGmodel is a lot easier as it uses clear and quantitative criteria. This is on the onehand a big plus as it simplifies the whole process. On the other hand, likepreviously described in section 3.2, the market attractiveness is way too complexto describe it only through the relative market growth. On the other side theinvolvement of different factors for the measuring of the market attractivenessand the competitive strength creates a much more realistic presentation of theexternal and internal business situation. The interrelation between quantitativeand qualitative data, personal experiences and assumptions of the management20
and consensus decisions is probably always closer to the reality than onlyconsidering one factor like the BCG consultants do.Moreover, the classification in to three categories per axis within the McKinseymodel leads to more differentiated norm strategies compared to the 4 boxes ofthe BCG-portfolio.The BCG-matrix uses the clear correlation between its two dimensions and theoutput and use of funds. Therefore, it is much more appropriate to check howbalanced the business portfolio of a company is.Finally, it can't be said whether the one or the other analysis is better in general.Both of them have advantages and disadvantages and depending on the neededcomplexity, usage and other factors, it should be decided which tool will be used.(Pepels 2015, S. 99)21
6. ConclusionBoth models represent an important tool for the strategic orientation of acompany. They enable managers to assess whether the business portfolio is wellbalanced to ensure a long-term profit and survival and growth of the company.The models shouldn't be seen as tools that require strict observance regarding thenorm strategies nor they answer all strategic questions when it comes to adiversified business and organization as it was announced when they weredeveloped in the 1960's and the 1970's.Instead, the two models should help the management to check the overallsituation of the portfolio and to give cautious estimations a
The BCG-matrix was developed by the Boston Consulting Group in the late 1960's and the early 1970's. The well-known company had to deal with the Mead Paper Corporation, which had 45 operating divisions and 6 product lines by this time. They hired the Boston Consult