Transcription
WORKINGPAPERSANEMPIRICAL ANALYSIS OFTHEBOSTON CONSULTING GROUP'S PORTFOLIO MODELMalcolm B. CoateWORKING PAPER NO. 71August 1982FfC Bureau of Ecooomics working papers are preliminary materials circulated to stimulate discussion and critical comment All data contained in them are in thepublic domain. This includes information obtained by the Commissioo which has become part of public record. The analyses and conclusions set forth are thoseof the authors and do not necessarily reflect the views of other members of the Bureau of Economics, other Commission staff, or the Commission itself. Uponrequest, single copies or the paper will be provided. References in publications to FfC Bureau of Economics working papers by FfC economists (other thanacknowledgement by a writer that he has access to such unpublished materials) should be cleared with the author to protect the tentative character of these papers.BUREAU OF ECONOMICSFEDERAL TRADE COMMISSIONWASHINGTON, DC 20580
AN EMPIRI CAL ANALYSIS O F T HEB OS T ON C ONSUL TING GR OUP'S P OR T F OLI O M ODELMalcolm B. CoateJune 30, 198 2The analyses and conclusions set forth in this paper are those ofthe author and do not necessarily reflect the views of othermembers of the Bureau of Economics, other Co m mission staff, or theCom mission.
IN TRODU C TI ONBusiness portfolio planning models have received wide-spreadHaspeslagh estimated that 36acceptance in the last decade.percent of companies in the Fortune "10 0 0" used some form of port folio planning in 1979[14].The simplest, most quantitative, andb est known portfolio model has been defined by the BostonConsulting Group(B CG} .This model is based on a set of funda m ental concepts concerning the fir m and its business units.T heoretical criticisms of the B CG model have appeared in numerousother papers[ 7, 10, 16], but the underlying empirical support forthe B CG model has not been explored.The goal of this paper is totry to remedy this oversight by constructing and imple menting atest of the basic B CG concepts.The results of this test shoulddetermine if any of the B CG concepts deserve consideration inportfolio planning.This paper starts with a brief discussion of the B CG approachto planning.In particular, we present the fundamental conceptsof the B CG methodology and describe the resulting portfoliomatrix.Then we relate a statistical hypothesis to each of threefundamental concepts and define a profitability model to test thehypotheses.Next we sum marize the data necessary to esti mate theeconometric model and present the results of the analysis.Weconclude by evaluating the emp irical results and their implica tions for the portfolio planning.
T HE BOS T ON C ONSUL TING GR OUP'S P OR T F OLI O M ODELThe B CG literature states, "the real measure of management'ssuccess is the increase in the present value of future cashpayoff"[4] .This implies that the firm should follow adiscounted-cash-flow maximization rule.Thus, the goal of the B CGm odel is to maximize the long-run profitability (present value) ofthe fir m's business units.The investment strategies of eachunit are the basic control variables used to optimize the returnon the portfolio of business units.These strategies are based ont he position of the various units in the portfolio matrix.There are four fundamental concepts that form the foundationof the B CG matrix approach to planning.l They are:(1) theseparability of the firm into independent business units,limitation on corporate resources,experience curve, andrate[ 7).(2) the(3) the existence of the(4) the importance of the industry growthThese ideas are used to structure a planning matrix anddefine optimal strategies.The business-unit concept implies that the firmCildefinestrategies for each unit without having to consider their effecton the other business units.This allows the fir m to subdivideitself into a meaningful portfolio of businesses.The actualdefinition of each unit should attempt to capture all the possiblesynergies while still maintaining a significant subdivision of thefirm into component parts.1 The B CG also assumes that price will decline with costs in thelong run and seems to ignore the risk of a strategy [71 - 2
The li mitation on corporate resources requires the firm tom ake all its strategic decisions simultaneously, because invest m ent in one unit reduces the funds available to the other units ofthe firm.The B CG expects the firm to try to build a balancedp ortfolio of business units and use cash from its mature busi nesses to fund the investment in its growth business.Thisc oncept implies that the fir m must pass over some attractiveinvestment projects because the necessary investment resources aren ot available.The experience curve implies a negative relationship existsbetween costs and cumulative output.This sug gests that relativem arket share will have a positive effect on profitability,b ecause the business with the largest equilibrium share(and thusthe most cumulative output} must have the largest margin. 2Thelarge margin will allow the high-share units to generate cash thatcan be reinvested in the business or transferred to other units.This relationship between share and profitability is the mosti mportant concept in the portfolio model because it serves toidentify the most profitable type of business unit.The B CG portfolio model also defines a relationship betweent he industry growth rate and the investment in each unit.The B CGobserves the firm must invest heavily in high-growth industries to2 Other explanations can be offered for the relative-market share/profitability relationship, so the portfolio model can bevalid even if the experience curve does not exist [16] -3ü-
finance the increase in output that is needed to maintain marketshare.3Also, additional investment is required to gain share ina high-growth indu stry[2].But little investment is necessary inlow -growth industries, because the market is mature.Thus, onlyhigh-growth units will require substantial cash for investment.If the unit cannot generate enough funds internally, the firm willhave to inject cash into the unit to maintain share.Eventuallythe unit's product will mature and the industry growth rate willdecline[4].This will lower the unit's de mand for investmentfunds and allow the unit to generate a substantial cash flow forthe firm, if a dominant position has been attained.The B CG modelreco m mends development of this type of high-share/ low-growthbusiness.The final two concepts sug gest that the investment strategyfollowed by each unit should depend on its relative market shareand industry growth rate.Thus, the B CG has defined a matrix toclassify business units by these characteristics.As we haveseen, the relative market share of a unit is a proxy for cashgeneration and the industry growth rate esti mates cash use.Ashare of between one and one-and-a-half times the share of aunit's largest comp etitor and a growth rate of around 10 percent3The investment can be in the form of new plant and equip ment,working capital, advertising, research-and-development exp ense,or even foregone earnings due to selling at discount prices.Since market share leads to higher future returns (due to theexperience curve) , all the· indirect costs of maintaining orgaining share are capital expenses.-4
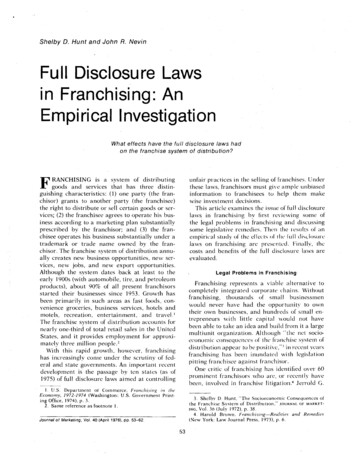
are used to divide the business units into different cells.TheB CG model sug gests that the fir m allocate the cash generated byeach business, to maximize the long-run profitability of itsp ortfolio subj ect to the required balance in cash generated andused.The desired movement in the portfolio matrix is illustratedin figure 1, with the B CG's title for each type of unit in theappropriate box.Hedley notes "the first goal should be tom aintain position in the 'c ash cows' but to guard against thefrequent temptation to reinvest in them excessively"[1 5, p. 11].Next, the firm should invest to preserve the market share of the" stars."Any surplus funds are invested in the best "questionmarks" to acquire additional market share.The firm invests in"stars" and selected "question marks" in the hope that they willbeco me "cash cows" when their market growth rate decreases.The" do g " and the re mainder of the "question mark" businesses aremanaged to generate·cash or are divested fro m the portfolio,because the B CG model sug gests further investment will never yielda future cash return[3].Thus, the B CG model advises the fir m touse the excess funds fro m the "cash cow " units to finance invest ment in high-growth units, with the goal of creating new "cashcows" when the industry growth rate slows.This "ability of thediversified company to redirect its cash flow internally isextremely imp ortant"[4].rt· allows the corporation to continueto grow and earn profits as its individual business units movethrough the stages of the product- 5 1ife cycle.
Figure l'Ihe BCG Portfolio MatrixHIGHSTARMarketGrowthQUESTICN MARKL'.lO%vCASH CC!flHIG!rxx;1. 5Relative Daninance.7
A TES T O F THE F OUND A T I ONS O F THE B CG P OR T F OL I O M ODELThe portfolio planning model relies on the four fundamentalc oncepts isolated in the previous section.These concepts arerarely supported with empirical evidence, probably due to thenor mative nature of the B CG model.But three of the four conceptshave direct implications for the profitability of a fir m. 4Wehave already noted that the experience curve generates a relation s hip between relative market share and profitability.Also, theb usiness-unit concept requires the profitability of a fir m to beindependent of the interrelationships bewteen the various businessunits of the firm.Finally, the limitation on investmentresources implies that a balanced portfolio can increase theprofitability of the firm.In the following three subsections, wewill describe the three hypotheses in more detail, discuss therelevant evidence from existing studies, and define a variablet hat can be incorporated in a profitability model.Then we willpresent the overall model and discuss a set of control variables.This statistical analysis of fir m profitability should be able todetermine if the B CG concepts have any empirical support.The Business UnitThe business-unit hypothesis implies that synergy between thebusiness units does not exist.Thus the profitability of each4 The fourth concept (r elating growth and investment) is reallylittle more than a tautology, so a test is unnecessary.- 7
unit is independent of the rest of fir m.This hypothesis contra d icts the relatedness theory of diversification, a theory thatadvises a firm to diversify into areas similar to its main lineso f business.Rumelt found that firms with related diversificationstrategies were significantly more profitable than the averagef ir m[19].This suggests that the firm can take advantage of so meoperational synergies between individual business units.Carterused the Herfindahl numbers-equivalent index for firms with acentralized organizational structure as a proxy for relatedness[ 6].He found that these firms are slightly more profitable thananalogous fir ms with a multidivisional (n oncentralized) structure,b ut the difference was not significant.Thus, the existing weakevidence suggests that the independent-business-unit hypothesiss hould be rejected.But it may be possible to construct anothertest of the hypothesis.A quantitative measure of the operational synergy betweenbusiness units requires so me definition of relatedness.Standard Indust ial ClassificationThe(S I C ) code can be used to de fine business units in the same two-digit S I C industry as related.Sc herer[20, p. 60] notes that the S I C-code system emp hasizessimilarities in the production process, so most of the potentialfor manufacturing synergy should be captured.But the measurewill not necessarily incorporate marketing relationships.Theactual variable must also give so me consideration to the share ofa fir m's sales in a S I C group, to proxy the potential size of the-8
synergy.The approach, used to measure synergy in a group,c o mp utes the product of the num ber of possible synergisticbusiness units in a group and the square of the percentage shareof a firm's sales in an industry classification.This variablegives more weight to industry groups where the relatedopp ortunities or the level of the firm's sales offers a chance forsignificant synergies.20REL Ei l(n i - 1 )(S i ) 2whereni the nu mber of the fir m's business units in the i'th two-digitS I C indu strysi the total sales of the fir m's business units in the i'thindustry group, divided by total fir m sales.This variable is equal to zero if the fir m does not operatemore than one business in each S I C industry and is large for adiversified fir m that operates a number of business units in asingle S I C industry group.The B CG hypothesis of minimal opera tional synergy between units cannot be rejected if the variablehas an insignificant coefficient in the profitability model.The Limitation on Investment FundsThe limitation on investment funds implies that internalfinancing is valuable to the firm, since it allows the fir m togenerate additional funds not available in the capital market.Thus, internal financing may make it easier for a fir m to under take some new profitable projects that require large capital-9-
investments.The portfolio model sug gests that a balanced groupof cash-generating and cash-using units will allow the fir m tofinance profitable projects with internal funds.The overallbalance in the corporate portfolio is difficult to measure butshould be proxied by a diversification index.Thus, a positiverelationship should exist between diversification and profit ability.The diversification index may also pick up other capitalmarket imperfections that allow a diversified fir m to acquirecap ital at lower costs[20, p. 10 7].A few studies haveincorporated diversification variables in fir m profitabilitymodels, with mixed results.Two studies of food-processing firmsf ailed to find any general synergistic effects[17, 24].ButC arter has reported a significant positive relationship betweenthe num bers-equivalent Herfindahl index and profitability[6].This suggests that diversification may increase the profitabilityof a fir m.Additional evidence may confir m this hypothesis.A measure of diversification must incorporate some considera tion of both the number of business units in the fir m and theirsize.A standard measure of diversification is given belowDIV[1].m 1 -E (S·) 2JJ. 1whereSj the share of the firm's sales in the j'th four-digit S I Cindustry.-10
The diversification variable can range from zerosingle market) to approximately one(for a fir m in a(for a well-diversified fir m ) .The financial-synergy hypothesis implies the diversificationvariable should have a positive sign in the profitability model.The Experience CurveThe experience curve implies that the profitability of abusiness is proportional to its relative share of the market.This relative-market-share/profitability hypothesis has someinitial support from a few B CG fir m and industry case studies[ 9].Also, an aggregated for m of the relationship has substantialecono metric support.Relative market share had a significantpositive effect on profitability in a Federal Tr ade Co m mission(F T C ) study[ 17] .s[24] and in a later study by !mel and HelmbergerBoth papers controlled for industry concentration butonly had data for fir ms in agricultural processing industries.Anum ber of other studies have found that absolute market share is asignificant deter minant of profitability at either the fir m22] or business-unit level[18].[11,This relationship could becaused by the omission of relative market share fro m the model.Finally, various P IMS studies found that relative and absolutemarket share were related to profitability[12, 21].The existing studies support offer some support for the B CGelationship between relative market share and profitability.5 Relative share was defined by dividing market share by theconcentration ratio.-11 But
the industrial-organization literature either uses a narrow set ofindustries[17, 24] or absolute instead of relative market share[11 , 18 , 22] .Also,business-unit data.most of the studies use fir m data instead ofThe PIMS stud y uses a sample of 1, 000b usiness units but suffers fro m a number of econometric diffi c ulties[20 , 21] .Thus, another study would be useful to add tothe piecemeal support of the relative -mark et-share/profitabilityh ypotpesis.The relative market share of a business is defined as theratio of the unit's share to the industry concentration level. 6Then the overall fir m share measure is the weigh ted average ofeach unit's share.It can be calcul ated asRMS r Sj RMSjjwhereS j the share of the fir m' s sales in the j'th four-digit SI Cindustry the relative market share of the fir m in its j'thRMS·Jbusiness.This variable will be relatively large for fir ms that tend todo minate their industries and small for firms that hold a marginalp osition in each mark et.The share variable should have a6 ' The B CG measure of relative share (the share of the firmdivided by the share of its largest co mp etitor) is not used,because it would not approxi mate the relative cost position of theleading firm in a regression model.-12
significant positive effect on profitability if the relative m arket-share/profitability relationship is valid.The Specification of the ModelThe three hypotheses can all be tested with a singlep ro fitability equation.We will try to explain the performance ofa diversified firm as a function of relatedness, diversification,relative market share, and a set of control variables.Thefollowing equation will be estimated to test the hypotheses:( 2)R a1 a2 REL a3 DIV a 4 RMS as F ( A) a6 AD/S a7 RD/S ag C4 ag G a10 K/Sw hereR a measure of the profitability of the fir mREL the relatedness index of the firmDIV the diversification index of the firmRMS the average relative market share of the firmF ( A) a measure of the fir m's sizeAD/S the advertising-to-sales ratioRD/S the research-and-development-to-sales ratioC4 the average four-fir m concentration ratio of thefirm's industriesGK/S the average growth rate of the fir m's industries the capital-to-sales ratio.The control variables are incorporated in the model toaccount for differences in the market position of the business-13
units of each fir m.Fir m size is included to investigate theresidual effect of absolute size on profitability.It ismeasured by the inverse of the logarithm of assets (net ofinvestments in unconsolidated subsidiaries)[13] Shep herd[22]n otes that the effect of size on profitability is indeterminatebecause large size may be associated with higher costs, inaddition to higher revenues.The advertising-to-sales ratio andt he research-and-development-to-sales ratio are included to testthe effect of these variables on profitability.Sc herer[20, p.38 8] observes that an oligopolistic market structure may lead toeither investment in product-differentiation advertising andincreased profits or overinvestment in advertising and reducedprofits.variable.An analogous argument could be made for the researchThus, the sign of these variables is theoreticallyindeter minate.Co manor and Wilson[ 8] have found a positiveadvertising effect, and Scherer notes that this finding "has beenreplicated using diverse profitability measures and fir m orindustry samples"[20, p. 286].Thus, a positive sign is expectedfor advertising.!mel and Hei mberger[17] reported that researchand development intensity had a significant positive effect onpro fitability.Therefore, a positive sign should also be expectedfor the research variable.The capital-to-sales ratio is includ edin the model, to account for interindustry variations in capitalintensity, when a return-on-sales variable is used to measurepro fitability.The ratio should have a positive sign, since thefirm's return on sales does not consider the capital stock.- 14 A
few industry variables are also included in the study.Concentration should increase the profitability of every fir m int he industry, if it acts as a proxy for shared market power.Therefore, a positive sign is expected.The percentage increasein industry sales is included to allow growth to affect industryprofits.The sign of the growth variable is indeter minate.Ifgrowth is a proxy for undercapacity, high growth should be linkedto high profitability.But the portfolio theory sug gests that thei nvestment necessary in high-growth industries could reduce them easured short-r un profitability of these businesses.negative relationship could be found.Thus, aIn conclusion, the basicB CG hypotheses will be supported if we find the following:1)The relatedness variable is insignificant;2) The diversification variable is significant;3) The relative-market-share variable is significant.E S TIM A TI ON O F T HE M ODELThe regression model requires a complicated data set, to testthe three hypotheses.The construction of the file requiredmerging the 1978 Economic Information System(E IS) data, 1976-78Comp ustat financial infor mation, and 1977 census data on four digit SI C industries.Each data set contributed to the calcula tion of the variables used in the regression model.The EIS tapede fined the firm's market share and the percentage of its sales ina given industry.The Comp ustat file provided profit, sales,- 15
asset, advertising, and research-and-development data.The actualvalues for these variables were calculated by averaging the 1976,1977, and 1978 observations, using the GNP price deflator toexpress all the data in 1977 dollars.The Census data defined theconcentration ratio and the value of shipments for each four-digitSI C industry.Concentration was used to calculate relative marketshare fro m the EIS share variable, and the value-of-shipment datafor 1972 and 1977 was used to co mp ute the industry growth rate.The data set initially used firms with 1977-78 do mesticmanufacturing sales of over half a billion dollars.Then all thefir ms that did not appear on the Comp ustat tape were deleted.Other firms were deleted if the EIS measure of sales was notapproxi mately equal to the Co mpustat sales.This eliminated thefir ms with substantial foreign sales and left us with a data setof 131 fir ms .Advertising and research-and-development data were not avail able for all the firms on the Compustat tape.To avoid losingmore observations, we constructed estimates of the advertising andthe research-and-development intensities for each fir m, based online-of-business industry data[ 2 5]. 7The available Co mpustatvariables were modeled with the esti mates and the relationshipswere used to project the missing data.This process allowed us tokeep the entire data set.7 The line-of -business data were supple mented by additionalinfor mation to define values for each four-digit SI C industry[ 23, 27].-16
Two profitability measures--the return on sales and thereturn on equity--were used as dependent variables.8Since thedependent variable is defined at the fir m level, a weightingscheme is required to calculate the business-unit-based explana tory variables.Carter notes that the weights should beconsistent with the profit measure used in the model[6].Thereturn-on-sales variable implies the fir m can use a simple salesshare weighting system .But the return-on-equity variablerequires the weights to be based on the equity of the unit.Individual equity measures for each business unit are not avail able, so we used the two-digit industry capital/output ratio toestimate a capital-share measure from the sales/share data. 9Thisweighting system approximates the equity share of each business.Thus, the two dependent variables have slightly different sets ofindependent variables.The profitability model was estimated with ordinary-least squares ( OLS) , and the results for the two dependent variables arepresented in table 1.A graphical analysis of the error termsindicated that heteroscedast city was a problem, so a generalized least-squares(GLS) for mulation was comp uted lOThese8The return-on-sales measure incorporates both profits andinterest expense, while the return on equity only includesprofits.9The necessary data were taken from tables A- 1 and A-2 of[26] 10Following an earlier F T C study, the fourth root of assets wasused as the correction factor for the data [24] -17
Table 1.--Regression Results for OLS ModelReturnonE quityReturnonSales-.0009(-. 5 0).0 003( 4)0 007*(3 5)000 2*(2. 5 )RMS.10 2 5 *( 2.1).o 54*(3.1)l/Log1 A0.38 0 7*(2.8 ).169*(3.0)AD/S7267*( 2.1).376*(3.0)RD/S778 0 *(2.2).446*(3. 5)C4-.00001(-.0 3)-.0001(-1.0)G.0 3467*( 2.4)RELDIV 0 186*( 3 4) K/SConstant.0726*(10. 5)-.0 910 *(-3.3)-.1068(-1.7)S MSE.018.0 0 52R.2136.5 147SMSE is the ratio of the standard error of the regressionto the mean of the dependent variable.*Statistically significant at the-18 a .0 5 level.
coefficients are similar to the OLS results and are given intable 2.Relative market share had a significant positive effect inall the equations.The coefficient in the GLS return-on-equityequation implied that a 10-percent gain in average share willincrease prof itability by 1.5 percent.Thus, a firm that dominatest he indu stries of its major business units should be more profit a ble than its competitors.This conclu sion supports the basicmarket-share goal of the BCG model.The relatedness variable was insignificant in all the equa tions.This sug gests that diversification into different lines ofbusiness in the sa me two-digit industry gr oup does not generallyoffer the firm superior returns.unit concept may be va lid.Thus the indep endent-business But the lack of a relationship couldalso be caused by an incorrect measure of relatedness.A detailedstudy of relatedness may be able to identify all the potentialsynergistic relationships between fou r-digit SI C indu stries andallow a better test of the hypothesis.The diversification measure had a significant positive effecton the performa nce of the firm.This implies that dive rsifiedfir ms are more profitable than single-business fir ms, so capitalmarket imperfections li mit the prof itability of single-unit firms .Thus, it is possible that the firm faces a constraint on invest ment funds.- 19
Table 2.--Regression Results for GLS ModelReturnonSalesReturnonE quityREL-.0004(-.2).0 003( .4 )DIV.0 009*(4.7)0003*(3.9)RMS.133*(2.9).064*(3.9)l/Log1 A0.458 *(3.5).198 *(3.8 )AD/S .8 30 *(2 5).45 2*(3 8 ).8 70 *(2. 6).447*( 3 7) RD/S C4-.0000 8(-.31)G.0 329*(2 .1).0 220 *(3 9)-.15 33*(-2.6)0 730 *(12. 5 )-.113*(-4.5)-.0001(- 1.1) K/SConstant S MSE.1 0 1.o 27CORR.2088.6074SMSE is the ratio of the standard error of the regression tothe mean of the dependent variable.CORR is the square of the correlation between the dependentvariable and the predicted values for the dependent variable. Itis equivalent to the R 2 in OLS .*Statistically significant at the- 20 a .05 level.
The coefficients on the control variables are also ofinterest.Both the advertising and the research-and-develop mentvariables had strong positive impacts on the profitabilitym easures.advertisingAs Carter has noted, this result can imply that(a nd research and development) raises the profit ability of a business or that profitable businesses have higheradvertising(a nd research and development) budgets[5] The sizevariable had a significant effect on all the return measures.This suggests that overall size has a negative effect on profit a bility after controlling for the diversification and efficiencyadvantages.llThe weighted industry growth rate was also posi tively linked to the performance of a fir m.Thus, the positivedisequilibrium -profit effect outweighs any profit-reducing effectsof growth.Concentration failed to increase the profitability oft he fir m in either of the equations.This implies that a group oflarge firms will not necessarily be able to collude well enoug h togenerate monopoly profits.Finally, the capital-to-sales variableAll of these results arehad the expected positive effect.consistent with some previous profitability studies.C ON CLUSI ONThis paper has discussed the basic B CG concepts of thebusiness unit, the limitation on corporate funds, the experiencecurve, and the connection between growth and investment.11Shepherd found the sa me effect in his study-21-[22] The most
i mp ortant concept is the experience curve and the resultingrelative-market-share/p rofitability hypothesis.The emp iricalevidence discussed in this paper supports this B CG theory.Thus,portfolio planning models should give serious consideration to therelativ.e market position of a business unit.Two other B CG concepts are also comp atible with the econo metric analysis presented in this paper.The relatedness variablewas insignificant, indicating that the independent-business-unithypothesis cannot be rejected.Also the significant diversifica tion measure implies that the investment limitation may be valid.But so me conflicting statistical evidence exists, and alternativeexplanations can be offered for our emp irical results, so nostrong conclusions should be drawn for the other B CG concepts.Thus it ipossible that a few empirical problems exist with thebasic B CG concepts.These problems would add to the theoreticalshortco mings of the B CG portfolio model and further limit itsgeneral applicability.-22
RE FEREN CES1.Berry, C. Corporate Growth and Diversification.N .J .: Princeton University Press, 1975.2.Boston Consulting Group. " The Market Share Paradox."Perspectives 72b, 1970.3.4.5.6." Cash Traps."Princeton,B CGB CG Perspectives 10 2, 1972."Payoff on the Corporate Portfolio."Perspectives No. 19 5, 1976.B CGCarter, J. collusion, Efficiency, and Antitrust."of Law and Economics 21 (Octob
best known portfolio model has been defined by the Boston Consulting Group (B CG} . This model is based on a set of funda mental concepts concerning the fir m and its business units. Theoreti