Transcription
(2021) 11:143Peñuelas et al. Ann. Intensive Carehttps://doi.org/10.1186/s13613-021-00929-yOpen AccessRESEARCHLong‑term survival of mechanicallyventilated patients with severe COVID‑19:an observational cohort studyOscar Peñuelas1,2* , Laura del Campo‑Albendea3, Amanda Lesmes González de Aledo4, José Manuel Añón2,5,Carmen Rodríguez‑Solís1, Jordi Mancebo6, Paula Vera6, Daniel Ballesteros7, Jorge Jiménez1, Emilio Maseda8,Juan Carlos Figueira2,5, Nieves Franco9, Ángela Algaba10, Juan Pablo Avilés11, Ricardo Díaz11, Beatriz Abad12,Alfonso Canabal12, Ana Abella13, Federico Gordo13, Javier García14, Jessica García Suarez14, Jamil Cedeño15,Basilia Martínez‑Palacios16, Eva Manteiga16, Óscar Martínez17, Rafael Blancas17, Tommaso Bardi18,David Pestaña18, José Ángel Lorente1,2, Alfonso Muriel3, Andrés Esteban1 and Fernando Frutos‑Vivar1AbstractBackground: Information is lacking regarding long-term survival and predictive factors for mortality in patients withacute hypoxemic respiratory failure due to coronavirus disease 2019 (COVID-19) and undergoing invasive mechanicalventilation. We aimed to estimate 180-day mortality of patients with COVID-19 requiring invasive ventilation, and todevelop a predictive model for long-term mortality.Methods: Retrospective, multicentre, national cohort study between March 8 and April 30, 2020 in 16 intensive careunits (ICU) in Spain. Participants were consecutive adults who received invasive mechanical ventilation for COVID-19.Severe acute respiratory syndrome coronavirus 2 (SARS-CoV-2) infection detected in positive testing of a nasopharyn‑geal sample and confirmed by real time reverse-transcriptase polymerase chain reaction (rt-PCR). The primary out‑comes was 180-day survival after hospital admission. Secondary outcomes were length of ICU and hospital stay, andICU and in-hospital mortality. A predictive model was developed to estimate the probability of 180-day mortality.Results: 868 patients were included (median age, 64 years [interquartile range [IQR], 56–71 years]; 72% male).Severity at ICU admission, estimated by SAPS3, was 56 points [IQR 50–63]. Prior to intubation, 26% received sometype of noninvasive respiratory support. The unadjusted overall 180-day survival rates was 59% (95% CI 56–62%). Thepredictive factors measured during ICU stay, and associated with 180-day mortality were: age [Odds Ratio [OR] per1-year increase 1.051, 95% CI 1.033–1.068)), SAPS3 (OR per 1-point increase 1.027, 95% CI 1.011–1.044), diabetes (OR1.546, 95% CI 1.085–2.204), neutrophils to lymphocytes ratio (OR per 1-unit increase 1.008, 95% CI 1.001–1.016), failedattempt of noninvasive positive pressure ventilation prior to orotracheal intubation (OR 1.878 (95% CI 1.124–3.140),use of selective digestive decontamination strategy during ICU stay (OR 0.590 (95% CI 0.358–0.972) and administra‑tion of low dosage of corticosteroids (methylprednisolone 1 mg/kg) (OR 2.042 (95% CI 1.205–3.460).Conclusion: The long-term survival of mechanically ventilated patients with severe COVID-19 reaches more than50% and may help to provide individualized risk stratification and potential treatments.*Correspondence: openuelas@gmail.com1Intensive Care Unit, Hospital Universitario de Getafe, Carretera de Toledokm 12,500, 28905 Madrid, SpainFull list of author information is available at the end of the article The Author(s) 2021. Open Access This article is licensed under a Creative Commons Attribution 4.0 International License, whichpermits use, sharing, adaptation, distribution and reproduction in any medium or format, as long as you give appropriate credit to theoriginal author(s) and the source, provide a link to the Creative Commons licence, and indicate if changes were made. The images orother third party material in this article are included in the article’s Creative Commons licence, unless indicated otherwise in a credit lineto the material. If material is not included in the article’s Creative Commons licence and your intended use is not permitted by statutoryregulation or exceeds the permitted use, you will need to obtain permission directly from the copyright holder. To view a copy of thislicence, visit http:// creat iveco mmons. org/ licen ses/ by/4. 0/.
Peñuelas et al. Ann. Intensive Care(2021) 11:143Page 2 of 11Trial registration: ClinicalTrials.gov Identifier: NCT04379258. Registered 10 April 2020 (retrospectively registered)Keywords: Coronavirus disease 2019, COVID-19, ARDS, Intensive care unit, Invasive mechanical ventilation, Mortality,Pneumonia, SARS-CoV-2, Noninvasive ventilationBackgroundThe coronavirus disease 2019 (COVID-19) pandemic isone of the most serious health crises in recent decades [1]with over 138 million infections being reported worldwide. As a result, health care resources in many countriesare facing unprecedented challenges [2]. This context hasbeen especially dramatic in intensive care units (ICU)in view of the high daily incidence of acute hypoxemicrespiratory failure (AHRF) secondary to pneumonia bySARS-CoV-2. Reports show that between 14 and 17% ofhospital admissions for COVID-19 require transfer to theintensive care unit (ICU) [3, 4].Currently available information about critically ill adultpatients is heterogeneous because of the case-mix ofpatients, and in-hospital mortality rates differ betweencountries [5–9]. Specific data on patient characteristics and long-term survival in critically ill COVID-19patients are needed to inform decision-making regardingresource allocation, critical care capacity, and therapeuticoptions. Inter-hospital variation and international clinicalvariability in treatments and outcomes also needs to beassessed.We conducted a multicenter cohort study to analyzethe long-term mortality of patients who required invasivemechanical ventilation for severe COVID-19 pneumonia,and determine the impact of predictive variables measured during ICU stay for long-term mortality.MethodsThis observational cohort study was conducted in 16surgical and medical ICU at 12 university hospitals inMadrid and Barcelona, the Spanish cities most affectedby COVID-19 (a complete list of participating sites isprovided in the Supplement). We included all patientswho were admitted to the participating ICUs betweenMarch 8, 2020 and April 30, 2020, and who requiredinvasive mechanical ventilation for acute hypoxemic respiratory failure secondary to SARS-CoV-2 pneumonia.The diagnosis was confirmed by a positive result of realtime reverse-transcriptase polymerase chain reaction(RT-PCR) testing of a nasopharyngeal swab sample orfrom a lower respiratory tract sample [11]. SARS-CoV-2pneumonia was also diagnosed when there was a compatible clinical condition, and when typical abnormalitieson chest X-ray were present in absence of an alternative diagnosis [10, 11]. Patients were excluded from theanalysis if any data regarding relevant variables (Additional file 1: Appendix S1) were missing.Data collectionVariables recorded were: age, sex, height, weight, severity at admission estimated by the Simplified Acute Physiology Score (SAPS3) [which ranges from 16 points (lowseverity) to 226 points (high severity)], comorbidities,(previous medication use), mode of respiratory support(high flow nasal oxygen cannula and/or noninvasivepositive pressure ventilation [NPPV] as CPAP (continuous positive airway pressure) or BiPAP (Bi-Level Positive Airway Pressure)), use of compassionate medication[antivirals (lopinavir–ritonavir, remdesivir), hydroxychloroquine, and immunomodulatory agents (interleukin-6receptor antagonists, Janus kinase inhibitor, and corticosteroids)] before admission to ICU, length of hospitalstay prior to ICU admission, date of intubation, ventilatory settings within the first week of mechanical ventilation, daily arterial blood gases, concentrations of plasma/serum biomarkers drawn within 7 days of ICU admission,including high-sensitivity C-reactive protein, D-dimer,ferritin, high-sensitivity troponin, procalcitonin, andIL-6, use of adjuvant therapies for acute respiratory failure (neuromuscular blocking agents, inhaled pulmonaryvasodilators, ventilation in prone position, and extracorporeal membrane oxygenation), vasopressor agents,renal replacement therapy, antibacterial agents, antiviralagents, and other immunomodulatory agents, complications, and organ failure during the ICU stay.Patients were followed-up until 180 days after hospitaladmission. Patients who died were censored at the dateof death for the time-to-discharge analysis.Independent on-site monitoring was performed at eachparticipating center in coordination with the main investigators who verified all data.All data were monitored and reviewed by four externalinvestigators (OP, AE, CRS, and FFV) to detect erroneousand missing data.The study was approved by the institutional ethicsboard at each participating site. The requirement forinformed consent from individual patients was waived,because the study design was considered minimal-riskresearch using data collected for routine clinical practiceduring an ongoing public health emergency.The study was registered in ClinicalTrials.gov Identifier: NCT04379258. We followed the Strengthening the
Peñuelas et al. Ann. Intensive Care(2021) 11:143Reporting of Observational Studies in Epidemiology(STROBE) statement guidelines for observational cohortstudies [12].Statistical analysisFollowing the approval of the ethics committee at eachparticipating center, patients were collected retrospectively to allow rapid data collection and over 180 days ofprospective follow-up to analyze clinical outcomes (dataextraction date: April 16, 2020).The main outcome was mortality at 180 days. Secondary outcomes were duration of mechanical ventilation,duration of ICU and in-hospital stay, reason for deathand destiny at hospital discharge.Variables included in the predictive model were as follows: age, sex, comorbidities (diabetes, hypertension,obesity), and the following pre-admission medications:angiotensin-converting enzyme inhibitors, angiotensinreceptor blockers and chronic steroids. We also includedin the model non-invasive respiratory support beforeorotracheal intubation, time from hospital admissionuntil intubation, SAPS3, relevant variables determinedwithin the first 48 h of admission to the ICU (neutrophilto lymphocyte ratio, PaO2 to FiO2 ratio, D-dimer, ventilatory ratio [14], tidal volume and positive end-expiratorypressure (PEEP)). We also included treatments givenwithin in the first 48 h of mechanical ventilation (vasopressor support, antivirals, immunomodulatory therapy,steroids, anticoagulants, neuromuscular blocking agents,selective digestive decontamination, and prone position).All of the variables were selected by clinical criteria.Missing data were assumed to be MAR. All missingdata were multiply imputed via the Multivariate Imputation by Chained Equations (MICE) procedure [13].Incomplete dichotomous variable was imputed using alogistic regression model, while linear regression wasused to impute incomplete continuous variables. Wegenerated 10 imputed data sets. Since MAR and MNARcannot be distinguished from observed data, additionalsensitivity analyses [14] is shown in the supplement(Additional file 1: Table S10).Mortality outcomes were analyzed using mixed-effectslogistic regression in the imputed data sets. The analysis was fitted with a random effect in which the patientswere nested in ICUs to characterize ICU-level variationand to estimate center-specific rates of ICU-mortality.The fractional polynomial method was used to explorethe behavior of continuous variables. We applied stepwise selection with backward elimination of predictorsfrom the full model with p 0.05.The final model was then validated by bootstrapping.Using this procedure we sampled 100 samples for eachimputed data set with replacement. Discrimination ofPage 3 of 11the model was evaluated using the c-statistic: for a binaryoutcome, c is identical to the area under the receiveroperating curve (AUROC). Calibration was evaluatedstudying the calibration slope and calibration-in-thelarge (CITL). This approach indicates the differencebetween the observed prevalence of death and the predicted mean probability. In a perfect model, the CITLshould be equal to zero, but our CITL value was smalland the confidence interval contained 0.The calibration slope tells us if the model coefficientsare underfitted (slope 1) or overfitted (slope 1). Inour case, the slope was below 1, so it was insufficientto obtain the data from our model. However, this is notentirely negative, because as a predictive model, we wantthe model to be able to explain future data from otherpatients and units, not just our data. Furthermore, 1 isincluded in the confidence interval, so we can consider itto be a good model in terms of calibration. [15].Subsequently, coefficients were used to generate anomogram to predict the adjusted probability of ICUmortality individually.To account for differences in patient-level characteristics and illness severity between ICUs, we calculated themedian odds ratio (MOR) [16].Finally, in a sensitivity analysis for the multilevel model,further adjustments were made for the number of ICUbeds at each hospital before the COVID-19 pandemic( 50, and 50 ICU beds).The 180-day survival outcomes were calculated usinga Kaplan–Meier survival plot in an overall cohort andby predefined subgroups (age categorized in 70 or 70years; SAPS3 categorized in 50 or 50 points; ratio PaO2/FiO2 categorized according to the acute respiratorydistress syndrome (ARDS) Berlin definition [17]).The differences between survival curves were evaluatedby log-rank test. To identify the optimal cut-point valuein ROC analysis we used the Youden index approach. Statistical significance was considered at p 0.05.Analyses were performed using Stata, version 16.1(StataCorp LLC).ResultsDescription of the population included in the analysisDuring the study period, 868 of the 1,170 patients whowere admitted to the participating ICUs were includedin the analysis. A flow chart of study patients is provided in Additional file 1: Figure S1 and clinical characteristics of excluded patients are summarized inAdditional file 1: Table S1. Patients’ baseline patientcharacteristics are shown in Table 1. Seventy-two percent were males and mean (standard deviation [SD])age was 62 years [11 years]. The median number of daysfrom onset of symptoms to admission to hospital was
Peñuelas et al. Ann. Intensive Care(2021) 11:143Page 4 of 11Table 1 Baseline characteristics of included patients in the analysisOverallN 868SurvivorsN 533Non-SurvivorsN 335p-valueAge, mean (SD), years64 (11)59 (12)66 (10) 0.001Female sex243 (28)134 (30.8)79 (23.6)0.013Body mass index, mean (SD), kg/cm229 (5)29 (5)29 (5)0.317SAPS3, mean (SD), points57.2 (11.0)55.2 (9.8)60.2 (12.1) 0.001ComorbiditiesHypertension401 (46)223 (42)178 (53)0.001Obesity268 (31)176 (33)92 (27)0.049Diabetes209 (24)103 (19)106 (32) 0.001Previous therapyAngiotensin-converting enzyme inhibitors172 (20)95 (18)77 (23)0.039Angiotensin II receptor blockers122 (15)69 (13)53 (16)0.139Steroids34 (4)15 (3)19 (6)0.028Days from initiation symptoms to admission at hospital, median (P25, P75)7 (4, 9)7 (5, 9)6 (4, 8)0.078Days from admission at hospital until orotracheal intubation, median (P25, P75)3 (2, 6)3 (1, 5)3 (1, 7)0.001644 (74)421 (79)223 (67)Noninvasive Respiratory support at wardOxygen mask alone0.066High flow oxygen nasal cannula alone105 (12)66 (12)39 (12)Non-invasive positive pressure ventilation alone98 (11)54 (10.1)44 (13)Non-invasive positive pressure ventilation and High flow oxygen nasal cannula21 (2)10 (2)11 (3)Ventilatory management at ICU admissionTidal volume, mean (SD), ml/kg PBW7.2 (1)7.2 (1)7.2 (2)0.476PEEP, mean (SD), cm of water13 (3)13 (3)13 (3)0.4070.016Ratio PaO2/FiO2, mean (SD)105 (48)108 (47)100 (48)D-dimer, median (P25, P75), mg/ml,3.5 (1, 17)4 (1, 20)3.5 (1, 12)0.425Ventilatory ratio, mean (SD)2.1 (0.8)2.0 (0.8)2.2 (0.9)0.0090.428Ratio neutrophil: lymphocyte, median (P25, P75)13 (7, 22)11 (7, 18)16 (9, 28)Selective Digestive Decontamination450 (52)301 (56)149 (45) 0.001Immunomodulator therapy347 (40)210 (39)137 (41)0.357449 (52)276 (52)173 (52)SteroidsNoMethylprednisolone 1 mg/kgMethylprednisolone 1 mg/kg0.104206 (24)137 (26)69 (21)213 (24)120 (22)93 (28)155 (17.9)89 (16.7)66 (19.7)Compassionate therapies received during hospital stayNone0.013Antiviral therapy only196 (22.6)136 (25.5)60 (17.9)Immunomodulatory agents only71 (8.2)35 (6.6)36 (10.8)Antiviral and inmunomodulatory therapies446 (51.4)273 (51.2)173 (51.6)Antiviral therapy796 (92)492 (92)304 (91)0.245Anticoagulation therapy90 (10)55 (10)35 (10)0.342306 (32)203 (38)103 (31)NorepinephrineaNo 0.001Low doses105 (12)44 (8)61 (18)High doses457 (53)286 (54)171 (51)Days until intubation, median (P25, P75)3 (1, 6)3 (1, 5)3 (1, 7)0.002Meet ARDS criteria at ICU admissionAt ICU admission0.009On day 2 from starting ventilatory support 0.001Mild ARDSAt ICU admission220 (25.4)136 (25.5)84 (25.1)
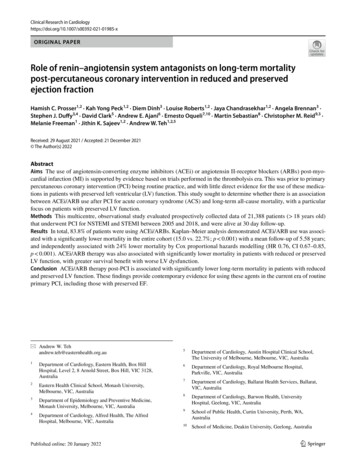
Peñuelas et al. Ann. Intensive Care(2021) 11:143Page 5 of 11Table 1 (continued)On day 2 from starting ventilatory supportOverallN 868SurvivorsN 533Non-SurvivorsN 335331 (38.2)232 (43.6)99 (29.6)p-valueModerate ARDSAt t ICU admission409 (47.1)267 (50.1)142 (42.4)On day 2 from starting ventilatory support410 (47.3)239 (44.9)171 (51.2)Severe ARDSAt ICU admission239 (27.5)130 (24.4)109 (32.5)On day 2 from starting ventilatory support125 (14.4)61 (11.5)64 (19.2)Data are n (%), unless otherwise indicated7 days (4, 9 days; p25, p75) and the median length ofstay in the hospital before ICU admission was 3 days (1,5 days; p25, p75). The most common comorbidity wascardiovascular disease (49%). During ward stay beforeICU admission, most patients (75%) received someantiviral and/or immune-modulatory therapy, andnoninvasive respiratory support was attempted beforeorotracheal intubation was initiated in 28% of patients(cannula nasal high-flow oxygen in 14% and NPPV in14%), while 68% received conventional oxygen by venturi or reservoir mask, and 4% received a combinationof cannula nasal high-flow oxygen and NPPV.Severity at admission to the ICU estimated by SAPS3was a mean 57 points (SD, 11 points) (predicted mortality was 29%). At admission to the ICU, serum biomarkers and ventilatory settings, arterial blood gases,adjuvant therapies within the first week of mechanicalventilation (Additional file 1: Table S3 and Figure S2).According to ARDS Berlin criteria, 231 patients (27%)had severe ARDS when mechanical ventilation wasstarted.Severe ARDS criteria and hypercapnia were also higherin non-survivors: (61% vs. 53%; p 0.018) and (mean PaCO2 56 mmHg vs. 52 mmHg; p 0.001), respectively.Within the first 48 h, ventilatory management (tidal volume, PEEP) was similar in both cohorts (Additional file 1:Table S1 and Figure S2). Early use of ventilatory settingsand adjuvant therapies within the first week of ICU stay(prone position, ECMO, nitric oxide inhaled, and neuromuscular blockers) were not different in survivors andnon-survivors (Additional file 1: Table S4).In addition, level of serum biomarkers, and complications within the first week of ICU stay are shown inAdditional file 1: Tables S5, S6, S7, Figures S2 and S3.The neutrophil to lymphocyte ratio was the mostrelevant biomarker and most significant difference inserum biomarkers (Additional file 1: Tables S1 and S8).Of the pharmacological treatments initiated in theICU within the first 48 h, only the implementation ofselective digestive decontamination strategy was associated with a significant decrease in mortality (Additional file 1: Table S1).Analysis of long‑term mortalityThe overall 180-day survival was 59.5% (95% CI 56.1–62.6%) (Fig. 1). Unadjusted Kaplan–Meier survival curvesby subgroups showed that survival rates at 180 days offollow-up were lower in patients over 70 years (40% vs.66.5%, log rank test 0.001, respectively) (Additionalfile 1: Figure S4).Twenty-two variables measured at ICU admission(Additional file 1: Table S8) were included in the multivariable logistic model. In the final multivariable multiple imputation model, after the backwards strategy, theadjusted predictive variables associated with 180-daymortality were: age ( Odds ratio [OR] per 1-year increase1.051, 95% confidence interval [CI] 1.033–1.068), SAPS3(OR per 1-point increase 1.027, 95% CI 1.011–1.044],diabetes (OR 1.546, 95% CI 1.085–2.204), neutrophils tolymphocytes ratio (OR per 1-unit increase 1.008, 95%CI 1.001–1.016), failure of noninvasive positive pressureventilation prior to orotracheal intubation (OR 1.878(95% CI 1.124–3.140), use of selective digestive decontamination strategy during ICU stay (OR 0.590 (95% CI0.358–0.972) and administration of low dosage of corticosteroids (methylprednisolone 1 mg/kg) (OR 2.042(95% CI 1.205–3.460). The model was internally validatedby bootstrapping (Fig. 2). The algorithm had an AUCof 0.716 (95% CI 0.682–0.749), and a calibration, CITL0.001 (95% CI -0.318–0.307) with slope 0.925 (95% CI0.734–1.116).The results of the mixed-effect analysis (Additionalfile 1: Table S10) showed that center had an effectassociated with 180-mortality (median odds ratio[MOR] 1.829). Sensitivity analysis also showed effectswhen comparing centers that included more than 50patients (N 7) with those with less than 50 patients
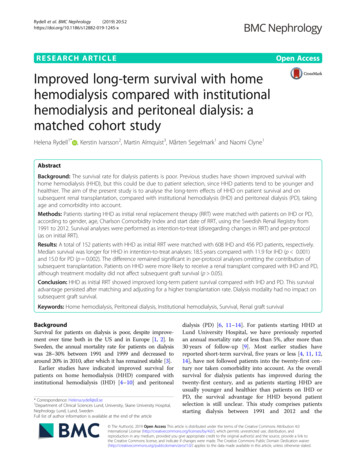
Peñuelas et al. Ann. Intensive Care(2021) 11:143Page 6 of 11Fig. 1 Kaplan–Meier survival curves. Overall survival at 180 days. Grey lines represent the 95% confidence intervalCharateristicOdds ratio (95% CI) for180-day mortalityAge1.05 (1.04, 1.07)Diabetes mellitus1.56 (1.10, 2.23)SAPS31.34 (1.32, 1.36)Neutrophil to lymphocyte ratio1.01 (1.00, 1.02)Increasedrisk of deathDecreasedrisk of deathNoninvasive respiratory support prior to orotracheal intubationOxygen maskHigh flow nasal cannulaNoninvasive ventilationNoninvasive ventilation & High flow nasal cannulaSelective Digestive Decontamination strategy1 (Reference)1.11 (0.66, 1.84)1.90 (1.14, 3.16)2.01 (0.74, 5.47)0.60 (0.37, 0.96)Administration of corticosteroidsNo1 (Reference)Methylprednisolone 1mg/kg2.04 (1.20, 3.46)Methylprednisolone 1mg/kg0.96 (0.68, 1.35)0.512Odds ratio (95% CI)4Fig. 2 Multivariable-adjusted risk model for death at 180 days and forest plot(N 9) and varied widely across centers (Additionalfile 1: Figure S5).Concerning survivors at hospital discharge, 426/553patients were transferred home (77%) and 23% (129/553)were transferred to a nursing facility.Other Clinical OutcomesAt the end of ICU stay follow-up (median, 27 days;IQR, 13–46 days). ICU mortality was 38.5% (95% CI35%–42%).Among patients discharged alive from the ICU admission, the median ICU length of stay was 17 days (IQR,10–34 days) and the median hospital length of stay was38 days (IQR, 26–65 days).Predictive interpretations compared with 180-day mortality were largely unchanged when restricted to ICUmortality or hospital mortality (Table 2), although theneed of vasopressor support was an independent predictor factor for ICU and hospital mortality (OR 1.878,95% CI 1.119–3-152; OR 2.042, 95% CI 1.205–3.460,respectively).
Peñuelas et al. Ann. Intensive Care(2021) 11:143Page 7 of 11Table 2 Multivariable risk-adjusted predictive model for short- and long-term mortalityVariablesICU Mortality OR (95% CI)Hospital Mortality OR 28-day Mortality OR (95% CI)(95% CI)Age, (per 1-year increase)1.049 (1.032–1.066)1.050 (1.033–1.068)1.058 (1.035–1.081)1.546 (1.084–2.203)1.626 (1.093–2.420)MaleDiabetes mellitusChronic steroidsSAPS3, (per 1-point increase)3.697 (1.633–8.371)1.025 (1.008–1.041)1.027 (1.011–1.044)N:L ratio (per 1-unit increase)1.009 (1.002–1.016)1.008 (1.000–1.016)Failed attempt of NPPV prior to orotracheal intubation2.131 (1.279–3.550)1.878 (1.123–3.39)Selective Digestive Decontamination strategy0.587 (0.358–0.963)0.591 (0.358–0.972)Need of vasopressor support1.878 (1.119–3.152)2.042 (1.205–3.460)Methylprednisolone 1 mg/kg2.158 (1.197–3.891)0.500 (0.302–0.828)Methylprednisolone 1 mg/kg0.479 (0.283–0.811)AUC (95% CI)0.712 (0.677; 0.746)0.728(0.694; 0.761)0.746 (0.705; 0.787)Calibration, CITL (95% CI)0.001 (-0.306; 0.308)0.0007(-0.312;0.313) 0.001 (-0.398; 0.398)Slope (95% CI)1.025 (0.822; 1.228)1.018 (0.827; 1.209)1.000 (0.788; 1.214)SAPS, Simplified Acute Physiology Score; NPPV: noninvasive positive pressure ventilation; N: L, neutrophil to lymphocyte ratio; AUC; area under the curve. OR, OddsRatio; CI, confidence intervalThe results of the mixed-effect analysis (Additionalfile 1: Table S9) showed that center had an effect associated with ICU mortality (MOR 1.85). A sensitivityanalysis of multiple imputation for ICU mortality showedthat the estimates obtained from the imputed data andthe estimates from the non-imputed data are almostidentical (Additional file 1: Table S11).DiscussionThis multicenter cohort study in 868 adult patients withsevere COVID-19 undergoing invasive mechanicalventilation in Spain provides follow-up data concerning long-term survival after ICU admission. Independent predictors associated with 180-day mortality wereolder age, higher SAPS3, the need for norepinephrine, anincreased neutrophil-to-lymphocyte ratio at ICU admission, a failed attempt of noninvasive positive pressureventilation, and the lack of use of a selective digestivedecontamination strategy during ICU stay. The proportion of patients who died varied widely between centers.To the best of our knowledge, this is the first reportdealing with and long-term outcomes in a large cohort ofmechanically ventilated patients with severe COVID-19.Overall, in-hospital mortality was 40.5%, which is considerably lower than that in other high-income countries[18–24]. However, the age distribution and comorbidities of patients on mechanical ventilation was similar tothat in these cited national studies. ICU mortality in ourcohort was also similar (38%) to that in a large cohort ofcritically ill patients with COVID-19 in the Netherlands[24]. It is of note that patients in our study were followedfor up to 180 days and survival rate was 59%.Age has been one of the most controversial aspectsduring the outbreak of the COVID-19 pandemic. In ourstudy, the unadjusted 180-day survival curves in severelyill patients over 70 years of age was above 50%, representing a better clinical outcome than in previous studies in older patients undergoing mechanical ventilation[26, 27]. Despite being considered clinically relevant, thisdifference in survival implies that age cannot be usedas a clinical criterion to determine initiation of invasivemechanical ventilation. The availability of complementary clinical tools could aid decision-making with respectto initiating mechanical ventilation. In this sense, assessment of frailty has shown to be a robust guide to resourceallocation in severely ill older patients with COVID-19[28].The use of non-invasive positive pressure ventilation(NPPV) for respiratory management of patients withsevere acute respiratory distress is controversial [29].Studies related to non-invasive positive pressure ventilation failure have shown that the delay in interruptingthis ventilation may be associated with increased mortality [30–33]. Specifically, in a retrospective chart reviewstudy of patients with COVID-19 in Italy, mortality was76% [34] in those who received noninvasive ventilation.In our study, the application of NPPV was not protocolized, and therefore, patients received any modalityof NPPV (CPAP and BiPAP), and any kind of interfaceswere used. Unfortunately, monitoring of respiratory
Peñuelas et al. Ann. Intensive Care(2021) 11:143parameters, modalities or management during sessionswas not addressed due to the overwhelmed healthcareresources consumption during the pandemic, and useoutside the ICU of these devices as well. Helmet noninvasive ventilation has been evaluated as an alternativefor the noninvasive respiratory support of patients withhypoxemia with promising results in severe patientswith COVID-19, but not found significant difference inthe number of days free of respiratory support. Hence,monitoring of patients receiving noninvasive respiratorysupport during AHRF remains of paramount importancenot to delay endotracheal intubation. On the other hand,probably patients that received NPPV as a prior attemptof noninvasive respiratory support were the most severepatients in which failed NPPV and, therefore, a selectedtype of patients. These could also be a reason for theworst outcomes.The beneficial effect of the SDD strategy in mechanically ventilated critically ill patients has been widely studied, and meta-analysis based on individual patient datahave consistently shown improved patient outcomes withthis approach [35–37].Indeed, the similarity in ICU mortality between ourfindings and Dutch study [24] may be explained, becauseSDD are currently widely used in the Spanish participating ICU and Dutch ICU [38]. This is the first study toreport that SDD has the beneficial effect of decreasingICU mortality in mechanically ventilated patients withsevere COVID-19. Nevertheless, the low difference of theuse of SDD between ICU survivors compared with ICUnon survivors may limit to assume a direct impact in theoutcomes. We did not, however, analyze the relationshipbetween SDD-nosocomial infections in patients withsevere COVID-19 and mortality, an objective for posthoc analysis.A hematological dysfunction defined as an increasedneutrophil to absolute lymphocyte ratio (NLR) wasrecently described. The NLR has been identified as biomarker of higher in-hospital mortality [39]. Anotherstudy showed that NLR was significantly higher in hospitalized patients with severe forms of COVID-19 [40]and a higher NLR at hospital admission was associatedwith worse outcome [41, 42]. In our predictive model, anNLR higher than 15 on day 1 was significantly associatedwith increas
tics and long-term survival in critically ill COVID-19 patients are needed to inform decision-making regarding resource allocation, critical care capacity, and therapeutic options. Inter-hospital variation and international clinical variability in treatments and outcomes also needs to be ass