Transcription
GUIDELINES AND STANDARDSGuidelines for Performing a ComprehensiveTransthoracic Echocardiographic Examinationin Adults: Recommendations from the AmericanSociety of EchocardiographyCarol Mitchell, PhD, ACS, RDMS, RDCS, RVT, RT(R), FASE, Co-Chair, Peter S. Rahko, MD, FASE, Co-Chair,Lori A. Blauwet, MD, FASE, Barry Canaday, RN, MS, RDCS, RCS, FASE, Joshua A. Finstuen, MA, RT(R),RDCS, FASE, Michael C. Foster, BA, RCS, RCCS, RDCS, FASE, Kenneth Horton, ACS, RCS, FASE,Kofo O. Ogunyankin, MD, FASE, Richard A. Palma, BS, RDCS, RCS, ACS, FASE, and Eric J. Velazquez, MD,FASE, Madison, Wisconsin; Rochester, Minnesota; Klamath Falls, Oregon; Durham, North Carolina; Salt Lake City,Utah; Ikoyi, Lagos, Nigeria; and Hartford, ConnecticutThis document is endorsed by the following American Society of Echocardiography International Alliance Partners:Argentine Federation of Cardiology, Argentine Society of Cardiology, ASEAN Society of Echocardiography,Australasian Sonographers Association, British Society of Echocardiography, Canadian Society of Echocardiography,Chinese Society of Echocardiography, Department of Cardiovascular Imaging of the Brazilian Society of Cardiology,Indian Academy of Echocardiography, Indian Association of Cardiovascular Thoracic Anaesthesiologists, IndonesianSociety of Echocardiography, InterAmerican Association of Echocardiography, Iranian Society of Echocardiography,Israel Work Group on Echocardiography, Italian Association of Cardiothoracic Anaesthesiologists, Japanese Society ofEchocardiography, Korean Society of Echocardiography, National Society of Echocardiography of Mexico, PhilippineSociety of Echocardiography, Saudi Arabian Society of Echocardiography, Thai Society of Echocardiography,Vietnamese Society of Echocardiography.Keywords: Transthoracic echocardiography, Doppler echocardiography, Color Doppler echocardiography,Comprehensive examination, ProtocolTABLE OF CONTENTSI. Introduction 3II. Nomenclature 4A. Image Acquisition Windows 4B. Scanning Maneuvers 5C. Measurement Techniques 5III. Instrumentation 5A. Two-Dimensional Imaging 51. Grayscale Maps 52. B-mode Colorization 63. Dynamic Range 64. Transmit Frequency 65. Harmonic Imaging 76. Sector Size and Depth 87. Transducer Beam Focus 88. Overall Gain and Time-Gain Compensation8From the University of Wisconsin School of Medicine and Public Health, Madison,Wisconsin (C.M., P.S.R.); the Mayo Clinic, Rochester, Minnesota (L.A.B., J.A.F.);the Oregon Institute of Technology, Klamath Falls, Oregon (B.C.); DukeUniversity Medical Center, Durham, North Carolina (M.C.F., E.J.V.);Intermountain Heart Institute, Intermountain Medical Center, Salt Lake City,Utah (K.H.); First Cardiology Consultants Hospital, Ikoyi, Lagos, Nigeria (K.O.O.);and St. Francis Hospital and Medical Center, Hartford, Connecticut (R.A.P.).RDCS, RCS, ACS, FASE, has served on the speakers bureau for Lantheus MedicalImaging and as a faculty speaker for Gulf Coast Ultrasound. Eric J. Velazquez, MD,FASE, received cardiovascular research grants from the National Institutes ofHealth/National Heart, Lung, and Blood Institute, Alnylam Pharmaceuticals, Amgen, General Electric, Novartis Pharmaceutical, and Pfizer and has served as aconsultant for ABIOMED, Amgen, Merck, New Century Health, Novartis Pharmaceutical, and Philips Ultrasound.This document is endorsed by the following American Society of Echocardiography International Alliance Partners: the Cardiovascular Imaging Department ofthe Brazilian Society of Cardiology, the Chinese Society of Echocardiography,the Indian Academy of Echocardiography, the Japanese Society of Echocardiography, the InterAmerican Association of Echocardiography, the Italian Associationof Cardiothoracic Anaesthesiologists.* Reprint requests: American Society of Echocardiography, Meridian CorporateCenter, 2530 Meridian Parkway, Suite 450, Durham, NC 27713 (E-mail: ase@asecho.org).The following authors reported no actual or potential conflicts of interest in relationto this document: Peter S. Rahko, MD, FASE, Lori A. Blauwet, MD, FASE, BarryCanaday, RN, MS, RDCS, RCS, FASE, Joshua A. Finstuen, MA, RT(R), RDCS,FASE, Michael C. Foster, BA, RCS, RCCS, RDCS, FASE, Kenneth Horton, ACS,RCS, FASE, Kofo O. Ogunyankin, MD, FASE. The following authors reported relationships with one or more commercial interests: Carol Mitchell, PhD, ACS, RDMS,RDCS, RVT, RT(R), FASE, authored a textbook for Davies Publishing Inc., andauthorship with royalties for Elsevier and Wolters-Kluwer. Richard A. Palma, BS,Attention ASE Members:Visit www.aseuniversity.org to earn free continuing medical education credit throughan online activity related to this article. Certificates are available for immediate accessupon successful completion of the activity. Nonmembers will need to join the ASE toaccess this great member benefit!0894-7317/ 36.00Copyright 2018 by the American Society of 18.06.0041
2 Mitchell et alJournal of the American Society of Echocardiography- 2018Abbreviations2D Two-dimensional3C Three-chamber (apical long axis)3D Three-dimensional4C Four-chamber5C Five-chamberA2C Apical two-chamberA4C Apical four-chamberAbd Ao Abdominal aortaALPap Anterolateral papillary muscleAMVL Anterior leaflet mitral valveAo AortaAR Aortic valve regurgitationAsc Ao Ascending aortaASE American Society of EchocardiographyAV Aortic valveCDI Color Doppler imagingCS Coronary sinusCW Continuous-waveDesc Ao Descending aortaDTI Doppler tissue imagingHPRF High–pulse repetition frequencyHvns Hepatic veinIAS Interatrial septumInnom a Innominate arteryIVC Inferior vena cavaIVS Interventricular septumLA Left atrialLCC Left coronary cuspLCCA Left common carotid arteryL innom vn Left innominate veinLSA Left subclavian arteryLV Left ventricularNCC Noncoronary cuspPA Pulmonary arteryPFO Patent foramen ovalePLAX Parasternal long-axisPMPap Posteromedial papillary musclePMVL Posterior leaflet mitral valvePR Pulmonic valve regurgitationPRF Pulse repetition frequencyPSAX Parasternal short-axisPulvn Pulmonary veinPV Pulmonic valvePW Pulsed-waveRA Right atriumRCA Right coronary arteryRCC Right coronary cuspR innom vn Right innominate veinROI Region of interestRPS Right parasternalRV Right ventricularRVIDd Right ventricular internal dimension diastoleRVOT Right ventricular outflow tractSC SubcostalSoVAo Sinus of ValsalvaSSN Suprasternal notchSTJ Sinotubular junctionSVC Superior vena cavaTAPSE Tricuspid annular plane systolic excursionTGC Time-gain compensationTR Tricuspid valve regurgitationTTE Transthoracic echocardiographicTV Tricuspid valveUEA Ultrasound enhancement agentVTI Velocity-time integralLVIDd Left ventricular internal dimension diastoleLVIDs Left ventricular internal dimension systoleLVOT Left ventricular outflow tractLVPW Left ventricle posterior wallMPA Main pulmonary arteryMR Mitral valve regurgitationMS Mitral stenosisMV Mitral valve9. Zoom/Magnification 810. Frame Rate 8B. Spectral Doppler 81. Velocity Scale 82. Sweep Speed 83. Sample Volume Size 104. Wall Filters and Gain 105. Display Settings 126. Pulsed-Wave Doppler, High–Pulse Repetition Frequency Doppler,and CW Doppler 127. Doppler Tissue Imaging 15C. Color Doppler Imaging 17
Mitchell et al 3Journal of the American Society of EchocardiographyVolume - Number -1. ROI and 2D Sector Size 172. Color Gain 173. Color Maps 174. Color Doppler Velocity Scale 17D. M Mode 181. Color M Mode 182. Steerable M Mode 18E. Electrocardiographic Setup 18IV. Two-Dimensional Imaging Protocol 23A. PLAX View 231. PLAX View: Left Ventricle 252. Right Ventricular Outflow Tract View 253. Right Ventricular Inflow View 25B. PSAX Views 25C. Apical Views 261. A4C View 262. Right Ventricle–Focused View 263. Apical Five-Chamber View 264. CS View 265. Two-Chamber View 306. Apical Long-Axis View (Three-Chamber View) 307. A4C and A2C Views Demonstrating the Atria and Pulvns 30D. SC Window and Views 311. SC Four-Chamber View 312. SC Short-Axis View 31E. SSN Long-Axis View 31V. Two-Dimensional Measurements 31A. PLAX View 311. Left Ventricle 312. Proximal RVOT 313. Anterior to Posterior LA Measurements 314. LVOT and Aortic Annulus 315. Asc Ao 32B. PSAX View 331. RVOT 332. PA 33C. Apical Views 331. LV Volume 33a. Biplane Disk Summation 33b. Three-Dimensional LV Volume 332. LA Volume 333. RV Linear Dimensions 334. RV Area 335. Right Atrial Volume 33D. SC Views 371. IVC 37VI. M-Mode Measurements 37A. TAPSE 37B. IVC 37C. AV 37VII. CDI 37A. RVOT, Pulmonary Valve, and PA 41B. RV Inflow and TV 41C. LV Inflow and MV 41D. LVOT and AV 42E. Aortic Arch 42F. Pulvns 42G. Hvns 42H. IVC 42I. Atrial Septum 42VIII. Spectral Doppler Imaging Measurements 42A. RVOT and Pulmonary Valve 43B. TV 43C. MV 43D. LVOT and AV 43E. Aortic Arch and Desc Ao 46F. Hvns 46G. Pulvns 46H. Tissue Doppler of the Mitral and Tricuspid Annuli 48IX. Additional Techniques 48A. Agitated-Saline Imaging 48B. UEA Imaging 491. Indications 492. Instrumentation and Administration 543. Image Acquisition 54C. Strain Imaging 54D. Three-Dimensional Evaluation of LV Size and Systolic Function 55X. The Integrated Complete Transthoracic Examination 55XI. The Limited Transthoracic Examination 55A. Pericardial Effusion 55B. LV Function 55C. Limited Right Ventricle and Pulmonary Hypertension 55XII. References 56XIII. Appendix: Additional Alternative Views 59A. PSAX Coronary Artery View 59B. RV A2C View 59C. SC SVC (Bicaval) View 59D. SC Abdominal Aorta 59E. Right Lateral Imaging of the IVC 59F. SC Short-Axis IVC 59G. SC Focused Interatrial Septum 59H. SC Short-Axis RVOT View 59I. SC Short-Axis Sweep from the Level of the Great Arteries through theApex of the Heart 59J. Right Parasternal View of the Aorta 59K. SSN Innominate Veins 64L. SSN Short-Axis LA and Pulvn View (‘‘Crab View’’) 64M. Color M-Mode Flow Propagation 64I. INTRODUCTIONSince the first report of the use of ultrasound for cardiovascular diagnosis by Edler and Hertz1 in 1954, echocardiography has expandedexponentially over the ensuing decades. The history of echocardiography is one of continuous innovation. With each discovery of newtechnology, the echocardiographic examination has progressivelybecome longer, more comprehensive, and integrated with morediverse technology. In some circumstances, refined technology hascompletely replaced old methods. In other circumstances, new technology is incorporated to enhance existing capabilities.Several professional organizations, including the American Societyof Echocardiography (ASE), have put considerable effort into thedevelopment of a wide array of comprehensive guidelines, typicallyfocusing on the use of echocardiography for specific clinical purposes.Other guidelines have focused on specific technique-based recommendations for such aspects of the examination as chamber quantification or diastolic performance.2,3 Accrediting agencies such as theIntersocietal Accreditation Commission have established standardsfor components of the echocardiographic examination.4The ASE established standards for the two-dimensional (2D)transthoracic echocardiographic (TTE) examination in 19805 andupdated recommended components of the examination in 2011.6Recently the British Society of Echocardiography updated aminimum data set for standard adult transthoracic echocardiography,7and the Swiss Society of Cardiology8 has established standards for theperformance of an echocardiographic examination by a cardiologist.The ASE has convened this writing group to establish new guidelinesfor the performance of a comprehensive TTE examination. Our purposes are to (1) establish the content of a comprehensive TTE examination, (2) provide recommendations for technical performance and
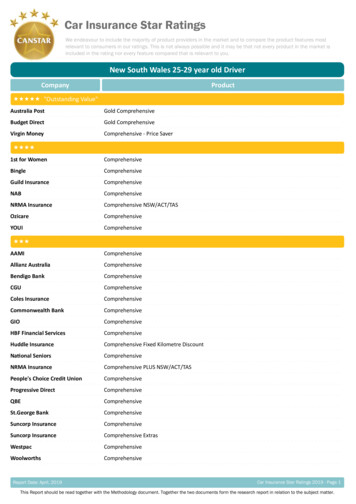
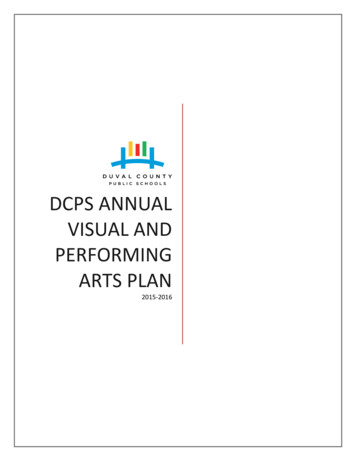
4 Mitchell et alJournal of the American Society of Echocardiography- 2018appropriate use of instrumentation during the examination, (3) provideguidance for the integration of the various ultrasound-based imagingmodalities into the comprehensive examination, and (4) describe bestpractices for the measurement and display of the data generated bythe comprehensive examination. It should be noted that pathologyspecific measurements are beyond the scope of this document.This document is divided into the following sections:I. IntroductionII. NomenclatureThis section will define standard views and scanning maneuversthat are used in this text.III. InstrumentationThis section provides recommendations and guidance for the useof modern ultrasound equipment to optimally display all modalitiesof the transthoracic examination.IV. Two-Dimensional ImagingThis section defines the writing committee’s recommendations forthe 2D-based views to be included in a comprehensive examination.V. Two-Dimensional MeasurementsThis section provides guidance on the standard measurements thatshould be obtained as part of the comprehensive TTE examination.VI. M-Mode MeasurementsFigure 1 Scanning planes of the heart. The long-axis plane corresponds to images acquired in the PLAX views. The short-axisplane corresponds to images acquired in the PSAX views. Theapical plane corresponds to images acquired from the apicalwindow.This section provides guidance on selected M-mode measurements.VII. Color Doppler ImagingThis section defines the basic imaging windows, display, and measurements for color Doppler imaging (CDI) to be integrated into thecomprehensive transthoracic examination. Similarly, display of colorDoppler flow interrogation for valves, vessels, and chambers is defined.VIII. Spectral Doppler ImagingThis section defines the basic imaging windows, display, and measurements for spectral Doppler to be integrated into the comprehensive transthoracic examination. Similarly, display and measurement of spectralDoppler flow interrogation for valves, vessels, and chambers are defined.IX. Additional TechniquesThe guideline makes recommendations on the use of agitated saline as well as ultrasound enhancement agents (UEAs) for improvement of endocardial border detection. The committee alsorecommends, when practicable, use of longitudinal strain imagingand three-dimensional (3D) evaluation of ventricular size and function as part of the standard examination.X. Examination SequenceThe integrated complete transthoracic examination is enumeratedin a recommended sequence of performance. We also make recommendations for selective use of a limited transthoracic examination.II. NOMENCLATUREA. Image Acquisition WindowsThe following nomenclature defines the imaging planes, views, and scanning maneuvers. Transducer movements will describe motions directedanterior, posterior, superior, inferior, lateral and medial (Figure 1). All ul-Figure 2 Echocardiographic windows to obtain images.trasound system transducers have an orientation index marker. Each viewdescribed in this text will provide orientation information on the basis ofpositioning of the index marker. The imaging windows described are theparasternal, apical, subcostal (SC), and suprasternal notch (SSN)(Figure 2). The patient is positioned in the left lateral decubitus position(as long as the patient is able to move) for image acquisition in the left parasternal and apical windows. The parasternal long-axis (PLAX) view islocated on the left side of the sternum and will provide imaging planesof the long axis of the heart with the index marker pointed toward thepatient’s right shoulder. The initial parasternal short-axis (PSAX) view islocated in the same location as the PLAX view, but the index marker ispointed toward the patient’s left shoulder. This view provides images ofthe heart in an axial plane. The apical window is located below the leftbreast tissue, where one can feel the apical impulse. In the apical windowthe index marker is initially placed in the 4 to 5 o’clock position to demonstrate the apical four-chamber (A4C) view. The SC window is located on
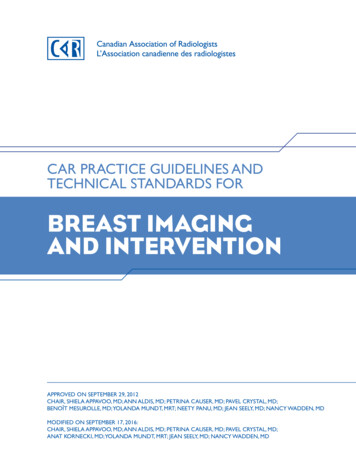
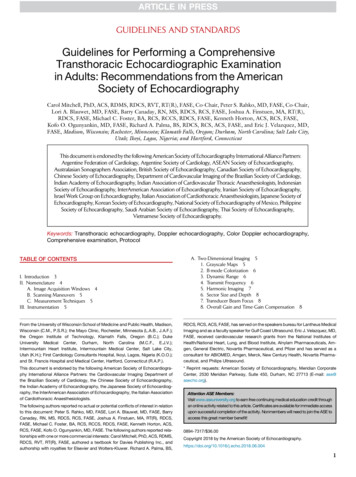
Mitchell et al 5Journal of the American Society of EchocardiographyVolume - Number -C. Measurement TechniquesIt is recommended by the writing group that the interface betweenthe compacted myocardium and the noncompacted myocardium(trabeculated) be used for all 2D and 3D measurements (Figure 8).The compacted myocardium is the solid, homogenous wall separatefrom trabeculations within the blood-filled left ventricular (LV) cavity.In instances when this interface cannot be discerned, one should measure at the blood-tissue interface.Key Points #1Figure 3 Tilting maneuver of the transducer. The blue dotrepresents the index orientation marker.the anterior surface of the body, just below the sternum. Image acquisitionfor this window is performed with the patient in the supine position. Theinitial view from this window is the SC four-chamber view, which is obtained with the index marker directed toward the patient’s left side at the3 o’clock position.2,9-12 The SSN window is located just superior to themanubrium of the sternum. Images are obtained from this windowwith the patient in the supine position. The initial view demonstrated isthe long axis of the aortic arch. The transducer orientation indexmarker is initially directed toward the left shoulder, and the face of thetransducer is directed inferior so that the transducer is almost parallelwith the neck. Small movements of rocking and angling may be usedto demonstrate the best view of the aortic arch.B. Scanning ManeuversThe terms tilt, sweep, rotate, slide, rock, and angle will be used to define transducer movements. The term tilt refers to a movement in which the transducer is fixed in position and the face of the transducer is moved todemonstrate other image planes in the same axis (Figure 3).13 Sweep refersto the deliberate action of capturing a long video clip of data. An exampleof a sweep would be recording the tilt planes of the heart from posterior toanterior in the apical window during one long video clip. The term rotaterefers to keeping the transducer in a stationary position but turning the index marker to a new position (Figure 4).9,13,14 The term slide refers tomoving the transducer over the patient’s skin to a new position(Figure 5).9,13,14 The terms rock and angle refer to smaller movementsused to optimize an image. Rock refers to an action of moving thetransducer, staying in the same imaging plane, toward or away fromthe transducer orientation marker to center a structure or extend thefield of view.13 Rock differs from tilt, in that the rock motion stays inthe same imaging plane (Figure 6), whereas the tilt motion refers to motion in the same axis but different imaging planes.13 Angle refers to a motion in which the image is optimized by keeping the transducer in thesame position and directing the sound beam toward a structure of interest. An example of angling is imaging of the tricuspid valve (TV) in the parasternal window, PSAX view, then moving the transducer to image thePSAX aortic valve (AV), then manipulating the transducer to demonstratethe pulmonic valve (PV) (Figure 7).14 Angle differs from rock, in that therock motion is used to center a structure, whereas the angle maneuver ismore complex, combining several small movements to optimize imagingof a structure but not necessarily centering the structure to the middle ofthe image display. Throughout this document the term optimize refers tomaking the appropriate transducer movements to produce the bestpossible image.Descriptions of transducer movements to optimize theimage:Tilt: The transducer maintains the same axis orientation to the heart but moves to a different imagingplane.Sweep: Multiple transducer movements are used torecord a long video clip to show multiple anatomicstructures.Rotate: The transducer maintains a stationaryposition while the index marker is moved to a newposition.Slide: The transducer moves across the patient’s skinto a new position.Rock: Within the same imaging plane, the transducerchanges orientation either toward or away from theorientation marker.Angle: The transducer is kept at the same location onthe chest, and the sound beam is directed to show anew structure.III. INSTRUMENTATIONOperators performing TTE imaging are expected to be familiar withinstrumentation settings and the contributions of these settings to image quality. Some features of image production are determined bydesign of the ultrasound system and cannot be changed by the operator. However, several instrumentation settings can be modified during image acquisition (preprocessing) or manipulated by the operatorafter data are collected and stored (postprocessing), and these areimportant for optimal image acquisition.10,15To save time for operators and improve consistency of imaging,many laboratories set up imaging ‘‘presets’’ on their ultrasound equipment. Presets are instrumentation settings that are optimal for imaginga particular type of patient, anatomic structure, or blood flow andshould be considered starting points for image optimization.10,15,16They are time saving in that they are set for a typical patientcoming to the echocardiography laboratory. Presets are available forall ultrasound imaging modes, including M-mode, 2D, and all formsof Doppler imaging.10,16,17 The first section of the guidelines willdiscuss instrumentation settings controlled by the operator.A. Two-Dimensional Imaging1. Grayscale Maps. The amplitude of reflected ultrasound detected by the imaging system varies over several logarithmic unitsof signal strength, well beyond the capacity of human visual perception. Systems process the data to enhance and suppress signals, transforming raw data into useful images that display the echocardiogramin various shades of gray. High-amplitude signals are depicted as
6 Mitchell et alJournal of the American Society of Echocardiography- 2018Figure 4 Rotating scanning maneuver. The blue dot represents the index orientation marker as it is related to the image. In the PLAXimage, the blue dot represents the orientation index marker located on the superior aspect of the image. In the PSAX image, the bluedot represents the position of the orientation index marker and the lateral aspect of the image.instance, the grayscale image is transformed to a different range ofcolors (e.g., sepia, a light pink color) instead of grays. Colorized Bmode may be a laboratory preference or an interpreting-physicianpreference. Some clinicians feel that the colorized image demonstrates certain pathologies better to their eye than the gray scale image.18,19 B-color does not change the amount or type ofinformation displayed, only the perception of the viewer(Tables 1.2a and 1.2b).18,19,20Figure 5 Sliding scanning maneuver.bright white and low-amplitude signals as dark gray, with absence ofsignal being black. Signal manipulation is presented to the operator asa series of grayscale maps that allows the operator to select a settingthat best displays images for a specific type of patient.17 Certainmaps may show specific pathology better or may be better suitedfor patients on the basis of body habitus. Cardiac grayscale mapsare designed to optimize the blood-tissue border (specular echoes)and demonstrate subtle differences in scattered echoes from weakreflectors, such as myocardium. Given the wide range of ultrasoundsystems available, the writing committee advises that all echocardiography laboratories work with application specialists from the manufacturer of the imaging systems to select optimal grayscale settings.Once laboratory protocols are selected, it is important to maintainconsistent settings, as this may facilitate longitudinal comparisonswith previous studies (Tables 1.1a and 1.1b).2. B-Mode Colorization. Within the grayscale map selection, thereis often an option for colorization of the B-mode image. In this3. Dynamic Range. An important grayscale parameter that adjuststhe appearance of the shades of gray on the image is the dynamicrange setting.10,17 On some ultrasound systems, this control is called‘‘compression.’’18 This setting changes the ratio between the highestand lowest received echo amplitudes in the image.10,17 A lowdynamic range setting yields an image that is very black and white(high contrast). This may be beneficial for difficult studies withmarginal image quality. A high dynamic range setting produces animage that has more shades of gray, which means that a smallerrange of amplitudes is assigned to a particular shade of gray makingup the image. For cardiac imaging, the dynamic range settingsshould be set to provide enough shades of gray to discern theinterface between compacted and noncompacted myocardium.Too few shades of gray may result in an underrepresentation orabsence of subtle, low-amplitude structures (e.g., a thin-walledsegment, thrombus, or vegetation), while too many shades of graymay make the image appear ‘‘washed out,’’ sometimes eliminating accurate differentiation between the compacted and noncompactedmyocardium (Tables 1.3a and 1.3b).4. Transmit Frequency. Transmit frequency refers to the operatingfrequency of the imaging transducer. The typical range of frequenciesused in adult echocardiography is 2.0 to 5.0 MHz. The higher frequencies produce better image resolution but are unable to penetrateas deep into the body as lower frequencies.10,17 With the availabilityof broad-bandwidth transducers, it is now relatively easy to modifytransmit frequency rapidly. Operators should start with a high
Mitchell et al 7Journal of the American Society of EchocardiographyVolume - Number -Figure 6 Rocking scanning maneuver. The blue dot represents the index orientation marker.Figure 7 Angling scanning maneuver. The blue dot represents the index orientation marker.transmit frequency and then adjust to lower frequencies if additionalpenetration of the sound wave is needed. The highest possible frequency should be used for imaging throughout the examination(Tables 1.4a and 1.4b).5. Harmonic Imaging. Modern imaging systems allow the selection of harmonic imaging, where returning frequencies that aremultiples of the transmit (fundamental) frequencies are used tocreate the ultrasound image. Harmonic frequencies are caused bythe sound beam becoming distorted as it travels throughtissues.10,17,21,22 Harmonic imaging most commonly uses thesecond harmonic frequency, which is twice the fundamentalfrequency.10,17,21,22 Manufacturers have lowered the fundamentalfrequency of transducers to increase penetration while displayingthe higher frequency second harmonic. This is especially helpful inpatients who are obese or have dense muscle tissue and typicallyyields higher quality images. Because the degree of harmonicdistortion is proportional to the strength of the reflected signal,higher energy specular echoes at tissue borders are enhanced whilelower energy noise is eliminated. Thus, harmonic imaging results inan image that appears clearer with a maximized signal-to-noiseratio.10,17,21,22 With early forms of tissue harmonic imaging, axialresolution was negatively affected by the long pulse durationsneeded for frequency resolution. Newer forms of broad bandwidthtissue harmonic imaging have resolved this problem and allowlow-artifact, high–axial resolution imaging.23 The writing committee
8 Mitchell et alJournal of the American Society of Echocardiography- 2018pods that can be adjusted to amplify a particular portion of the image. This control is used to make up for energy loss due to attenuation. Attenuation is the loss of ultrasound signal intensity andamplitude as it travels deeper into the body.10,17 Thus, returningsignals from the near field of the sector have much greateramplitude than those from the far field. Selective amplificationequalizes the appearance of structures across the entire sector(Tables 1.9a and 1.9b).On some ultrasound systems, there is an automatic ultrasoundoptimization function that rapidly and automatically adjusts theTGC on the basis of the echo information returning to the ultrasoundsystem.29 Although this may be a time-saving feature for the operator,it should be used as a starting point for image optimization and notviewed as a definitive image adjustment (Tables 1.10a and 1.10b).Figure 8 Tracing of the LV cavity in a patient with dilated cardiomyopathy. Note the prominent trabeculae (arrow) and papillarymuscles (asterisk), which are considered part of the LV cavity.recommends that cardiac ultrasound imaging be performed usingharmonic imaging at the highest possible frequency (Tables 1.5aand 1.5b).22,24-286. Sector Size and Depth. The depth setting of the image indicates how far into the body the ultrasound system attempts to detectanatomy. Depth is measured in units of length (such as centimeters ormillimeters) and should be set to maximize the size of the display forthe structures or flow of interest. Depth and sector width settings mayalso influence frame rates. Because the heart is a moving structure,higher frame rates are desirable to increase temporal resolution,particularly for rapidly moving structures. Unnecessarily large sectordepths increase the amount of time needed to produce each imagingline of the sector, forcing the system to compromise, either bylowering frame rates or by reducing the number of lines per sector,resulting in reduced image quality. Similarly, a narrower sector anglemay be appropriate in some circumstances to enhance image quality(Tables 1.6a and 1.6b).7. Transducer Beam Focus. Some systems use automatic specialized dynamic focusing on the basis of the preset and the imagingdepth. The operator cannot adjust this feature. Other systems havea manual transmit focus control that adjusts shape and width of thesound beam.17 Narrower widths yield better lateral resolution.17The focus should be set at the depth of the structure of interest(Tables 1.7a and 1.7b). Note that in cases in which the apex needsto be evaluated, moving the focus to the apex may increase resolution. Typica
Keywords: Transthoracic echocardiography, Doppler echocardiography, Color Doppler echocardiography, Comprehensive examination, Protocol TABLE OF CONTENTS I. Introduction 3 II. Nomenclature 4 A. Image Acquisition Windows 4 B. Scanning Maneuvers 5 C. Measurement Techniques 5 III. Instrumentat