Transcription
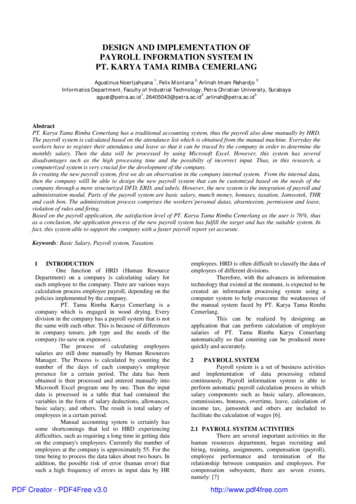
1Computerized Face Recognition in RenaissancePortrait ArtRamya Srinivasan, Conrad Rudolph and Amit Roy-ChowdhuryAbstract—In this work, we explore the feasibility of facerecognition technologies for analyzing works of portraiture, andin the process provide a quantitative source of evidence to arthistorians in answering many of their ambiguities concerningidentity of the subject in some portraits and in understandingartists’ styles. Works of portrait art bear the mark of visualinterpretation of the artist. Moreover, the number of samplesavailable to model these effects is often limited. Based on anunderstanding of artistic conventions, we show how to learn andvalidate features that are robust in distinguishing subjects inportraits (sitters) and that are also capable of characterizingan individual artist’s style. This can be used to learn a featurespace called Portrait Feature Space (PFS) that is representativeof quantitative measures of similarities between portrait pairsknown to represent same/different sitters. Through statisticalhypothesis tests we analyze uncertain portraits against knownidentities and explain the significance of the results from an arthistorian’s perspective. Results are shown on our data consistingof over 270 portraits belonging largely to the Renaissance era.Index Terms—Face Recognition, Portraits, Style ModelingKnown Image RESDETERMINEIMPORTANCEOFCHOSENLEARNDISTRIBUTIONSOF SIMILARITYBETWEENPORTRAIT PAIRSFEATURES.Reference ImageReference ImageCOMPUTE SIMILARITYASILLUSTRATED ABOVETEST THEHYPOTHESISARRIVE ATTHE CONCLUSIONTest ImageFig. 1. Illustration of the training (top) and identification framework (bottom)I. I NTRODUCTIONRenaissance portraits were depictions of some importantpeople of those times. These encompass a wide range of artworks such as sculptures, death masks, mosaics, etc. Apartfrom being used for a variety of dynastic and commemorativepurposes, they were used to depict individuals often to conveyan aura of power, beauty or other abstract qualities [1]. A largenumber of these portraits, however, have lost the identities oftheir subjects through the fortunes of time.Analysis of faces in portraits can offer significant insightsinto the personality, social standing, etc. of the subject theyrepresent. However, this is not a simple task since a portraitcan be “subject to social and artistic conventions that constructthe sitter as a type of their time” [1], thus resulting in largeuncertainty regarding the identity of many of these portraits.Traditionally, identification of many of these portraits has beenlimited to personal opinion, which is often quite variable.The project FACES (Faces, Art, and Computerized EvaluationSystems) was conceptualized to evaluate the application offace recognition technology to portrait art and in turn aid arthistorians by providing a quantitative source of evidence tohelp answer questions regarding subject identity and artists’styles. This paper will describe the challenges inherent in facerecognition in art images, and summarize the results obtainedA. Roy-Chowdhury and R. Srinivasan are with the Department of Electricaland Computer Engineering, University of California, Riverside. CA,92521.E-mail: amitrc@ee.ucr.eduC. Rudolph is with the Department of Art History, University of California,Riverside, CA 92521.in this project over the last two years. Some preliminary resultshave been presented in [12].There have been lingering ambiguities about the identity insome portraits–henceforth referred to as “test” images. Thequestion has been whether they might represent a certainknown identity, which we call as “reference images”. As aninstance, the test image in Fig.1 is a portrait painted perhapsaround 1590, and is believed by some to represent Galileo.Through computerized face recognition technologies, we tryto provide an alternate and quantitative source of evidence toart historians in answering such questions.In this direction, we leverage upon a number of portraitpairs that are known to represent a certain person as shownin top part of Fig.1. The task then is to train the computer inidentifying discriminative features that can not only distinguishone sitter from another, but also learn the importance of thechosen features depending on the amount of emphasis givento that feature by an artist. Using the learned features, quantitative measures of similarity between portrait pairs known torepresent the same person can be computed to yield what wecall “match scores”. Analogously, similarity scores betweenportrait pairs not known to represent the same person yield“non-match scores”. The resulting match (blue curve) andnon-match scores (red curve) together constitute what werefer to as the Portrait Feature Space (PFS). Subsequently,using hypothesis tests, the similarity score between test andreference image, as shown by the brown ball in bottom part of
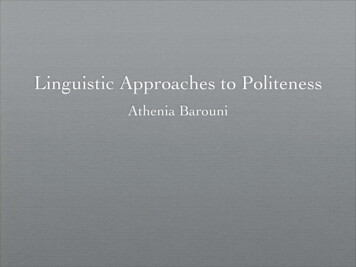
2Fig.1, is analyzed with respect to the learned PFS to arrive atappropriate conclusions of a possible match or non-match. Ifboth match or non-match happen to be likely, then no decisioncan be made.We begin by describing the challenges involved in facerecognition of portraits. Apart from the typical challengesassociated with face recognition systems such as variationsin pose, expression, illumination, etc., face recognition inportraits come with additional challenges. Some of these aredescribed below.1. Modeling Artists’ Styles: Since portraits bear the markof the visual interpretation of an artist, styles of individualartists characterizing their aesthetic sensibilities (often biasedby their socio-cultural backgrounds) have to be modeled. Thus,portraits of the same sitter can vary from artist to artist. Thisresults in considerable variability in the renditions, which hasto be accounted for by the face recognition algorithms.2. Lack of sufficient training data: Many existing featureselection methods rely on the availability of a significantamount of training data. This is rarely the case in our problemdomain due to the following reasons:(a) Lack of a significant body of images, the authenticity ofwhich is well established.(b) We need to logically choose a set of related images directedtowards a particular demonstrative end and adhering to aparticular period style.3. Choice of Features: Given the aforementioned constraints, we need to choose features that best justify anartist’s rendition and possess high discriminative power indistinguishing the sitter from others. Although there has beensome preliminary work on this [2], there is little to no elaboratework on understanding how to model style in face portraiture.This leads to interesting questions in machine learning oncombinations of various algorithms that are pertinent here.II. R ELATED W ORKWe review some image processing techniques employed forart analysis and also provide a survey of state-of-the-art incomputerized face recognition.Image Analysis in Art Works: Analysis of paintings usingsophisticated computer vision tools has gained popularityin recent years [5]. Computer analysis has been used foridentifying the artist [25] and for studying the effect of lightingin artworks [26], among others. A recent paper has exploredapplication of computer-based facial image analysis [6] using3D shape information to identify one subject, namely Da Vinciin four artworks. The present work involves multiple sitters(both genders) by different artists portrayed across differentmedia such as paintings, death masks, etc. Some preliminaryresults have been presented in our earlier paper [12] on asmall set of data. In this work, extensive results are shownon a much richer dataset, and using a more sophisticatedfeature extraction algorithm. Also, for the present analysis,shape information was found to be less discriminative whencompared to other features such as anthropometric distances(AD) and local features (LF). This can be partly attributed tothe evidence that artists often focused on LF and took someliberties with shape [13].Computerized Face Recognition: A survey of still and videobased face recognition research is provided in [3]. A vast majority of face recognition applications address surveillance andentertainment. These approaches can be classified into threecategories, namely holistic methods, feature based structuralmatching methods or a combination of both depending on therepresentation in feature space. 3D modeling approaches suchas [24] have also been studied. Recent research efforts havefocused on cross spectral face recognition for comparing images taken in heterogeneous environments [8]. Such methodsare not applicable for our study. First, since the images in thepresent scenario are obtained from museums across the world,we have no control on the kind of sensors used to capturethem. Second, the quality of the image is not an issue here;the challenge is choice of appropriate features.Some works [9], [28] model style factors such as a facialpose, expression, etc. and separate it from content, i.e., theidentity of the person, and show promising results for face poseestimation, among others. In [11], the authors use attributeslike chubby, attractive, etc. for face verification tasks. Whilemodels for separating style (e.g., an artist’s rendition) fromcontent (sitter’s identity) can be useful for the present study,all of the existing methods require hundreds of images. Someworks have looked at face recognition from sparse trainingdata [10]. In [7], the authors leverage upon much larger mugshot gallery images or composite sketches for training. In [27],the authors evaluate the probability that two faces have thesame underlying identity cause for recognition. However, thesemethods do not model style. In this work, we explore artist’sstyle from the available sparse data.III. D ISCRIMINATIVE F EATURE S ELECTIONA portrait is a visualization of an artist’s aesthetic sensibilities blended with the sitter’s personality. We therefore beginby understanding the relevant features for analysis based on astudy of artistic trends during the period under study.A. Face as Seen by ArtistsIt is evident from [13] that while drawing a human body, alot of emphasis was laid upon maintaining the proportionsof various parts. It is purported that the principles for thecanons of human body may have been defined by Egyptianartists, who divided the entire body into different parts andprovided baselines for their measurement. The importance ofanthropometric ratios/distances was preserved even during theRenaissance era. According to Da Vinci, in a well proportionedface, the size of the mouth equals the distance between theparting of the lips and the edge of the chin, whereas thedistance from chin to nostrils, from nostrils to eyebrows, andfrom eyebrows to hairline are all equal, and the height of theear equals the length of the nose [14].A historical appraisal of facial anthropometry from antiquityupto Renaissance has been provided in [15] to compare artists’concept of human profile. Flattened nose, tilted forehead andprominent upper lip were some of the features prevalent inRenaissance art works. In fact, prominent facial landmarks ofa person were retained in works of the sitter by different artistsas illustrated in Fig. 2.
3the ensemble. We choose di D (without replacement) tobe the number of features used in the ith classifier. For eachclassifier, we determine the match and non-match scores (asappropriate) using the di features as follows. We computedi01 Xsn (J, J ),sLF (I, I ) di n 10(2)0Fig. 2. Prominent facial landmarks such as pointed nose were retainedin works of the same sitter Nicolas Rolin by different artists Jan VanEyck and Rogier van der Weyden.B. Choice of FeaturesFrom the illustrations described above, it is clear that ancientRenaissance artists laid emphasis on two aspects in theirrenderings, which we use for our analysis.1. Local features: We use a set of 22 fiducial points torepresent each face, these being (1, 2) forehead tips (left,right), (3) forehead center, (4) chin bottom, (5) nose top, (6)nose bottom, (7, 8) points on temple (left, right), (9,10) chinear corners (left and right), (11, 12) points on chin (left andright), (13,14 ) cheekbones (left and right), (15, 16) mouthcorners (left and right), (17, 18) iris (left and right), (19, 20)left eye corners (right and left eye) and (21, 22) right eyecorners (right and left eye). The precise location of these pointsis determined by registering a generic mesh on the face. Gaborjets corresponding to 5 frequencies and 8 orientations areevaluated at each of these fiducial points. At a fiducial point nand for a particular scale and orientation j, the correspondingjet coefficient Jnj is given byJnj anj exp(iφnj ),where s(J, J ) is an average local feature similarity measurebetween n corresponding Gabor jets computed across salient0points in image pair (I, I 0 ). In order to compute sn (J, J ), weuse the normalized similarity measure mentioned in [4] givenbyP00j anj anj(3)sn (J, J ) qPP 022j anjj anjSimilarly, we compute anthropometric distance similarity between image pairs (I, I 0 ) using the equationsAD (I, I 0 ) e βy ,(4)where y is the 2D Euclidean distance between the AD vectorsm, n that characterize images I, I 0 respectively (we use onlythose distances as selected by the random subspace classifier)and β is a co-efficient that is chosen suitably to obtain adiscriminative dynamic range of values. In our experiments,we set β to be 5.In order to identify features that give the highest separationbetween match and non-match scores, we then compute theFisher Linear Discriminant function for each classifier. Wechoose the union of features from those classifiers that give thetop k Fisher Linear Discriminant values as our style features.(1)where anj is the magnitude and φnj is the phase.2. Anthropometric distances: All images are normalized withrespect to scale and orientation. A set of 11 salient distancesis used to represent each face, namely, (1) distance betweenforehead tips, (2) distance between forehead center and chinbottom, (3) distance between nose top and bottom, (4) distancebetween points on temples, (5) distance between chin earcorners, (6) distance between points on chin, (7) distancebetween iris, (8) distance between cheekbones, (9) distancebetween mouth corners, (10) width of nose, (11) distancebetween forehead center and nose bottom.C. Feature ExtractionDifferent artists are likely to depict and emphasize the aforementioned features in different ways. We wish to learn thosefeatures that are characteristic of an artist’s style. We employa method called the random subspace ensemble learning as itis capable of handling deficiencies of learning in small samplesizes [16]. Small sample sizes is very relevant to the presentproblem as we have very few works by an artist at our disposal(Sec 1). The random subspace method randomly samples asubset of the aforementioned features and performs trainingin this reduced feature space.More specifically, we are given Z training portrait pairs andD features. Let L be the number of individual classifiers inD. Importance of the Chosen FeaturesNot all features identified by the above method are equallyimportant in representing an artist’s style. In order to understand the importance of the chosen features, we consider thenon-parametric statistical permutation test [17]. Permutationtest helps in assessing what features are same across all theinstances belonging to an artist. Thus, features which are moreinvariant across the portraits by an artist can be perceived to bemore characteristic of that artist and hence be assigned greaterimportance. Permutation tests have been used to determineinvariant features in artworks [2].Permutation test: The null hypothesis (H0 ) is chosen toindicate that two portrait groups G1, G2 have the same averagevalue in a particular feature; the alternate hypothesis (H1 )indicates that the average value of that feature is different inthe two groups. Thus,H0 : µG1 µG2 ; H1 : µG1 6 µG2 ,(5)where µ is the average value of a particular feature v underconsideration in the two groups.If the null hypothesis is true, then it should not matterwhen this feature v is randomly assigned among images in thegroup. For instance, let us assume that there is a certain waythat the mouth corner is portrayed by Italian artist Bernini,whose works are included in our dataset. On an average, if
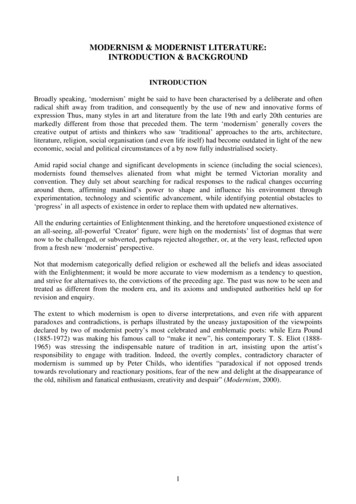
4this appearance is the same across all images by Bernini,then the principle behind this test is that there will not be asignificant difference if the mouth tips are randomly assignedacross images in the group, i.e., assigning the feature of onesitter to the corresponding feature of another sitter.Specifically, if there are Ns images by an artist Y , thenwe can divide these Ns images into 2 subgroups consisting ofNs1 and Ns2 images depicting different sitters. Let the featurevalues for the first group be [v1 , v2 , ., vNs1 ] and in secondgroup be [vNs1 1 , vNs1 2 , ., vNs2 ]. The permutation test isdone by randomly shuffling [v1 , ., vNs ] and assigning thefirst Ns1 values, [v(1) , v(2) , ., v(Ns1 ) ] to the first group andthe rest Ns2 values [v(N(s1 1) , ., v(Ns2 ) ] to the other group.For the original two groups we compute,NsNs1 X21 X1vi vNδ0 Ns1 i 1Ns2 i 1 s1 i(6)δ0 denotes the variation in the feature v by artist Y as exhibitedby various instances I1 , ., IN in the two groups G1 and G2.Thus, δ0 µG1 µG2 . For any two permuted groups wecomputeNs1δs N s21 X1 Xv(i) v(Ns1 i )Ns1 i 1Ns2 i 1(7)δs denotes the variation in the feature v by artist Y afterassigning v as depicted in Ii to an image not necessarilydepicting the sitter in Ii .We repeat this random shuffling of features among theimages under consideration multiple times. The proportionof times δs δo is the p value. This value reflects thevariation of the feature in the two groups. Smaller p denotesstronger evidence against the null hypothesis, meaning that thefeature differed considerably in the two groups and thus lesscharacteristic of the artist’s style. We compute p values foreach feature as described above. The computed p values areused as scaling factors (weights) in estimating the similarityscores (sp ) in equations (2) and (4). It is to be noted that thismethod can be employed when we have 12 images by anartist [21]; in cases where enough images/artist is not availableor when the artist is unknown, we use all the 22 LF and 11 ADfeatures with equal weight (of 1 assigned to all the features)in obtaining the LF/AD similarity scores.λ being varied from 0 to 1 in steps of 0.1.2. For every λ, we evaluate the mean and standard deviationof match and non-match scores using the RANSAC algorithm[18] to prune outliers.3. At each λ, we evaluate J SSwb where Sb is between classvariance and Sw is within class variance. We choose that valueof λ λopt that gives the maximum value of J. This isessentially computing the Fisher linear discriminant [20].Using the procedure described above, we compute similarityscores between portrait pairs that are known to depict samesitters and different sitters to get match and non-match scoresrespectively. The resulting set of match and non-match scores,computed across various artists and sitters, are modeled astwo Gaussians distributions (one for match scores and anotherfor non-match scores). The mean and standard deviations ofthese distributions are estimated from training data. We referto these match/non-match score distributions as the ”PortraitFeature Space” (PFS). Fig. 6 gives a pictoral representation ofthis.F. Validation of the Learned FeaturesWe wish to ascertain if the learned features are goodrepresentations of the portraits considered. To verify this, weperform two-fold cross validation of the similarity scores.1) Validation of Artist-Specific Similarity Scores: If thechosen features are robust representations of an artist Y , thenthe obtained match/non-match scores divided into two folds(groups), say A, B, should more or less be “similar” in thatthey come from the same artist. For this, we employ the SiegelTukey statistical test [23].Siegel-Tukey Test: This is a non-parametric statisticalmethod to test the null hypothesis (H0 ) that two independentscores come from the same population (e.g., artist) againstthe alternative hypothesis (H1 ) that the samples come frompopulations differing in variability or spread. Thus,2222H0 : σA σB, M eA M eB ; H1 : σA σBwhere σ 2 and M e are the variance and medians for the groupsA and B. The test is entirely distribution-free. The absenceof any normality assumption is an important feature of thetest, because its parametric alternative, the F test for variancedifferences, is quite sensitive to departures from normality[22]. The p value obtained from this test, pst , is given bypst Pr [X U ] ,E. Feature CombinationThe similarity scores obtained from LF and AD featuresmay not be equally important in determining the similaritybetween portrait pairs. Further since the number of LF/ADfeatures used are different, the scores need to be fused in a waysuch that the resulting distribution of match and non matchscores are as peaked and disjoint as possible. We employ thefollowing algorithm towards this.1. We consider a convex combination of the scores from thetwo measures LF and AD, i.e.,score λsLF (1 λ)sAD(8)(9)(10)where UA , UB are the U statistics for groups A, B and X Wilcoxon (r, m) [21]. This is a measure of the confidenceassociated with the scores. Thus, if the learned features aregood representations of an artist’s style, they should be associated with a higher pst value than the pst value associatedwith scores obtained using all features.2) Validation of PFS: In order to validate the PFS computed across various artists/sitters, we randomly divide theknown instances into two groups to perform two-fold crossvalidation. In fold 1, we use group one to learn the PFS anduse group 2 to validate and vice versa in fold 2. Ideally, thelearned PFS from the two folds should have the same statistics.
5IV. I DENTIFICATION F RAMEWORKThe goal of this work is to aid art historians by providingan alternate source of evidence in verifying uncertain portraitsagainst a reference image by providing a quantitative measureof similarity. We use hypothesis testing for this purpose.A. Hypothesis TestingThis is a method for testing a claim or hypothesis about aparameter in a population [19]. Below, we summarize it withrespect to the learned PFS.1. Null hypothesis claims that the match distribution accountsfor the test’s similarity score with reference better than nonmatch distribution. The alternate hypothesis is that non-matchdistribution models the score better.2. We set level of significance α, i.e., the test’s probabilityof incorrectly rejecting the null hypothesis, as 0.05, as perbehavioral research standard.3. We compute the test statistic using one independent nondirectional z test [19], which determines the number of standard deviations the similarity score deviates from the meansimilarity score of the learned match/non-match distributions.4. We compute p values which are the probabilities of obtaining the test statistic that was observed, assuming that the nullhypothesis is true. If p α, we reject null hypothesis.ReferenceMatchNon-matchp αp αp αp αp αp αp αp αp αp αDistractersMatchNon-matchp αp αp αp αNANANANAp αp αTABLE IConclusionMatchNo MatchNo decisionNo decisionNo decisionTABLE SHOWING HOW p VALUES ARE USED TO MAKE A DECISIONABOUT IDENTITY OF A PORTRAIT. NA STANDS FOR N OTA PPLICABLEB. Identity VerificationIn order to examine the validity of the chosen approach,we consider similarity scores of the test image with artworksknown to depict persons different from the one depicted inreference image. We call these images as distracters. In caseswhere enough works of the same artist is not available, weconsider similar works of other artists. If a test image indeedrepresents the same sitter as in the reference image, not onlyshould its score with the reference image be modeled by thematch distribution, but also its scores with distracter facesshould be modeled by the non-match distribution.Fig. 3. Illustration of the dataset across individual/multiple artistsdepicting different sitters.in the same way as in green rows of Table I, it can besaid that the learned PFS cannot accurately describe the testdata. If the match distribution is more likely to account forboth test as well as distracters (magenta row in Table I),it can be inferred that the chosen features do not possesssufficient discriminating power to prune outliers. Thus in thesescenarios, it is not possible to reach any conclusion.V. DATASETChoice of Images: We have employed a set of imagesbelonging to Western Europe between 15th and early 18thcentury. These images have been logically chosen by arthistorians in order to address different tasks such as (a) totest the relation of an unmediated image of the subject, e.g.,a death mask to a work of portrait art like a painting, (b) toanalyze a number of portraits of different sitters by the sameartist to model artist’s style, (c) to verify if the identity of theambiguous subject in a given image is same as that of a knownsubject in a reference image. The images belong to differentmedia such as drawings, prints, paintings, sculptures, deathmasks, etc. The dataset consists of works by over 35 artistssuch as Bernini, Algardi, Clouet, etc.Description: The dataset consists of about 271 imageswhere the identity of the subject is known beyond doubt. Thereare 20 test paradigms (with each having multiple image pairsto be compared) where the identity of the subject is in questionand has to be compared against the reference image given inthat paradigm. Table II provides a detailed description of thedistribution of images in terms of the specific sitter and artist.Fig. 3 provides an illustration of the dataset. Please refer tothe supplementary material for a description of the sources forthe portraits illustrated throughout this paper.VI. E XPERIMENTSC. Analysis ScenariosA. Style Modeling ResultsFollowing the procedure outlined earlier, we compute similarity scores of test cases with corresponding reference imageand with distracters. Table I lists various hypothesis testscenarios that can arise [19] and the corresponding conclusionsthat one can infer. Match and non-match cases are straightforward to infer from Table I. In cases where both match andnon-match distributions are likely to account for the scoreWe first extracted the 22 LF and 11 AD features for allthe images. For those artists where we had enough imagesto model their style, we learned the features characteristic oftheir style. Top part of Fig. 4 depicts characteristic LF withdots denoting the relative importance of the feature as perthe p value of permutation test. AD features representativeof the style was similarly determined for these artists; these
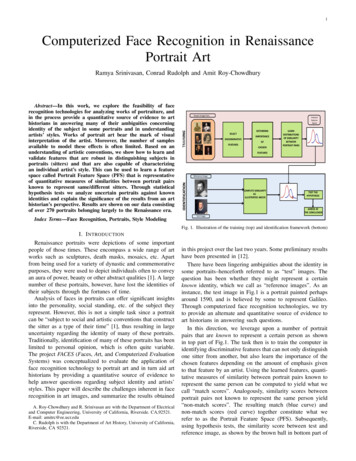
ianoCafaCampinClouetda FiesoleDa VinciDe ChampaigneDe BenintendiDel CastagnoDella FrancescaVasariGhirlandaio# elliSittowStringaThronhillTorrigianoVan MiereveltVan MusccherVerrocchio# Images6345191103455443124186TABLE III LLUSTRATION OF IMAGE DISTRIBUTION : N UMBER OF IMAGES PERARTIST.Fig. 5. ROC curve for pairwise sitter validation upon using stylefeatures.Significance of Style Modeling: These results could possiblyaid art historians in attributing works to an artist that was notattributed to him/her before. Further, it could also help in identifying unrecognized portraits by these artists more confidently.It might also be possible to understand the adherence to artisticcanon and individual variations in art practices.Fig. 6. PFS showing the distribution of match and non-match scoresalong with their standard deviations.Fig. 4. Top: Importance of chosen features with bigger dots indicatingmore important features; Bottom: Validation of style through SiegelTukey testbeing AD features 4,8,3,7,2 for Algardi ( Please see Sec IIIB for description of numbers), 1, 10, 7, 5,8 for Bernini, ADfeatures 2, 1, 8, 9, 10, 5, 4 for Kneller, 5, 11, 2, 7 for Clouet,4, 6, 11, 7, 3 for Mierevelt and 2, 8, 11, 3 for Holbein.Features are listed in decreasing order of importance for eachartist. We verified the validity of these features using thepst value computed from Siegel-Tukey test. As illustrated inbottom part of Fig. 4, for almost all cases, the confidenceof the similarity scores increased upon using only the stylefeatures, thus validating the chosen LF. Similar results wereobtained for AD features. It is to be noted that the SiegelTukey test validates both style-specific match and non-matchscores; wherever there are not enough images to obtain matchscores, only the available non-match scores are validated. Thereceiver operating characteristic (ROC) curve shown in Fig. 5compares the performance for pair-wise sitter validation uponusing (a) style features (b) all LF/AD features. The ROCdemonstrates the improvement in pairwise validation uponusing style features.B. Validation with Known SittersFrom the set of known identities, we obtained match andnon-match scores. It is to be noted that wherever an artist’sstyle could be modeled, we used only those (weighted) features in obtaining the LF/AD similarity scores and otherwiseused all the LF/AD features followed by the feature combination strategy to fuse the similarity scores. The weight forLF feature was found to be 0.55 and that for AD featureswere 0.45. Experiments showed that there was improvementin the performance upon fusing scores from LF and AD asagainst using any one of them. The values of mean of PFSwere 0.7246 (match) and 0.5926 (non-match) with standarddeviations 0.043 and 0.052 respe
A portrait is a visualization of an artist’s aesthetic sensibil-ities blended with the sitter’s personality. We therefore begin by understanding the relevant features for analysis based on a study of artistic trends during the period under study. A. Face as Seen by Artists It is evident from