Transcription
HANDBOOK ONAgricultural Cost ofProduction StatisticsGuidelines for Data Collection, Compilation andDisseminationPublication prepared in the framework of the Global Strategy to improve Agricultural and Rural Statistics
Cover photo: FAO/Olivier Asselin FAO/Olivier Asselin FAO/Ahmed Ouoba
HANDBOOK ONAgricultural Cost ofProduction StatisticsGuidelines for Data Collection, Compilation andDisseminationFebruary 2016
ContentsAcronymsviPrefaceviiAcknowledgementsviii1. Purpose12. Uses and benefits of cost of production statistics32.12.22.32.42.5IntroductionFor farmers and agricultural marketsFor policy-makers and governmentsFor the System of National AccountsFor research3368103. Statistical outputs, indicators and analytical omic indicators153.4.2Environmental indicators16Indicators and statistical tables: some country examplesDissemination and interpretation of statistical outputs and indicators3.6.1 Coping with the variability in cost of production statisticsEnsuring and measuring quality in cost of production statisticsSummary and recommendations4. Considerations for data collection4.14.24.34.413IntroductionDifferent dimensions of production costsNormalizing the analytical unitIndicators and statistical tables172020212225IntroductionData collection vehicles25264.2.1General considerations264.2.2Surveys274.2.3Typical farm approaches334.2.4Choosing among the data collection approaches364.2.5Other sources of data37Additional design considerations384.3.1Unit of observation384.3.2Data collection mode414.3.3Commodity scope414.3.4Geographical scope424.3.5Frequency and timing424.3.6Data Collection errors43Costs of data collection444.4.1Agricultural censuses and farm surveys444.4.2Typical farm approaches444.4.3Administrative sources454.4.4Approaches to reduce the cost of data collection45iii
5. Guidelines for data collection and asic principlesAllocating joint costs to specific activities4747505.3.1Importance and scope505.3.2Allocation methods51Estimating the cost of variable inputs565.4.1Fertilizers565.4.2Plant protection products585.4.3Planting material (seed)585.4.4Animal feed595.4.5Other purchased expenses60Estimating the cost of capital goods5.5.1 Consumption of fixed capital (depreciation costs)5.5.2 Opportunity cost of capital5.5.3 Owning vs. renting capital assetsLabour costs5.6.1 Hired labour5.6.2 Unpaid labourCustom operationsLand costsPreproduction costs5.9.1 Case 1: production occurs entirely in a given year5.9.2 Case 2: production extends over several years5.9.3 Allocation of revenues and associated costs from joint products5.9.4 Allocation of input costs for intercropping or mixed cropping systems6. Disseminating and presenting data on cost of production6.16.26.36.447Principles to guide disseminationQuality assessmentFrom data to disseminationDesigning tables606164666768707375777878818183838586877. evel data collection questionnairesSample designsSampling variances for simple and complex sample designsSynthesis of the responses to the 2012 survey on country practicesGlossary959698100101iv
BOXES2.13.14.14.24.35.15.2Costs of ill-designed policies: the example of the maize price scheme in ZambiaConstruction of farm typologies – The example of MoroccoOmnibus and stand-alone surveys on cost of production: country examplesSurvey design – lessons from the experience of IndonesiaThe choice of unit of observation: some country examplesAllocation of joint costs in the Philippines: an exampleUnpaid labour costs using econometric estimation7212930405272FIGURES2.1 Sequence of national accounts and importance of cost of production statistics3.1 Different dimensions and segmentations of cost of production4.1 Different steps of a data collection programme and their linkages5.1 Inputs to be allocated for crops, livestock and mixed activities9142651GRAPHS2.1 Regional cumulative distribution of milk operating and ownership costs, 20002.2 Net returns for Irrigated and Non-irrigated palay in the Philippines, 20122.3 Net returns for Irrigated and Non-irrigated palay in the Philippines, 20122.4 Cost structure for different commodities in the Philippines, 20125.1 Share of labour in total production costs for different crops (Philippines, 2012)5.2 Share of rental services in total cash costs (Philippines, 2012)5.3 Net returns with allocated establishment costs (USD per ha in nominal 2Maize production costs (ZMK/50kg bag) by quintileCosts and returns for palay (Philippine pesos) – ExtractsCorn production costs and returns per planted acre in the United States, 2011-2012List of inputs, allocation methods and associated assumptionFeed prices in nominal and end-of-period pricesLabour costs by type and activityPre-production costs for 20 hectares of cocoa plantationUnited States corn production costs and returns per planted acre, excluding governmentpayments in USD, 2013-2014Average production costs and returns of corn in the Philippines (January-June 2013)v171819556072808990
AMACONAASNFBSNSOPHSSNAUNSCUSDAWCAZMKAustralian Bureau of Agricultural and Resource Economics and SciencesAfrican Commission on Agricultural StatisticsAsia and Pacific Commission on Agricultural StatisticsAgricultural Resource Management SurveyBureau of Agricultural StatisticsBureau for Food and Agricultural PolicyCost of Cultivation of Principal Crops SurveysCrop Forecasting SurveyCompañía Nacional de AbastecimientoCost of ProductionCosts and Returns SurveyCentral Statistical OfficeDirectorate of Economics and Statistics in the Ministry of Agriculture of IndiaDepartment for International Development of the United KingdomEconomic Research ServiceEuropean System of National and Regional AccountsFAO Statistics DivisionEuropean Union Farm Accountancy Data NetworkFood and Agriculture Organization of the United NationsFarm Costs and Returns SurveyZambian Food Reserve AgencyFarm Record Keeping ProjectIndonesian Cost of ProductionInteramerican Institute of Cooperation on AgricultureZambian Ministry of Agriculture and CooperativesUnited States National Agricultural Statistics ServiceNational Food Balance SheetsNational Statistics OfficePost-Harvest SurveySystem of National AccountsUnited Nations Statistical CommissionUnited States Department of AgricultureFAO World Programme for the Census of AgricultureZambian Kwachavi
PrefaceThis version of the Handbook on Agricultural Cost of Production Statistics was prepared under the aegis of theGlobal Strategy to Improve Agricultural and Rural Statistics (Global Strategy), an initiative endorsed by the UnitedNations Statistical Commission in 2010. The Global Strategy provides a framework and a blueprint to meet currentand emerging data requirements of policy-makers and other data users. Its goal is to contribute to greater foodsecurity, reduced food price volatility and higher incomes, and improve the well-being of agricultural and ruralpopulations through evidence-based policies. The Global Action Plan of the Global Strategy is centred on threepillars: (1) establishing a minimum set of core data; (2) integrating agriculture in the national statistical system(NSS); and (3) fostering sustainability of the statistical system through governance and statistical capacity-building.The Action Plan to Implement the Global Strategy includes an important research programme to addressmethodological issues for improving the quality of agricultural and rural statistics. The outcome of the programmeis scientifically sound and contains cost-effective methods that are used as inputs to prepare practical guidelines foruse by country statisticians, training institutions and consultants, among others.Economic performance indicators for agriculture are a fundamental requirement for improving market efficiencyand decision-making. Statistics on agricultural costs of production have historically been among the most usefulof such indicators.This Handbook presents guidelines and recommendations for designing and implementing a statistical program oncost of production (CoP) in agriculture at the country level. It takes into account experiences from countries withexisting programmes and findings of a recent review of relevant academic and policy literature. It acknowledgesthat countries differ with respect to their statistical infrastructure and their objectives, creating country-specificchallenges. This Handbook may serve as a useful reference tool for agricultural statisticians and economists to buildon or to adapt existing programmes for estimating agricultural costs of production, and for analysts to understandthe nature and limitations of data from which final indicators are derived.In addition to outlining a standard methodology, the Handbook also provides practical and context-specific guidancefor countries on cost-efficient ways to produce high-quality and internationally comparable agricultural CoP statistics.The Handbook has been updated with results from in-country field tests and based on feedback and experiences ofcountries. This Handbook is published under the Handbook and Guidelines Series.vii
AcknowledgementsThis publication makes direct use of text from a number of sources, in particular the Task Force Report onCommodity Costs and Returns Estimation Handbook of the American Agriculture Economics Association from theUnited States Department of Agriculture (USDA, 2000) and various methodological reports from national statisticalagencies on CoP programmes. References used are listed at the end of the Handbook. It is worth noting that the term“cost of production” is not universal, with some countries using instead “cost of cultivation”, “agricultural resourcemanagement” or “agricultural costs and returns”.The Handbook was the subject of several workshops and meetings held between 2011 and 2015. The recommendationsfrom these sessions were presented to and approved by the African Commission on Agricultural Statistics (AFCAS),held in Ethiopia in 2011, and in Morocco in 2013; the Asia and Pacific Commission on Agricultural Statistics(APCAS), held in Vietnam, in 2012, and in the People’s Republic of Laos, in 2014; the FAO and the Inter-AmericanInstitute of Cooperation on Agriculture Working Group on Agricultural and Livestock Statistics for Latin Americaand the Caribbean, held in Trinidad and Tobago in 2013; and expert group meetings, held in Rome in 2013 and 2015.FAO would also like to acknowledge the Global Strategy to Improve Agricultural and Rural Statistics for financingthis work. The preparation of this publication was supported by the Trust Fund of the Global Strategy, funded by theDepartment for International Development (DFID) of the United Kingdom and the Bill & Melinda Gates Foundation.The Handbook was prepared by Peter Lys, Senior Consultant, and Franck Cachia, Associate Statistician at FAO’sStatistics Division (ESS) from 2011 to 2014, under the guidance of Sangita Dubey and Carola Fabi, SeniorStatistician and Statistician, respectively, in ESS.The Handbook would not have been possible without the invaluable advice, examples and suggestions given byvarious experts, including Jacques Delincé (Joint Research Centre of the European Union), Mohammed Kamili(Morocco), William McBride (United States), Romeo Recide (Philippines), Yelto Zimmer (Germany), VikasRawal (India) and experts from the Directorate-General for Agriculture and Rural Development of the EuropeanCommission. Special thanks are also extended to Josef Schmidhuber, Deputy Director of ESS, who guided theproject at its inception, and to the various experts within FAO, too numerous to mention, who contributed theirideas and suggestions.The most significant contributors, however, remain the many countries that had requested such a handbook,without whom this project would not have begun, and who remain the litmus test as to its value and relevance.In this regard, the authors would like to thank Colombia, Tunisia and the Philippines, the three countries chosenfor the field tests, for sharing information on their respective statistical programmes and for their very relevantcontributions to the handbook.Norah de Falco (FAO) coordinated the design and communication aspects. The document was edited by Alan Cooperand laid out by Ane Louise Gaudert.viii
1PurposeThe Handbook on Agricultural Cost of Production Statistics, referred henceforth as the Handbook, aims to providenational statistical organizations (NSOs) and Agriculture Departments with a “how to” guide for the collection,compilation, and dissemination of CoP data. It is especially aimed at developing countries, which requested thisdocument and actively contributed to its preparation.This publication is meant to complement work already undertaken in the area of national statistics. Concurrentwork underway in other areas of the Global Strategy is not covered in this Handbook, but nonetheless, needs tobe considered as integral to the overall system of improving agriculture statistics. In particular, items that shouldbe considered when applying recommendations within this Handbook and taken from the Action Plan include thefollowing: Guidelines for statistical laws, confidentiality issues, and the establishment of national statistics; Guidelines to meet regional specificities; Statistical legislation to reflect the integration of agriculture into the national statistical system; Guidelines and practices for the development of a master sampling frame; Guidelines for sample design based on good practices and research findings; Technical standards and guidelines to produce statistics on crop area and yield, livestock and poultry, prices andtrade, employment and labour, land use, and fishery and forestry production; Technical standards and guidelines for the coordination of agricultural censuses with population censuses; and Dissemination standards.This Handbook is structured as follows: the second chapter presents the main uses and users of statistics on CoP;the third chapter focuses on the statistical outputs that can be expected from a programme on production costs; thefourth chapter provides the necessary general considerations on data collection methods, including, among them,surveys and censuses; the fifth chapter constitutes the core of this publication as it presents in detail the differentrecommended methods to compute the cost for the different items, such as cash and non-cash inputs, labour, land andcapital; the sixth chapter provides general recommendations on how the data should be presented and disseminated,in accordance with international guidelines on the topic; and the seventh and final chapter concludes with a summaryof the objectives of the Handbook and the process involved in drafting it.1
2
Uses and benefits of cost ofproduction statistics22.1 INTRODUCTIONA sound statistical CoP programme improves the data and information base for a wide range of issues related to farmoperations, including farm accounts’ data on farm cash receipts and farm expenses, net and gross farm incomes, andthe degree to which farms are capitalized. It also provides information on farm profitability, household food securityand the myriad forms of farm labour, such as hired and self-supplied labour by gender and age group.As in any data collection programme, collecting and processing CoP data comes at a price, which varies considerablydepending on the intended uses and users of the data and on the data collection methodology adopted. A classicfeature of statistical programmes is the asymmetry between costs, which are generally easy to measure and incurred inthe short term, and benefits, which are often intangible, difficult to measure and incurred in the medium to long term.This section strives to identify and quantify the benefits from more complete, accurate and internationally comparableCoP statistics for the different users of this information. It also gives an indication of the costs of collecting andcompiling this data which vary greatly depending on approaches and methodologies used.2.2 FOR FARMERS AND AGRICULTURAL MARKETSCost of production statistics generally only benefit the data suppliers indirectly through improved policy-making,better administrative decisions and more efficient markets. However, there is also potential for the data supplier,namely the farmers themselves, to reap direct benefits.At the farm level, CoP data contributes to improve the economic assessment of farm operation. They allow theproducer to question his own operation and to benchmark it against the best practices of farms in the same regionwith similar characteristics. This, in turn, can lead to better informed decisions at the farm-level and improvedmarket efficiency and performance. Some specific examples of how a robust CoP programme can be used at thefarm level are as follows: Enterprise mix decisions: analysis can illustrate which farm enterprise (commodity) is positively contributingto the whole farm financial picture and lead to reallocation between enterprises, as appropriate.3
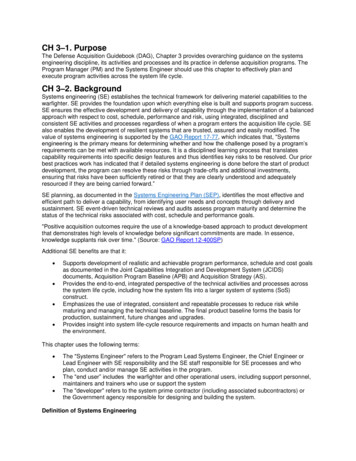
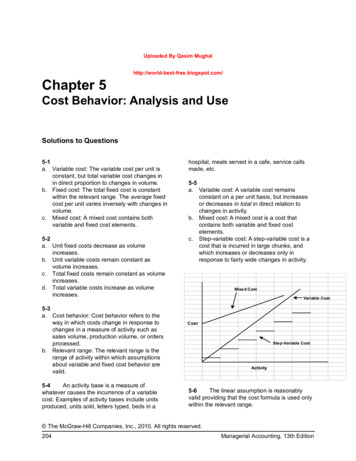
Purchasing and marketing decisions: pricing targets for inputs and outputs can be set at different cost break-evenlevels. Knowing the break-even points allows farmers and policy-makers to take advantage of growing, buyingor selling opportunities when they arise. The following formulas can assist in determining break-even points. Break-even price to cover variable costs (or gross margin): Total variable costs expected yield USD/unit produced. This is the minimum price needed to cover variable costs Break-even price to cover total costs (or net margin): Total costs expected yield USD/unit produced.This is the minimum price needed to cover all costs. Break-even yield: Total costs/expected price unit produced (minimum yield required to cover all costs).Investment decisions: Making the right investments in capital assets, such as land, machinery and buildings, iscritical to long-term success. CoP information shows the amount the farm can afford to pay for those assets. Itis useful when conducting reviews of investments in enterprises that fail to meet total costs in the long run anddetermining where to redirect resources to more profitable enterprises.Cost of production statistics provide farm extension workers with evidence to support their training and outreachactivities, which helps evaluate an individual farm’s management practice against norms for the region. It also allowsbetter targeting to the largest payoffs for their activities, which, in turn, elevates productivity.Cumulative distribution curves on CoP provide an example of direct use by farmers of such data for benchmarkingpurposes. Farmers can use these graphs to compare, for example, their holding against holdings of a similar type.An illustration is provided below for the United States of America. Graph 2.1 presents data on the cumulativedistribution of CoP for dairy farms in different regions of the United States. Using this graph enables individualfarmers to compare, for instance, the costs of their production with median CoP for dairy products in the UnitedStates (about 10 USD/cwt1 that is COP of the typical farm in the Fruitful Rim-West region), as well as any otherdairy farm spending between 20 and 80 percent of the total dairy CoP in the country.GRAPH 2.1Regional cumulative distribution of milk operating and ownership costs, 2000Source: Short 20041 Cwt, also known as a hundredweight, is a unit of measure used in the trading contracts of certain commodities in North America. It equals100 pounds.4
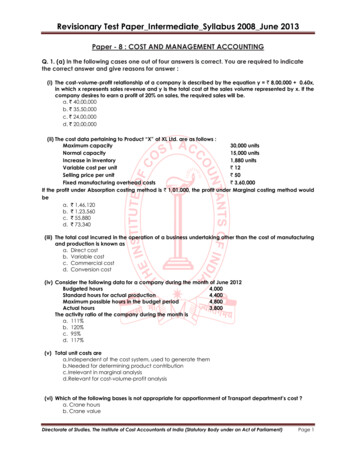
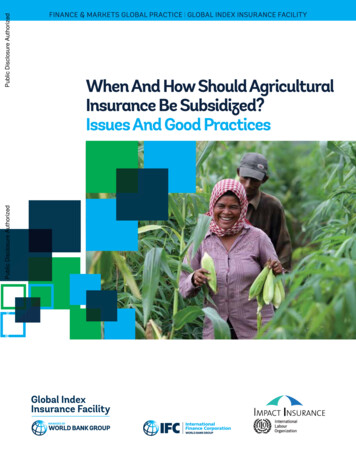
Farm-level CoP data enable farm analysts, be they managers, outreach agents or policy analysts, to assess the effectof farm management decisions on farm efficiency, income and profitability, and advise farmers accordingly. Forexample, farm analysts can assess the impact of choices regarding the amount and type of variable inputs used,such as fertilizers or pesticides; the type of irrigation method implemented and the amount and type of capitaland technology purchased. This, in turn, allows farmers to understand better how to improve the efficiency andprofitability of their operations.Graph 2.2 illustrates differences in profitability for a given commodity, palay, in two different cultivation schemes,irrigated and non-irrigated. This type of analysis is potentially useful for farmers in determining investments inirrigation as it enables them to weigh the costs and benefits of such investments. However, it is only effective ifdetailed and accurate information on costs and revenues for the different types of operations are available andconsidered.GRAPH 2.2Net returns for Irrigated and Non-irrigated palay in the Philippines, 2012Ph. Pesos / ha2500020000150001000050000Irrigated PalayNon-Irrigated PalaySource: Authors, based on data from CountryStat Philippines, 2014.Finally, more complete and accurate statistics on CoP benefit sectors that provide services to farmers and to theagricultural sector in general, such as banking, insurance and agricultural machine lessors. Improved data on costsand returns facilitate more accurate assessments of financial risks associated with agricultural production, reducingsome of the asymmetric information that causes banks and insurers to set high service prices and/or tight supplyconditions in sectors, such as agriculture, which are characterized by high risks and adverse selection. Furthermore,through the ability to assess a potential farm borrower against the distributional norms in terms of costs of andreturns to production, the financial sector is equipped to better design and target financial products to farmers’ needsat lower prices. The end result of improved access to financial credit by creditworthy farmers may, in turn, increaseefficient investments in agriculture, resulting in higher agricultural output and productivity.5
2.3 FOR POLICY-MAKERS AND GOVERNMENTSCost of production information is effectively used by policy-makers to improve the targeting and efficiencyof agricultural policies. More complete data are needed to appropriately understand the underlying processesthat influence the output and productivity of this sector, and how these processes are affected by new policiesand regulations. For example, accurate CoP data allow a more precise determination of price formation and,therefore, assist both input and output price setting, such as the level and volume of price subsidies to farmers.These derived benefits are compounded by the fact that agriculture is a major direct and indirect contributor tomany national economies, especially in the developing world. As agriculture is intertwined with households inmuch of the developing world, this data can help in determining income measures and support anti-poverty andfood security policies.In countries where price supports, investment aid, or import and export decisions are critical, having reliable andaccurate CoP data helps to reduce the risk of overpaying or overspending for those programmes. Narrowing therange for income and price support typically reduces overpayments to such an extent that the survey programme canbe funded out of better designed programmes. A clear example of this is the mismatch between the prices offered tofarmers by the Zambian Food Reserve Agency (FRA) each year, and the actual distribution of costs across farmers,which results in significant overspending (Box 2.1). This example is an elaboration based on Burke et al. (2011).Obtaining accurate return measurements for different crops and different types of production technologies areessential in designing public policies aimed at fostering greater efficiency in agricultural production. Graph 2.3illustrates the net returns for peanut production in the Philippines, and how such returns have steadily increasedsince 2000. Public measurements in the agricultural sector, such as tax incentives, subsidies and minimum prices,can be adjusted and assessed effectively, based on this type of indicator.6
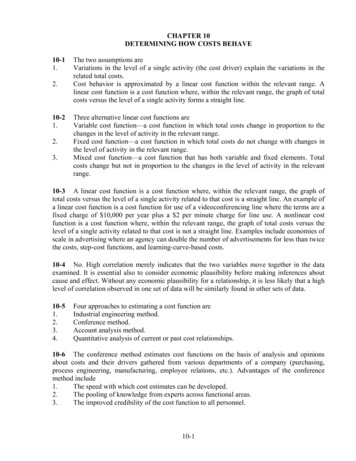
BOX 2.1Costs of ill-designed policies: the example of the maize price scheme in ZambiaIn 2009 and 2010, the buying price offered by the Zambian Food Reserve Agency (FRA) for maize was65,000 Zambian kwacha (ZMK) per 50 kg bag of maize grain, though 86 percent of farmers actuallyproduced the crop at a lower cost (the mean CoP was 40,739 ZMK) (Burke et al. 2011). This is illustratedby the figure below, which displays the distribution of costs across farms and compares it with theFRA-buying price.The figure also provides an indication of the overspending generated by the scheme because of theexisting buying price. Taking the average production cost of 40,739 ZMK as the new buying price,the overspending of the scheme is represented on the figure by the shaded grey area. This area canbe approximated by decomposing it into a rectangle and a squared triangle. This results in a slightoverestimation, given that the curvature of the function is neglected. Using this approach, the cost orover spending is estimated at approximately USD 107 million for one year of the total scheme (see thetable below for details). Of course, a different buying price could have been chosen leading to differentestimates, but this example only intends to provide an illustration of the magnitude of the recurrent anddoes not attempt to present perfectly accurate estimate.Estimations of over spending in the maize price scheme in Zambia, in USDIn USD*50 kg bagMillion MTQuantities (Million MT)Buying price FRA14.3285,714 (A)2.06 (C)New buying Price9.0179,073 (B)1.6 (D)In USD*B*( C- D)(A-B)*(C-D)/2TotalOverspending (implicit cost)USD 82,373,363USD 24,527,604USD 106,900,967**Assumption: 1 USUSD 4550 ZMK in 2010Distribution of maize production costs vs. official buying price in ZambiaSource: authors, Burke et al.7
Obtaining accurate return measurements for different crops and different types of production technologies areessential in designing public policies aimed at fostering greater efficiency in agricultural production. Graph 2.3illustrates the net returns for peanut production in the Philippines, and how such returns have steadily increasedsince 2000. Public measurements in the agricultural sector, such as tax incentives, subsidies and minimum prices,can be adjusted and assessed effectively, based on this type of indicator.GRAPH 2.3Net returns for Irrigated and Non-irrigated palay in the Philippines, 2012Source: Authors, based on data from CountryStat Philippines, 2014.2.4 FOR THE SYSTEM OF NATIONAL ACCOUNTSA properly designed national CoP data programme is a required source of information to improve the measurementof intermediate consumption by different agricultural activities and, therefore, their economic value-added. This, inturn, benefits the entire System of National Accounts (SNA) through a more accurate description of the economy anda better measure of its total value-added. Furthermore, data on CoP are necessary to construct a proper sequence ofeconomic accounts for agriculture (satellite accounts for agriculture), which, in turn, provide a detailed descriptionof the formation of value-added in a sector that is unavailable in the broader SNA. Figure 2.1 illustrates this sequenceof accounts.8
FIGURE 2.1Sequence of national accounts and importance of cost of production statisticsProduction Account -Net value addedWagesSubsidies on productionTaxes on productionBalanceNet Operating SurplusOperating Account Intermediate consumptionProductionConsumption of fixed capitalBalanceNet value-addedIncome account -Net operating surplusInterest chargesRental expensesBalanceNet Income of the FarmSource: Authors, 2014.Finally, the cost estimation of each of the main agricultural activities requires detailed data on input uses and costsby activity. These technical coefficients2 can be used to construct input-output matrices, which constitute a powerfultool of analysis to better understand the linkages between different agricultural activities and between agriculturalactivities and the rest of the economy.Graph 2.4 provides an example of cost structure for the production of different commodities. On this basis, technicalcoefficients can be calculated and input-output matrices combined. For example, the purchase of fertilizers forthe cultivation of onions is recorded as an input (intermediate consumption, in national accounting terms) of theagricultural sector and as an output of the chemical industry, which manufactures fertilizers. Products may alsoappear both as inputs and outputs of the same sector, as in the case of seeds, which are purchased, but are alsoproduced by farmers.2 Amount of input per unit of output.9
GRAPH 2.4Cost structure for different commodities in the Philippines, rFuel and oilRepairsLandDepreciaGonSeedsSource: Authors, based on data from CountryStat Philippines, 2014.2.5 FOR RESEARCHA CoP data programme can also support research on a variety of issues concerning commodity production. In theUnited States, where the CoP data programme dates back to the 1970’s, those data have been used to study issuespertaining to the structure and productivity of commodity production, and the adoption of production practicesand technologies among commodity producers. In this section, a few examples of the research generated from theUnited States data programme are presented. Undertaking research about commodity issues important to individualcountries is a way to increase the return to the often costly and time-consuming process of CoP data collection andprocessing, especially when
FAO would also like to acknowledge the Global Strategy to Improve Agricultural and Rural Statistics for financing this work. The preparation of this publication was supported by the Trust Fund of the Global Strategy, funded by the Department for International Development (DFID) of the Un