Transcription
UNIT-I INTRODUCTION
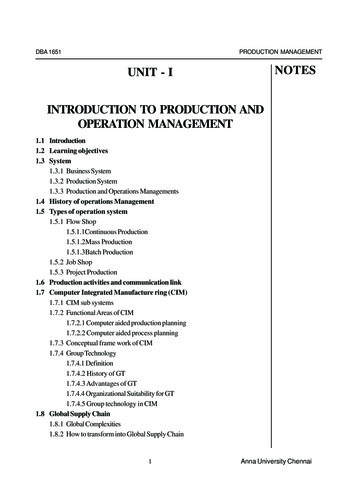
Virtual Instrumenation-IntroductionVirtual Instrumentation is the use of customizable software andmodular measurement hardware to create user-defined measurementsystems, called virtual instruments.SoftwareComputerHardware
The technology of Virtual Instruments (cont.) Advantages of Virtual Instruments versus TraditionalInstrumentsFlexibilityYou can easily add additional functions such as a filter routineor a new data view to a virtual instrument.StorageToday's personal computers have hard disks that can storedozens of gigabytes which is an absolute plus if you want toprocess mass data like audio or video.DisplayComputer monitors usually have better color depth and pixelresolution than traditional instruments. Also you can switcheasily between different views of the data (graphical,numerical).
What is Virtual Instrumentation?Virtual instrumentation combines mainstream commercial technologies.such as C, with flexible software and a wide variety of measurementand control hardware, so engineers and scientists can create userdefined systems that meet their exact application needs. With virtualinstrumentation, engineers and scientists reduce development time,design higher quality products, and lower their design costs.
Why is Virtual Instrumentation necessary?Virtual instrumentation is necessary because it deliversinstrumentation with the rapid adaptability required for today’sconcept, product, and process design, development, anddelivery. Only with virtual instrumentation can engineers andscientists create the user-defined instruments required to keepupwiththeworld’sdemands.The only way to meet these demands is to use test and controlarchitectures that are also software centric. Because virtualinstrumentation uses highly productive software, modular I/O,and commercial platforms, it is uniquely positioned to keeppace with the required new idea and product development rate
The technology of Virtual InstrumentsVirtual Instrumentation is the use of customizable software andmodular measurement hardware to create user-defined measurementsystems, called virtual instruments.ComputerSoftwareHardware
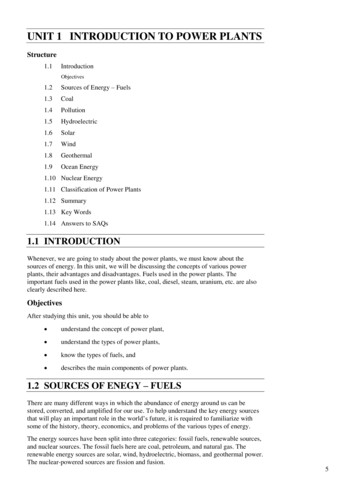
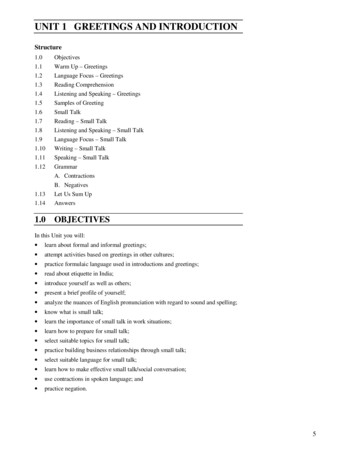
What is a virtual instrument and how is it differentfrom a traditional instrument?Every virtual instrument consists of two parts – software andhardware. A virtual instrument typically has a sticker pricecomparable to and many times less than a similar traditionalinstrument for the current measurement task.A traditional instrument provides them with all software andmeasurement circuitry packaged into a product with a finite list offixed-functionality using the instrument front panel. A virtualinstrument provides all the software and hardware needed toaccomplish the measurement or control task. In addition, with avirtual instrument, engineers and scientists can customize theacquisition, analysis, storage, sharing, and presentation functionalityusing productive, powerful software.
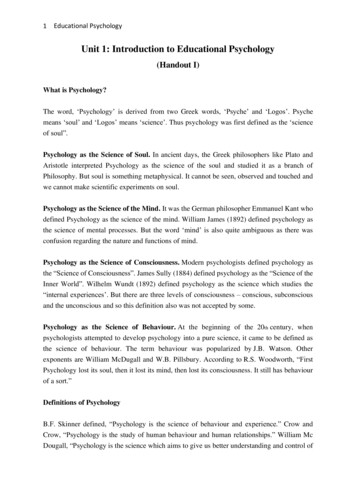
Traditional instruments (left) and software based virtual instruments (right) largelyshare the same architectural components, but radically different philosophies
OneApplication-DifferentDevicesFor this particular example, an engineer is developing anapplication using LabVIEW and an M Series DAQ board on adesktop computer PCI bus in his lab to create a DC voltage andtemperature measurement application. After completing thesystem, he needs to deploy the application to a PXI system on themanufacturing floor to perform the test on new product.Alternatively, he may need the application to be portable, and sohe selects NI USB DAQ products for the task. In this example,regardless of the choice, he can use virtual instrumentation in asingle program in all three cases with no code change needed.
Virtual Instrumentation for Industrial I/O andControl PCs and PLCs both play an important role in control andindustrial applications. PCs bring greater software flexibilityand capability, while PLCs deliver outstanding ruggedness andreliability. But as control needs become more complex, there isa recognized need to accelerate the capabilities while retainingthe ruggedness and reliabilities. Multi domain functionality (logic, motion, drives, and process)– the concept supports multiple I/O types. Logic, motion, andother function integration is a requirement for increasinglycomplex control approaches. Software tools for designing applications across severalmachines or process units – the software tools must scale todistributed operation.
Virtual Instrumentation for Design The same design engineers that use a wide variety of softwaredesign tools must use hardware to test prototypes. Commonly,there is no good interface between the design phase andtesting/validation phase, which means that the design usuallymust go through a completion phase and enter atesting/validation phase. Issues discovered in the testing phaserequireadesign-phasereiteration.
On which hardware I/O and platforms does virtualinstrumentation software run? Standard hardware platforms that house the I/O are important to I/Omodularity. Laptop and desktop computers provide an excellentplatform where virtual instrumentation can make the most of existingstandards such as the USB, PCI, Ethernet, and PCMCIA buses. for example, USB 2.0 and PCI Express
Layers of Virtual Instrumentation Application Software: Most people think immediately of theapplication software layer. This is the primary developmentenvironment for building an application. Test and Data Management Software: Above the applicationsoftware layer the test executive and data managementsoftware layer. This layer of software incorporates all of thefunctionality developed by the application layer and providessystem-wide data management. Measurement and Control Services Software: The last layer isoften overlooked, yet critical to maintaining softwaredevelopment productivity.
Advantages of Virtual Instruments versusTraditional InstrumentsFlexibilityYou can easily add additional functions such as a filter routineor a new data view to a virtual instrument.StorageToday's personal computers have hard disks that can storedozens of gigabytes which is an absolute plus if you want toprocess mass data like audio or video.DisplayComputer monitors usually have better color depth and pixelresolution than traditional instruments. Also you can switcheasily between different views of the data (graphical,numerical).CostsPC add-in boards for signal acquisition and software mostlycost a fraction of the traditional hardware they emulate.
Dataflow Programming Block diagram executesdependent on the flow of data;block diagram does NOTexecute left to right Node executes when data isavailable to ALL inputterminals Nodes supply data to all outputterminals when done
Help OptionsContext Help Online help Lock help Simple/Complex Diagram help Ctrl HOnline reference All menus online Pop up on functions in diagram to access online infodirectly
Graphical programming in dataflowLabVIEWLabVIEW is a graphical programming language that uses iconsinstead of lines of text to create applications. In contrast to textbased programming languages, where instructions determineprogram execution, LabVIEW uses dataflow programming, wherethe flow of data determines execution order.You can purchase several add-on software toolkits for developingspecialized applications. All the toolkits integrate seamlessly inLabVIEW. Refer to the National Instruments Web site for moreinformation about these toolkits.LabVIEW also includes several wizards to help you quicklyconfigure your DAQ devices and computer-based instruments andbuild applications
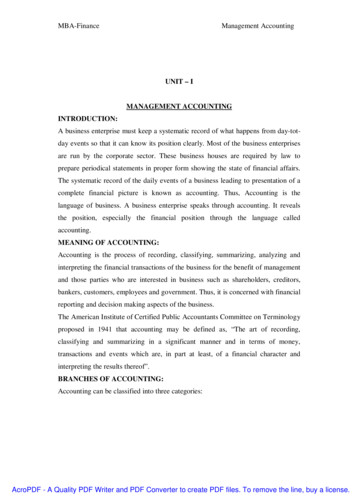
LabVIEW programs are called virtual instruments (VIs).Controls are inputs and indicators are outputs.Each VI contains three main parts: Front Panel – How the user interacts with the VI. Block Diagram – The code that controls the program. Icon/Connector – Means of connecting a VI to other VIs.In LabVIEW, you build a user interface by using a set of tools andobjects. The user interface is known as the front panel. You thenadd code using graphical representations of functions to controlthe front panel objects. The block diagram contains this code. Insome ways, the block diagram resembles a flowchart
Users interact with the Front Panel when the program isrunning. Users can control the program, change inputs, andsee data updated in real time. Controls are used for inputssuch as, adjusting a slide control to set an alarm value,turning a switch on or off, or to stop a program. Indicatorsare used as outputs. Thermometers, lights, and otherindicators display output values from the program. Thesemay include data, program states, and other information.Every front panel control or indicator has a correspondingterminal on the block diagram. When a VI is run, valuesfrom controls flow through the block diagram, where theyare used in the functions on the diagram, and the results arepassed into other functions or indicators through wires.
UNIT-II- VI PROGRAMMINGTECHNIQUES
LabVIEW Programs Are Called VirtualInstruments (VIs)Front PanelControls InputsIndicators OutputsBlock DiagramAccompanying “program” forfront panelComponents “wired” together
VI Front PanelPanel ToolbarBooleanControlDoubleIndicatorWaveform Graph
VI Block DiagramThermometerTerminalCall tosubVIKnobTerminalNumeric ConstantTemperatureGraphWhile LoopStop ButtonTerminalStop LoopTerminal
Controls and Functions PalettesControls Palette(Panel Window)Functions Palette(Diagram Window)Graphical, floating palettesUsed to place controls &indicators on the front panel, orto build the block diagram
Tools Palette Floating Palette Used to operate and modify frontpanel and block diagram objects.Automatic Selection ToolOperating ToolScrolling ToolPositioning/Resizing ToolBreakpoint ToolLabeling ToolProbe ToolWiring ToolColor Copy ToolShortcut Menu ToolColoring Tool
Status ToolbarRun ButtonContinuous RunButtonAdditional Buttons onthe Diagram ToolbarAbort ExecutionExecutionHighlighting ButtonPause/ContinueButtonStep Into ButtonText SettingsAlign ObjectsDistribute ObjectsReorderStep Over ButtonStep Out Button
Open and Run a Virtual InstrumentSignal Generationand Processing.vi Help » Find Examples Browse According to: Task» Analyzing and Processing Signals» Signal Processing» Signal Generation and Processing.vi
Creating a VIFront Panel WindowBlock Diagram WindowControlTerminalsIndicatorTerminals
Creating a VI – Block Diagram After Creating Front Panel Controls and Indicators, Switch toBlock Diagram Ctrl-E Move Front Panel Objects to Desired Locations Using thePosition/Size/Select Tool Place Functions On Diagram Wire Appropriate Terminals Together to Complete theDiagram
Wiring Tips – Block DiagramWiring “Hot Spot”Spacebar Flips Wire OrientationClick To Select WiresClick While Wiring To Tack Wires Down
SubVirtual InstrumentsWhat is a subVI? Making an icon andconnector for a subVI Using a VI as a subVI
SubVIs A SubVI is a VI that can be used withinanother VI Advantages––––ModularEasier to debugDon’t have to recreate codeRequire less memory
Icon and ConnectorIconTerminalsConnector An icon represents a VI in other blockdiagrams A connector shows available terminalsfor data transfer
SubVIsSubVIs
Steps to Create a SubVI Create the IconCreate the ConnectorAssign TerminalsSave the VIInsert the VI into a Top Level VI
Create the Icon Right-click on the icon in thediagram or front panel
Create the ConnectorRight click on the icon pane (front panel only)
Assign Terminals
Save The VI Choose an Easy to Remember Location Organize by Functionality– Save Similar VIs into one directory (e.g. Math Utilities) Organize by Application– Save all VIs Used for a Specific Application into onedirectory or library file (e.g. Lab 1 – Frequency Response) Library Files (.llbs) combine many VI’s into a singlefile, ideal for transferring entire applications acrosscomputers
Insert the SubVI into a Top Level VIAccessing user-made subVIsFunctions Select a VIOrDrag icon onto target diagram
Tips for Working in LabVIEW Keystroke Shortcuts– Ctrl-H – Activate/Deactivate Context Help Window– Ctrl-B – Remove Broken Wires From Block Diagram– Ctrl-E – Toggle Between Front Panel and BlockDiagram– Ctrl-Z – Undo (Also in Edit Menu) Tab Key – Toggle Through Tools on Toolbar Tools » Options – Set Preferences in LabVIEW VI Properties – Configure VI Appearance,Documentation, etc.
Loops and Charts For LoopWhile LoopChartsMultiplots
Loops While Loops– Have Iteration Terminal– Always Run Once– Run According toContinue Terminal For Loops– Have Iteration Terminal– Run According to input N
Loops (cont.)1.2.Select the loopEnclose Code toRepeatFor Loop
ChartsWaveform chart – special numericindicator that can display a history ofvaluesControls Graphs Waveform Chart
Wiring Data into ChartsSingle Plot ChartsMultiplot Charts
Monitoring TemperatureStudents build TemperatureMonitor.vi.
Arrays & File I/O Build arrays manuallyHave LabVIEW build arrays automaticallyWrite to a spreadsheet fileRead from a spreadsheet file
Adding an Array to the Front PanelFrom the Controls Array and Cluster subpalette, select theArray ShellDrop it on the screen.
Adding an Array (cont.) Place data object into shell (e.g. digital control).
Creating an Array with a Loop Loops accumulate arrays at their boundaries
Creating 2D Arrays
File I/OEasy File I/OVIs Read/write tospreadsheet file Read/write characters tofile (ASCII) Read lines from file Read/write binary file
Array Functions & Graphs Basic Array Functions Use graphs Create multiplots with graphs
Array Functions – Basics
Array Functions – Build Array
Graphs Selected from the Graph palette of Controls menu–Waveform Graph – Plot anarray of numbers againsttheir indices–XY Graph – Plot one arrayagainst another–Digital Waveform Graph –Plot bits from binary data
Strings A string is a sequence of displayable or nondisplayablecharacters (ASCII) Many uses – displaying messages, instrument control, file I/O String control/indicator is in the Controls»String subpalette
Clusters Data structure that groups data together Data may be of different types Analogous to struct in C Elements must be either all controls or all indicators Thought of as wires bundled into a cable
Creating a Cluster1. Select a Cluster shellfrom the Array &Cluster subpalette2. Place objects inside theshell
Cluster Functions In the Cluster subpalette of the Functions palette Can also be accessed by right-clicking on the clusterterminal(Terminal labelsreflect data type)BundleBundle By Name
Cluster FunctionsUnbundleUnbundle By NameUnbundled clusterin the diagram
Error Clusters Error cluster contains the following information:– Boolean to report whether error occurred– Integer to report a specific error code– String to give information about the error
Error Handling Techniques Error information is passed from one subVI to the next If an error occurs in one subVI, all subsequent subVIs are notexecuted in the usual manner Error Clusters contain all error conditionserror clusters
Case Structures In the Structures sub palette of Functions palette Enclose nodes or drag them inside the structure Stacked like a deck of cards, only one case visible
Error Clusters & Handling
Sequence Structures In the Structures subpalette of Functions palette Executes diagrams sequentially, Frame 0 (0.x), where x is thetotal number of frames Stacked like a deck of cards, only one frame visible
Sequence Locals Pass data from one frame to future frames Created at the border of the Sequence structureData notavailableSequence localcreated inFrame 1Dataavailable
Formula NodesIn the Structures subpaletteImplement complicated equationsVariables created at borderVariable names are case sensitiveEach statement must terminate with a semicolon (;)Context Help Window shows available functionsNote semicolon
Printing & Documentation Print From File Menu to Printer, HTML, Rich Text FileProgrammatically Print Graphs or Front Panel ImagesDocument VIs in VI Properties » Documentation DialogAdd Comments Using Free Labels on Front Panel & BlockDiagram
Printing File » Print Gives Many Printing Options– Choose to Print Icon, Front Panel, Block Diagram, VIHierarchy, Included SubVIs, VI History Print Panel.vi (Functions » Application Control)Programmatically Prints a Front Panel Generate & Print Reports (Functions » Report Generation)– Search in Find Examples for Report Generation
Documenting VIs VI Properties » Documentation– Provide a Description and Help Information for a VI VI Properties » Revision History– Track Changes Between Versions of a VI Individual Controls » Description and Tip – Right Click to Provide Description and Tip Strip Use Labeling Tool to Document Front Panels & Block Diagrams
Simple VI Architecture Functional VI that produces results when run– No “start” or “stop” options– Suitable for lab tests, calculations Example: Convert C to F.vi
General VI Architecture Three Main Steps– Startup– Main Application– Shutdown
State Machine Architecture Advantages– Can go from any state from anyother– Easy to modify and debug Disadvantages– Can lose events if two occur at thesame timeStates:0: Startup1: Idle2: Event 13: Event 24:Shutdown
Exercise 7 – Simple State Machine
UNIT-III DATA ACQUISITION
Introduction to DAQ Data Acquisition – “Sampling of the real world to generatedata that can be analyzed and presented by a computer.”
PC Based Data Acquisition System Overview:In the last few years, industrial PC I/O interface products havebecome increasingly reliable, ccurate and affordable. PC-based dataacquisition and control systems are widely used in industrial andlaboratory applications like monitoring, control, data acquisition andautomated testing.Selecting and building a DA&C (Data Acquisition and Control)system that actually does what you want it to do requires someknowledge of electrical and computer engineering. Transducers and actuators Signal conditioning Data acquisition and control hardware Computer systems software
Data acquisition System Introduction I:Data acquisition involves gathering signals from measurementsources and digitizing the signals for storage, analysis, andpresentation on a PC. Data acquisition systems come in manydifferent PC technology forms to offer flexibility when choosingyour system. You can choose from PCI, PXI, PCI Express, PXIExpress, PCMCIA, USB, wireless, and Ethernet data acquisition fortest, measurement, and automation applications.
Data acquisition System Introduction II:All industrial processing systems, factories, machinery, test facilities,and vehicles consist of hardware components and computer softwarewhose behavior follow the laws of physics as we understand them.These systems contain thousands of mechanical and electricalphenomena that are continuously changing; they are not steady state.The measurable quantities that represent the characteristics of allsystems are called variables. The proper functioning of a particularsystem depends on certain events in time and the parameters of thesevariables.Often, we are interested in the location, magnitude, and speed of thevariables, and we use instruments to measure them.We assign the variables units of measure such as volts, pounds, andmiles per hour, to name a few.
Transducers:Data acquisition systems have multiple components that work together togather and process information. They can be used to analyze informationregarding physical phenomena, such as temperature, voltage, and pressure.However, because temperature, voltage, and pressure are all distinctdifferent, they require different systems of measurement andrepresentation. In data acquisition systems, a transducer serves as thecomponent that translates raw data into a comprehensible electrical signal.When a data acquisition system uses DAQ (data acquisition hardware) thetransducer also functions as a sensor, gathering the data from which it willthen generate a signal. As a result of all the different variables dataacquisition systems can measure, there are several kinds of transducers. Atransducer must be capable of generating different signals depending on theparticular phenomenon measured. Two general types of signals commonlyare used: analog and digital.
Transducer and Acutuator:A transducer converts temperature, pressure, level, length, position,etc. into voltage, current, frequency, pulses or other signals.An actuator is a device that activates process control equipment byusing pneumatic, hydraulic or electrical power. For example, a valveactuator opens and closes a valve to control fluid rate.
Signal conditioning :Signal conditioning circuits improve the quality of signals generatedby transducers before they are converted into digital signals by thePC's data-acquisition hardware.Examples of signal conditioning are signal scaling, amplification,linearization, cold-junction compensation, filtering, attenuation,excitation, common-mode rejection, and so on.
One of the most common signal conditioning functions isamplification. For maximum resolution the voltage range of theinput signals should be approximately equal to the maximuminput range of the A/D converter.Amplification expands the range of the transducer signals so thatthey match the input range of the A/D converter. For example, a x10 amplifier maps transducer signals which range from 0 to 1 Vonto the range 0 to 10 V before they go into the A/D converter.
Signal ConditioningElectrical signals are conditioned so they can be used by an analoginput board.The following features may be available: Amplification IsolationFiltering Linearization
Data acquisitionData acquisition and control hardware generally performs one ormore of the following functions: analog input, analog output, digital input, digital output and counter/timer functions.
Analog inputAn analog input converts a voltage level into a digital value that canbe stored and processed in a computer. Why would you want tomeasure voltages? There are a multitude of sensors available whichconvert things like temperature, pressure, etc. into voltages. Thevoltages can then be easily measured by various kinds of hardware,such as a LabJack U3-HV, and then read into a computer. Thecomputer can then convert the voltage value into it's original type(temperature, pressure, etc) and the value can then be stored in a file,emailed to someone, or used to control something else outside of thecomputer.
The most significant criteria when selecting A/D hardware are:1. Number of input channels2. Single-ended or differential input signals3. Sampling rate (in samples per second)4. Resolution (usually measured in bits of resolution)5. Input range (specified in full-scale volts)6. Noise and nonlinearity
Analog to Digital ConverterAn Analog to Digital Converter (ADC) is a very usefulfeature that converts an analog voltage on a pin to adigital number. By converting from the analog world tothe digital world, we can begin to use electronics tointerface to the analog world around us.Not every pin on a microcontroller has the ability to do analog todigital conversions. On the Arduino board, these pins have an ‘A’in front of their label (A0 through A5) to indicate these pins canread analog voltages.ADCs can vary greatly between microcontroller. The ADC on theArduino is a 10-bit ADC meaning it has the ability to detect 1,024(210) discrete analog levels.Some microcontrollers have 8-bit ADCs (28 256 discrete levels)and some have 16-bit ADCs (216 65,535 discrete levels).
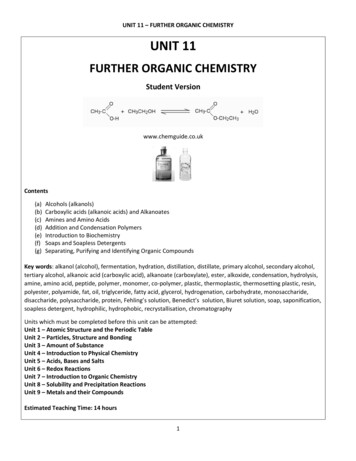
Sampling rate4 Samples/cycleSampling rate is the speed at which thedigitizer’s ADC converts the input signal,after the signal has passed through the analoginput path, to digital values. Hence, thedigitizer samples the signal after anyattenuation, gain, and/or filtering has beenapplied by the analog input path, and n. The sampling rate of a highspeed digitizer is based on the sample clockthat controls when the ADC converts theinstantaneous analog voltage to digital valuesAnalogInput16 Samples/cycle8 Samples/cycle
Effective rate of each individual channel is inversely proportional to the numberof channels sampled.Example:100 KHz maximum.16 channels.100 KHz/16 6.25 KHz per channel.
A/D converter RangeDynamic range is often a key parameter within signal processingsystems and a shortfall can limit the quality and range of signals thatcan be received. The technical progress made on improving thisgateway between the analogue and digital world has not kept pacewith Moore's law because the challenges are more fundamental thansimply reducing transistor sizes. Methods to increase a/d converterdynamic range are therefore always of interest, although eachsolution often suits particular applications.
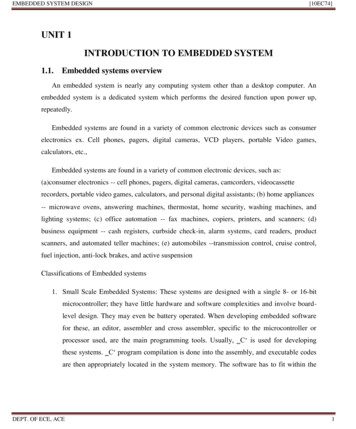
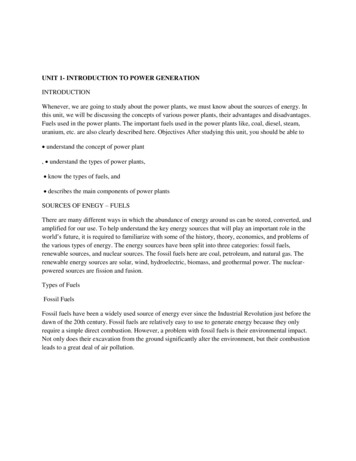
Analog output (D/A)An analog output is a measurable electrical signal with a definedrange that is generated by a controller and sent to a controlleddevice, such as a variable speed drive or actuator.Changes in the analog output cause changes in the controlled devicethat result in changes in the controlled process.Controller output digital to analog circuitry is typically limited to asingle range of voltage or current, such that output transducers arerequired to provide an output signal that is compatible withcontrolled devices using something other than the controller'sstandard signal.Common Types:There are four common types of analog outputs;voltage, current, resistance and pneumatic.
Analog output (D/A)
Data Aquisition softwareIt can be the most critical factor in obtaining reliable, highperformance operation. Transforms the PC and DAQ hardware into a complete DAQ,analysis, and display system. Different alternatives:– Programmable software.– Data acquisition software packages.
Programmable software Involves the use of a programming language, such as:– C , visual C – BASIC, Visual Basic Add-on tools (such asVisuaLab with VTX)– Fortran– Pascal Advantage: flexibility Disadvantages: complexity and steep learning curve
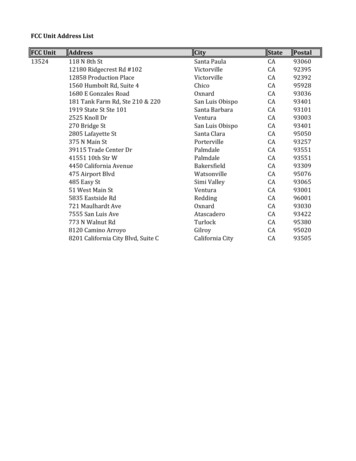
Data acquisition software Does not require programming. Enables developers to design the custom instrumentbest suited to their DADISP, DASYLAB, etc.Below is an image with LabView:
Small Computer System Interface [SCSI]Small Computer System Interface (SCSI), an ANSIstandard, is a parallel interface standard used by AppleMacintosh computers, PCs, and many UNIX systems forattaching peripheral devices to computers. SCSI interfacesprovide for faster data transmission rates than standardserial and parallel ports. In addition, you can attach manydevices to a single SCSI port. There are many variationsof SCSI: SCSI-1, SCSI-2, SCSI-3 and the recentlyapproved standard Serial Attached SCSI (SAS).SCSI-1 : SCSI-1 is the original SCSI and it is obsolet sofar. Basically, SCSI-1 uses an 8-bit bus, and supports datarates of 4 MBps.
SCSI-2SCSI-2 is an improved version of SCSI-1. SCSI-2 is based on CCSwhich is a minimum set of 18 basic commands all manufacture'shardware would work together. SCSI-2 also provided extra speedwith options called Fast SCSI and a 16-bit version called WideSCSI. A feature called command queuing gave the SCSI device theability to execute command in an order that would be mostefficient. Fast SCSI delivers a 10 MB/sec transfer rate. Whencombined with the 16-bit bus, this doubles to 20 MB/sec. This iscalled Fast-Wide SCSI.
SCSI-3SCSI-3 has many advances over SCSI-2 such as Serial SCSI.This feature will allow data transfer up to 100MB/sec through asix-conductor coaxial cable. SCSI-3 solves many of thetermination and delay problems of older SCSI versions. SCSI-3eases SCSI installation woes by being more plug-and-play innature, such as automatic SCSI ID assigning and termination.SCSI-3 also supports 32 devices while SCSI-2 supports only 8.
Data Acquisition nDigitalProcessing
Analog vs. Digital Signal Analog signals:– Continuous, expressed in decimal system– No limitation on the maximum/minimum value– Can not be processed by computer Digital signals: binary number system– All numbers are expressed by a combination of 1 & 0– The maximum value is limited by # of bits available
Signal ConditioningFunctions: modify the analog signal to match the performance ofthe ADC– Pre-filtering: remove undesirable high frequencycomponents– Amplification: amplify the signal to match the dynamicrange of the ADC
Analog-to-Digital Conversion (ADC)Function: convert analog signals into digital signals– Sample & hold– Quantization– Codingy(t) f(t) yk f(tk)
QuantizationDefinition: transformation of a continuous analog input into aset of discrete output state– Coding: the assignment of a digital code word ornumber to each output states– # of possible state: N 2n, n is # of bits– Quantization resolution: Q (Vmax-Vmin)/N– Quantization Error: f (t k ) f kN
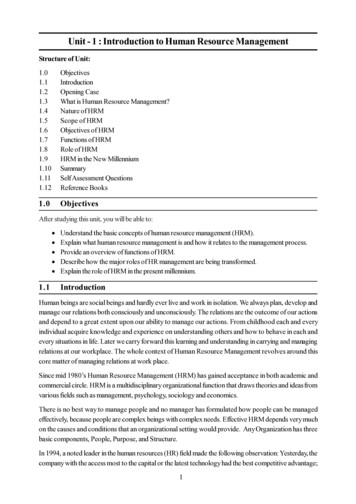
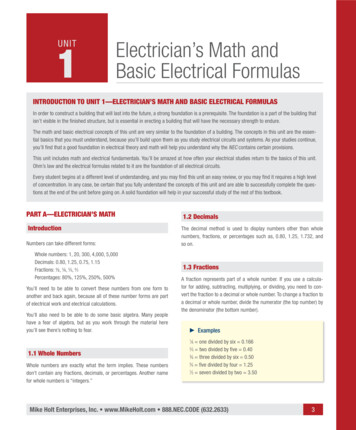
Select a Data Acquisition Card Functions: A/D, D/A, Digital I/O, signal conditioning(amplification, prefiltering), timer, trigger, buffer Features:– A/D resolution (# of bits used)– Maximum sampling rate– # of channels– Total throughput– Aperture time
Example of Data Acquisition Card
What is PXI? PXI PCI eXtensions for Instrumentation Open specification governed by the PXI Systems Alliance(PXISA) and introduced in 1997 PC-based platform optimized for test, measurement, andcontrol PCI electrical-bus with
Virtual instrumentation combines mainstream commercial technologies. such as C, with flexible software and a wide variety of measurement and control hardware, so engineers and scientists can create user-defined systems that meet their exact application needs. With virtual instrumentation