Transcription
I. Ćipranić, G. SekulićAnaliza utjecaja tla na gubitke u vodovodnim sustavimaISSN 1330-3651(Print), ISSN 1848-6339 (Online)DOI: 10.17559/TV-20140617211559THE ANALYSIS OF THE INFLUENCE OF SOIL ON LEAKAGE IN WATER SUPPLY SYSTEMSIvana Ćipranić, Goran SekulićOriginal scientific paperLeakage modelling in water supply systems is a process, which, due to its complex nature, holds more components in itself. For the purposeof understanding the problem, the models for losses are presented, in the way they have been treated so far. Former practice has shown that it isjustified to include the impact of the soil, in which the water pipes are laid, in the leakage modelling,. The reason for this is the energy loss of the waterflow, which occurs between the orifice and the soil surface during the process of the water movement through the soil. This paper proposes a method forthe evaluation of the soil influence, which can be implemented in existing models.Keywords: coefficient of filtration; leakage; pressure; soil; water supply systemAnaliza utjecaja tla na gubitke u vodovodnim sustavimaIzvorni znanstveni članakModeliranje gubitaka u vodovodnim sistemima je proces koji zbog složenosti svoje pojave, obuhvaća više komponenti. Radi razumijevanja problema prvosu dati prikazi modeliranja gubitaka, na način kako su do sada obrađivani. Neka dosadašnja istraživanja su pokazala da je opravdano da se u modelgubitaka uključi i utjecaj tla u kojem su vodovodne cijevi položene, iz razloga gubitaka energije toka vode, koji se dešavaju između mjesta pukotine ipovršine zemljišta, usljed kretanja vode kroz zemljište. U ovom radu su date sugestije u kojim slučajevima je potrebno utjecaj tla implementirati upostojeće modele.Ključne riječi: gubici vode; koeficijent filtracije; pritisak; tlo; vodovodni sistem1IntroductionWater supply companies have been well aware of theconstant need for the rational loss rate control andtherefore they aim at the reduction of that loss. Water lossreduction leads to the decrease of the costs of watersupply system performance as well. In order to provide aneffective way of the water loss management in watersupply systems, it is of high importance to analysethoroughly the very nature of losses, find a solution fortheir minimization and finally implement an operatingstrategy in the process of minimization. Apart from thementioned components necessary for the effective lossrate control, it is also important to provide a hydraulicmodel, which describes the state of water supply systemsmost precisely. Mathematical models serve as a tool formodelling of water supply system behaviour and they aresuccessfully used for the system analyses. Additionally,these models can be very helpful in the activemanagement of the system.A great number of the existing leakage models in thewater supply systems are based on the introduction offitting coefficients, chosen in such a way that the resultsof the model match the data from the leakage measuringcollected in the water supply systems. In other models theclassic orifice equation is used. For the purpose ofdeveloping the models, which will present the leakageand have more physical meaning, a better understandingof parameters, which control the leakage rate, is necessary[1]. Also, an effective leakage modelling demands athorough understanding of the hydraulics of leaks throughthe orifices.In the majority of models it is proposed that leaks areunder the influence of the orifice. Thomas Walski et al.[1] have reached the conclusion that, in some cases, theleakage through the orifice is under the significantinfluence of soil, where the pipes are laid. The soil impactappears as a result of additional head losses, which occurTehnički vjesnik 22, 5(2015), 1179-1184between the orifice and the soil surface, while the watermoves through the soil.This paper presents the analysis of the influence ofdifferent soil types on the flow rate from leaks in the pipe,for various pressures in the system. More precisely, notonly does it emphasize the situations in which the leakagedepends on the soil head loss, but also it points to thenecessity of completing the existing models with someequations, which would adequately represent the abovementioned influence.2 Theoretical background2.1 On water losses in water supply systemsA detailed analysis of the problem concerning waterlosses in water supply systems includes the definition ofthe type and loss rate. For that purpose water losses aredivided into main components: the background losses andthe orifice losses.The background losses refer to the total amount ofwater losses from all the pipelines in the network, whichare, if taken separately, too small to be discovered viavisual inspection or via inspection with the use ofinstruments based on the sound measuring. Pressurecontrol has the greatest influence on this component ofloss. The background losses, characterized as minimallosses, occur in individual orifices with the flow ratelower than 0,25 m³/h and at pressure rate of 50 m [2].The orifice losses refer to the water loss due to theorifices found in the distribution system. The orifices canbe classified as registered and unregistered. The speednecessary for detecting the orifice, and for fixing it later,influences the total amount of water losses from all theorifices; accordingly, the control of water loss duration orthe leakage time minimizes the losses [2].The effect of pressure, although being verycomprehensible in theory, has only recently been receivedin the area of water loss control, in terms of reducing and1179
The analysis of the influence of soil on leakage in water supply systemsI. Ćipranić, G. Sekulićmaintaining a low level of loss in water distributionsystems [2].2.2 The relationship between pressure and orifice lossThe Law of Conservation of Energy states that theflow velocity through the pipe hole is changed into thesquare root function of the pressure dominating in it,according to the equation:v Cd 2 gP.(1)Many engineers adopt the following: the lossincrement in the distribution systems must be the squareroot function of the pressure, i.e. the losses are intensifiedwith the pressure change. However, easily adoptedassumption that the Cd value is the constant one is notalways valid. For particular analyses, the coefficient ofdischarge can be changed in relation to the flow regime,which can be laminar, transitional or turbulent. Thisdepends on the Reynolds number Re ( v·D/ν), in which vis velocity, D is the diameter of the pipe, and ν is thekinematic viscosity that varies with temperature [3].Another significant reason, which questions thegeneral assumption that water losses are the square rootfunction of the pressure, is the relationship between theleakage rate and the opening area, in accordance with thefollowing equation:Q v A Cd A 2 gP .(2)Concerning the longitudinal cracks on the plastic PEand PVC pipes, it is normal to expect, as it has alreadybeen proved clearly by means of numerous laboratorytests, that the area of the opening varies with the pressurechange [4, 5]. If the area changes in a linear way (thelongitudinal crack is opened in one direction), then thearea (A) will vary with P1,0, and the flow rate (Q) with P1,5.If the orifice is opened in two directions, longitudinal andradial, then the rule of change alters, so that the area (A)varies with P2,0, and the flow rate (Q) with P2,5 [3].The most meaningful general equation used forsimple analysis and prognosis of the relationship betweenleakage rate and pressure, regardless of whether alaboratory test refers to one orifice in the pipe or to thetotal amount of leaks in a part of distribution network [3],is:NQ1 P1 ,Q0 P0 (3)where P0 and Q0 represent the initial pressure and leakflow rate in the waterworks, P1 and Q1 are the coefficientsof corrected pressure and leak flow rate, while theexponent N depends on the prevailing orifice type and onthe pipe materials - rigid or flexible.Analyses of over 100 field tests on sections ofdistribution systems in Japan and district metered areas inAustralia, Brazil, Canada, Malaysia, New Zealand, UKand the USA have confirmed that the N exponent1180typically ranges from 0,5 to 1,5 but may occasionallyreach the value of 2,5. The Japanese use a weightedaverage exponent value of 1,15. The weighted average ofsubstantial numbers of tests from the UK is also close to1,0 (linear). Tests on systems where all detectable leakshave been repaired or temporarily shut off, leaving onlybackground (undetectable) leakage, tend to produce highN exponents close to 1,5 [6]. Researchers have suggestedthat the exponent N is 0,5 for fixed area. "If the leakbehaves as an orifice, the exponent N is 0,5". [1]The majority of mathematical models accepted Eq.(3) as a base for leakage modelling, adopting differentvalues of the exponent N.2.3 Present software packages for water supply systemmodellingExisting software packages normally solve node-levelmodelling of the relationship between the consumptionand leakage rate, in some ideal working conditions of thewater supply system, providing that the consumptionvalue is given, that pressure varies and the leaks areproportionally included into consumption. For example,the software package "Wesnet" (also called "InfoWorks")uses the option "Pressure - Related Demand" to solve this.Its main idea is that the given consumption and leaks arerelated to nominal working pressure (if the local pressureis different, the consumption and leak rates are changed)[7].Similar possibilities have been offered by thesoftware package "Epanet" with its function, so-called"Emitters", by means of which the leakage rate is shownin the consumption node. This option introducesphysically a fictitious pipe between the junction and afictitious reservoir. The level at the fictitious reservoir isthe elevation of the junction. The calculated flow throughthe fictitious pipe is the flow defined as the loss [8].In software "Aquanet" the losses are included into theattributes of the pipe joints, where the leak rate is set inadvance at m3/km with pressure of 105 Pa. By means ofusing the already stated leakage rates in the pipe openingwith different pressures, the rate would be recomputed forreal pressures in the network [9]. "Pressure RelatedDischarge Node" is another option within the program,which enables the discharge monitoring in a specific nodeof the network, which corresponds with the pressurechange in the same node [10]. This option can be used forthe pipeline damage simulation, when the leakage is verysignificant and easily noticeable.Additionally, it should be taken into considerationthat water consumption is also pressure dependent [11].2.4 The leakage representation in the water supplysystems with "improved model"Equations associated with the leak have been addedto the models with standard equations for the watersupply system. This offers an "improved model" whichenables a sustainable pressure control and leakageanalysis. The estimated total water loss in the network isdistributed at nodes, in proportion with the consumptionin nodes. Accordingly, equation for each node is [12]:Technical Gazette 22, 5(2015), 1179-1184
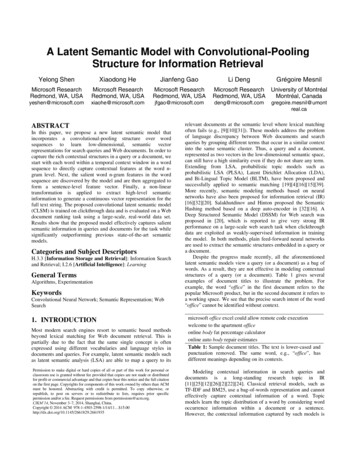
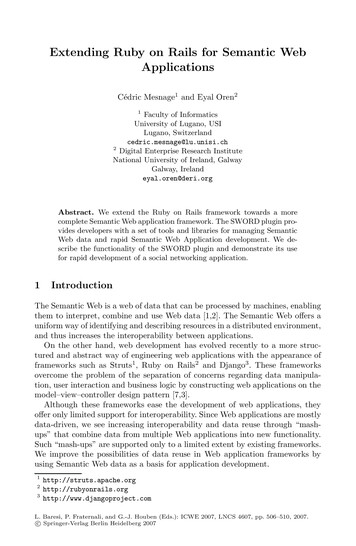
I. Ćipranić, G. SekulićAnaliza utjecaja tla na gubitke u vodovodnim sustavimaqli (t ) ai Pi N (t ),(4)where: qli (t) is the leakage of node i at time t; Pi(t) ispressure of node i at time t; N is the leakage exponent; aiis the leakage factor of node i, ai β di (12:00); β is aconstant; di(t) is the node demand.The total leakage at 12:00 appears as a result of thesummation of the total leakage of all nodes:Ql (12:00) β d i(12:00) Pi1(12,1 :00) ,(5)Here the leakage exponent N is 1,1 as an averagevalue of that coefficient for networks in which thebackground losses appear as well as the orifice leakage.In order to estimate the factor β, which is a constantthrough time, the chosen time is 12:00 p.m.The coefficient β is calculated by means of equation:β Figure 1 Schematic of the water moving through the soil [1]iQl (12:00) di (12:00) Pi1(12,1 :00),(6)Former analyses of the soil influence on lossesAfter careful literature analysis, we concluded thatThomas Walski et al. [1] provided the most thoroughaccount of the soil influence on losses in water supplysystems. In this section we will give a concise outline oftheir experiment, the definition of the OS number and theacquired results.3.1 The experiment descriptioniand the leakage factor is calculated by means of equation:ai β d i (12:00) .3Fig. 2 represents the schematic of the experimentapparatus.(7)The real water consumption, consumption withoutlosses, di(t), is calculated for each node by subtracting theloss from the total demand, for each point of time t [13]:d i (t ) d i (t ) ai P1,1i (t ).(8)Improved models represent the leakage in the watersupply systems in the most suitable way. However, likeall the other models, improved models have certaindisadvantages. In spite of great progress made in the areaof leakage modelling, so many problems have remainedand they require further work and research.2.5 Disadvantages of former modelsNot all previously adopted assumptions within somemodels are always valid for the operative control of "realworld" water supply systems.One of the disadvantages of the models is neglectingthe soil head loss. As it has already been stated, in thelarge number of cases the losses are modelled under theassumption that the loss rate is controlled by the size of anorifice and pressure, Eq. (2). But, in larger leaks, thewater will move through the soil and reach the surfacearea. In that case, the outside piezometric level willactually become constant. The drawn conclusion is thefollowing: in the case of smaller leaks, additional headlosses will occur between the leak and the soil surface,while the water moves through the soil, Figure 1, [1].It is also possible that the soil head losses are largerthan the orifice head losses. Neglecting this fact in theprocess of modelling of the system performance willresult in a model which does not match the "real-world"water supply systems.Tehnički vjesnik 22, 5(2015), 1179-1184Figure 2 Schematic of the experiment apparatus [1]The apparatus consists of a pipe with drilled holes,pressure regulator and pressure gauge, a cylinder filledwith sand, in which the pipe is laid, and an overflowingpipe. The authors considered two situations in order todetermine the difference between the leakage controlledby the soil head loss and the leakage controlled by theorifice head loss. In the first case, referred to as "the shortapparatus", there was a cylinder 48 cm tall, with an insidediameter of 38 mm and an overflowing pipe of 43 cm. Inthe second case, known as "the tall apparatus", there wasa cylinder 157 cm tall, because of larger head lossescaused by the water movement through the material foundin the cylinder. An inside diameter was of 10,2 cm. As faras this cylinder is concerned, the flow velocity was greatdue to the smaller cross-section area. The pipe with holeswas laid at the bottom of the cylinder. The experiments1181
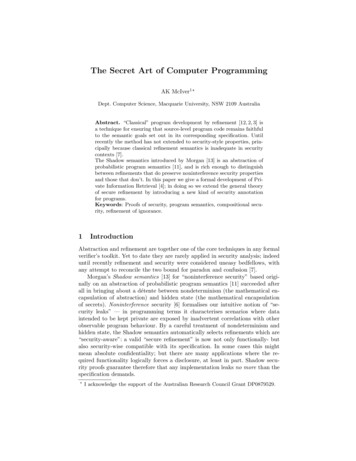
The analysis of the influence of soil on leakage in water supply systemsI. Ćipranić, G. Sekulićwere conducted with various orifice sizes, ranging from1,067 mm to 9,35 mm. The inlet pressure was controlledwith a pressure regulator. The cylinders were filled withsand for one reason: sand is resistant to compression andit can be used for more than just one test, displaying nosignificant change of the hydraulic conductivity. Thebottom of the cylinder, i.e. the space around the pipe, wasfilled with gravel for the purpose of easier water flow.During the experiment the pressure gauge was usedfor measuring the inlet pressure. The discharge rate wasmeasured by collecting the water that flowed through theoverflow at specific period of time. The flow rates weremeasured for pressures of 69, 103, 137, 172 and 206 kPa,for all orifice sizes. In order to calculate the dischargecoefficient for the leak through orifices, Cd, the flow ratefor all five pressures in the pipe free of sand wasmeasured (the free flow). The values of the measureddischarge coefficient ranged from 0,71 to 0,76. Theexperiments were performed using various orifice sizes,various flows, pressures and soil velocities in both cases,in the short apparatus and in the tall one as well.3.2 The OS number definitionOn the basis of schematic of the describedexperiment, by means of the energy equation which linksthe pressure and flow for the cross-cuts a and b, Fig. 2, itis possible to present the orifice head losses and the soilhead losses with a common model.The energy equation for the case in Fig. 2 is shown:za Pag va22g zb Pbg vb22g hp ho hs ,(9)where: hp is the head loss in the pipe; ho is the orifice headloss; hs is the head loss in soil.Providing the head losses in the pipe areinsignificantly small in relation to other losses (becausethe length of the pipe is short), and that atmosphericpressure is at the water surface (Pb/γ 0), the energyequation will be presented in the following way:za Paγ z b ho hs .(10)Darcy’s law will be applied for the water movementthrough the soil: h Q K A s , L (11)where: K is the filtration coefficient; A is the cross-cutarea of soil; hs is the head loss through the soil; L is thelength of the flow.Accordingly, the equation for the soil head loss is:hs Q L.K A(12)The orifice flow can be calculated by means of theequation:1182(13)Q Cd Ao 2 gho ,where: Cd is the discharge coefficient; Ao is the area of theorifice cross-cut; ho is the orifice head loss.The previous equation provides the orifice head loss:ho 1 Q 2 g Cd Ao2 . (14)The combination of equations for ho and hs with theenergy equation leads to:2Q L1 Q za z b , g2 g Cd Ao K APa(15)that is:Hc 1 Q 2 g Cd Ao2 Q L . K A (16)Division of this equation by other addend providesthe following:Hc K A K A Q 1 Q L2 g L Cd Ao2 1. (17)The first addend refers to the relationship between theorifice head losses and soil head losses. That number iscalled the OS number (Orifice / Soil Number) [1]:2K A Q 1 ho .OS 2 g L Cd Ao hs(18)The OS number is a non-dimensional one, indicatingthe type of flow realized in some situation. This meansthat with the OS number it can be determined whether thesoil head losses or orifice head losses are dominant in aparticular case.3.3 The results of the experimentThe ratio of the exponent N from Eq. (3) and the OSnumber is derived from the results of the experiment, Fig.3.When the OS number is 1, the soil head losses andorifice head losses are equal. When the OS number issmaller than 1, the soil head losses are dominant and if itis larger than 10, the orifice head losses are dominant.As shown in the diagram in Fig. 3, high value of theOS number matches the exponent N of 0,5 thus pointingto the fact that leakage depends on the orifice head loss.In this case the soil head loss is insignificant. When theOS number is near 1, the leakage through the orifice is thefunction of the soil head loss and of the orifice head lossas well. Low values of the OS number (hs ho) indicatethat the leakage through the orifice is under the influenceof the soil head loss. The transition range from oneTechnical Gazette 22, 5(2015), 1179-1184
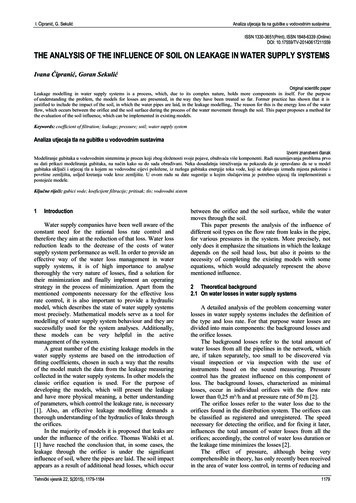
I. Ćipranić, G. Sekulićcontrolled condition to another is very small, and it occurswhen the OS number is near 1.Analiza utjecaja tla na gubitke u vodovodnim sustavimaIn the real-world systems, the OS number is usuallyhigher than 1,0 which indicates that the leakage losses aremore dominant than the soil head losses.If the OS number is 1, a large leak would need tohappen in soil with low conductivity in order to concludethat the orifice leakage is controlled by the soil head loss.4Figure 3 Diagram of the relationship between the exponent N and theOS number [1]The presented analyses indicate that the factors whichcontrol the leakage can be predicted on the basis of valuesof the OS number, i.e. values of the OS number help usdetermine whether the leakage is in relation to the orificeflow or to the water movement through neighbouring soil.The test demonstrates the following: relatively highflow rate is necessary so that the leakage would becontrolled by the soil head loss, which suggests low valueof the OS number. This means that in the majority ofenvironments soil probably will not influence the leakageconsiderably. Obviously, this requires a high fluidvelocity.The analysis of the influence of the soil type on thevalues of the OS numberWe calculated the values of the OS number (on thebasis of Eq. (18)) for different filtration coefficients ofneighbouring soil, orifice sizes in the pipes and pressurein the system. The cross-sectioned area, through whichwe calculated the flow, was adopted and it amounts to A 1 m2, due to the simplification of calculation.The diagram in Fig. 4 demonstrates that the leakage iscontrolled by the soil head loss (if the OS number is 0,1)if there is a higher flow rate (larger orifice diameter) andif the filtration coefficient of neighbouring soil is smaller.Also, we conclude that the influence, under the givenparameters - pressure in the system is 1,5 105 Pa, isgreater than it is for the pressure of 3 105 Pa.The framed field in the diagram is a schematic of thesystem state, for which it would be necessary to model thesoil head loss, and thus complete the hydraulic model ofthe entire system. Geological compositions of the soiltypes, which match the low values of the leakagecoefficients, are: clays, silts, silt sands, etc.From everything above mentioned we draw theconclusion that if the OS number is 0,1, the model of thelosses in the system, for already specified parameters, canbe completed by introducing the Eq. (11).Figure 4 The dependence of the OS number upon the filtration coefficient of the neighbouring soil and the orifice size in the pipes,for varying pressure in the systemTehnički vjesnik 22, 5(2015), 1179-11841183
The analysis of the influence of soil on leakage in water supply systems5ConclusionAll existing leakage models deal with the modellingof nodal consumption-leakage relation. Improved modelsenable a sustainable control of pressure and leakageanalysis. Although these models present the losses inwater supply systems most accurately, yet they have somedisadvantages. One of these is neglecting the water flowthrough the soil. It has been shown that the influence ofthe water moving through the soil cannot be neglected,especially if the soil with low values of the filtrationcoefficient is concerned. The value of the OS numberimplies when it is necessary to complete the leakagemodel with the equations referring to the water movingthrough the neighbouring soil.The recommendation suggested in this paper refers tothe necessity of including the influence of the watermoving through the soil into further dealing with leakagemodelling in water supply systems. This would be of highimportance especially within those water systems whichare ruinous and which are found in the soil with lowvalues of the filtration coefficient (clay, silt, silt sand,etc.).6I. Ćipranić, G. SekulićSCIENCE A (Applied Physics & Engineering) ISSN 1673565X (Print); ISSN 1862-1775 (Online), 2013.[15] Ferrante, M. Experimental investigation of the effects ofpipe material on the leak head-discharge relationship. //Journal of Hydraulic Engineering. 138, 8(2012), pp. 736743. DOI: 10.1061/(ASCE)HY.1943-7900.0000578[16] Guo, S.; Zhang, T.; Zhang, Y.; Zhu, D. Z. An approximatesolution for two-dimensional groundwater infiltration insewer systems. // Water Science and Technology. 67,2(2012), pp. 347-352. DOI: 10.2166/wst.2012.568Authors’ addressesIvana Ćipranić, assistentFaculty of Civil Engineering, University of MontenegroCetinjski put bb, 81000 Podgorica, MontenegroE-mail: ivanacipranic@yahoo.comPhD Goran Sekulić, profesorFaculty of Civil Engineering, University of MontenegroCetinjski put bb, 81000 Podgorica, MontenegroE-mail: sgoran2000@gmail.comReferences[1] Walski, T.; Bezts, W.; Posluszny, E.; Weir, M.; Whitman,B. Modeling Leakage Reduction through Pressure Control.// American Water Works Asociaton. 98, 4(2006), pp. 147155.[2] Ivetić, M.; Prodanović, D.; Janković, Lj. Osnovne zonebilansiranja - Upustvo, Beograd, 2008.[3] Lambert, A. What Do We Know About Pressure: LeakageRelationships in Distribution Systems? // Proceedings ofIWAConference "System Approach to Leakage Control andWater Distribution Systems Management", Brno, 2000.[4] Ashcroft, A.; Taylor, D. The Ups and Downs of Flow andPressure. // Surveyor. (1983), pp. 16-18.[5] Khadam, M. A.; Shammas, N. Kh.; Al-Feraiheedi, Y.Water Losses from Municipal Utilities and their Impacts. //Water International. 16, (1991), pp. 254-261. DOI:10.1080/02508069108686121[6] Thornton, J.; Lambert, A. Progress in Practical Predictionof Pressure: Leakage, Pressure: Burst Frequency andPressure: Consumption Relationships. // Proceedings ofIWA Special Conference "Leakage 2005", Halifax, NovaScotia,Canada, September, 2005.[7] http://www.innovyze.com/, 2014.[8] Rossman, A. Epanet 2 User’s Manual, http://www.epa.gov/,2000.[9] http://www.finite-tech.com/, 2014.[10] Sekulić, G.; Ćipranić, I. Problematika modeliranja gubitakau vodovodnim sistemima. // Voda i sanitarna tehnika. 2,(2007), pp. 29-36.[11] Babić, B.; Đukić, A.; Stanić, M. Managing water pressurefor water savings in developing countries. // Water SA. 40,2(2014). DOI: 10.4314/wsa.v40i2.4[12] Abdel Meguid, H. S. Pressure, Leakage and EnergyManagement in Water Distribution Systems, DE MontfortUniversity, Leicester, 2011.[13] Brown, K. Modeling Leakage in Water DistributionSystems, The Florida State University, 2007.[14] Guo, S.; Zhang, T.; Shao, W.; Zhu, D. Z.; Duan, Y. Twodimensional pipe leakage through a line crack in waterdistribution systems. // Journal of Zhejiang University-1184Technical Gazette 22, 5(2015), 1179-1184
influence of soil, where the pipes are laid. The soil impact appears as a result of additional head losses, which occur between the orifice and the soil surface, while the water moves through the soil. This paper presents the analysis of the influence of different soi