Transcription
Solar Powered, Multi‐seated,Internetted Computer SystemFinal ReportDecember 3rd, 2008Sponsored By:In Cooperation With:Michigan State UniversityUniversity of Dar es SalaamECE 480 ‐ Design Team #2 ‐ Fall 2008ManagementJakub MazurWebJosh WongDocument Ben KershnerPresentation/LabEric Tarkleson
Executive SummaryWith the increasing proliferation of affordable, reliable personal computersinto the marketplace, there is a great demand to develop affordable personalcomputers for remote and underdeveloped areas. Before deploying a computersystem into such harsh conditions several obstacles must be overcome, includingsource of electricity, telecommunications, and the savannah climate. The LenovoCorporation has tasked this team to develop a solar‐powered computer workstationthat can accommodate up to eight users. The solution must be robust enough towithstand the harsh environment with as little technical maintenance as possible,yet still be affordable for rural schools.A bank of solar panels charges a small battery bank using a commerciallyavailable charge controller. A custom engineered battery management systemmonitors voltages and currents from the solar panels and the battery to calculatesystem data. The system also monitors case temperatures to insure everything isoperating within a safe range. Should the battery become discharged ortemperatures rise above the safe limits the system will automatically shut itselfdown. All power data is logged to the computer and stored for system optimization.A small LCD panel displays pertinent system informationA single computer can connect up to 8 monitors, keyboards and mice. Eachterminal allows independent simultaneous logons. The operating system is Linuxbased and uses only free and open source software (hereinafter referred to asFOSS).Since this project has three vastly different, but equally important main tasksthat needed to be researched, tested, and built this report is split into three mainsections. First is solar power system design, second is power management, and thirdis Multi seat hardware and software. Each section will address the research, designissues, testing, and conclusions that were found. The last section will deal withsystem integration and project findings and conclusions. Since we did not deal withthe telecommunications issues these will not be addressed in this report.2
AcknowledgementWe would like to thank our sponsor, Lenovo, for their help in making thisproject a success. We also would like to thank our team members in theTelecommunications department as well as the faculty and students working withus at the University of Dar Es Salaam, Tanzania.Also we would like to thank LEM and Man vs. Machine for their donationsand samples. Their engineers and salespeople were very helpful in guiding us in theright direction.This project would not have been possible without the help of our facilitatorDr. Jian Ren. Also we would like to thank Dr. Goodman for helping keep us on trackand helping us plan our deployment of this project in Tanzania.3
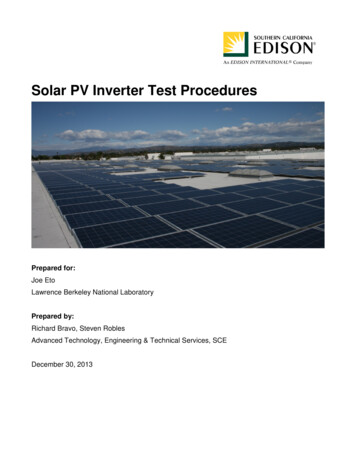
Figure 1 Power system block diagram.4
Table of ContentsSolar Powered, Multi‐seated, Internetted Computer System1Executive Summary.2Acknowledgement .3Section 1 ‐ Photovoltaic System Design.7Determining Size of Photovoltaic Panel Array:. 7Determining Load Power Consumption: . 7Determining Solar Insolation Levels:. 9Sizing Battery Array.11Wire Sizing and Connections:.12Maximum Solar Power Output: .13Inverter to Battery Wiring.14DC AC Inverter .15Charge Controller .16Conclusion.17Section 2 ‐ Power Management .19Research.19Voltage Measurements.20Control Board .22Power Management Board.22Conclusion.23Section 3 ‐ Multi Seat System Hardware and Software .25Thin Clients.28Multiple‐Motherboards .29Multi User .30Testing/conclusion.31Section 4 ‐ System Integration and Conclusion.32Integration.32Safety.32Future Improvements:.34Intelligent Monitoring .355
Conclusion:.37Appendix 1 – Technical Roles and Responsibilities .39Eric Tarkleson .39Joshua Wong .40Jakub Mazur.41Ben Kershner .42Appendix II ‐ Schematics.43Appendix III ‐ Nomenclature.46Appendix IV ‐ References and Recommended Reading .476
Section 1 ‐ Photovoltaic System DesignThere are many types of solar systems but most can be categorized into avariation of the following: A “grid‐tie” system where there are no batteries and thepower grid provides back‐up power. A hybrid “grid‐tie” system where the powergrid provides back‐up for the solar panels and batteries act as a backup for the grid.In cases where there is no access to grid power an “off‐grid” system is used, in whichthe battery bank stores and provides all the energy for the system without a backup.Since this is generally the case in under‐developed areas this will be the systemdiscussed here. There are also systems with generators as backups, they arecomparable to “grid‐tie” systems and will also be omitted from discussion here.Determining Size of Photovoltaic Panel Array:There are several steps involved in sizing the PV array, determining loadpower consumption, accounting for losses and dividing by solar insolation levels fordeployment region.Determining Load Power Consumption:The first step is to determine how much power the total system load willdraw. Power is measured in Watts:P V I (Joule’s Law)However, the power rating is more useful when looked at in terms of time,this is indeed how electric companies charge consumers. For example a 200Wattlight bulb running for 24 hours uses 4.8 KWh.200Watts 24hrs 4800 Watt Hours or 4.8 KWh7
A list of all devices connected to the system should be made with theirappropriate power draw available from specifications sheets or better yet, actualmeasurements.ComponentPower (Watts)Lenovo S10 (Idle)91Lenovo S10 (Full Processor Hard116.76Drive)Lenovo S10 (30% Duty Cycle)98.73Satellite Router (Idle)53.8Satellite Router (Busy)72.5Est. Typ. Satellite (30% Duty Cycle)59.4117” LCD Screen x 4(20*4) 80Total238.14 WattsFigure 2 Power measurements on 11/11/2008. Note: Headsets, Keyboards & Mice arecurrently not included in calculations because the team is not in possession of them and theirpower consumption should be minimal.Since these devices are designed to plug into AC power, a DC‐AC powerinverter is needed. The power inverter ideally operates at 90% efficiency. Thereforethe maximum inverter draw from batteries is:238 Watts / 0.90 264.60 WattsThis system power draw is then multiplied by the amount of hours per daythat it will operate.264.60 Watts 8hrs/day 2116.80 Watt Hrs/dayTo compensate for system losses during battery charge/discharge cycles thetotal system power consumption is multiplied by a 20% compensation factor(Sunwize).2115.52 Watt Hrs/day 1.2 2540.16 Watt Hrs/day8
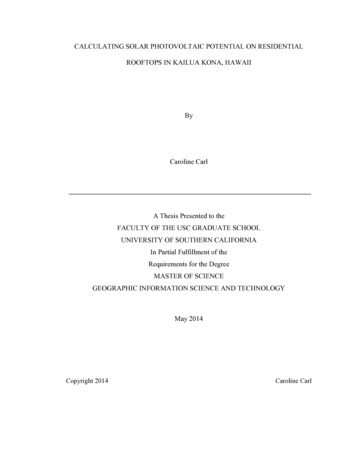
Determining Solar Insolation Levels:In order to determine a good approximation of how much power the PVpanels will output, solar insolation levels need to be considered. Solar insolation isthe amount of incoming solar radiation incident on a surface, for PV applications thesurface of interest is the earth’s surface. The values of solar insolation are commonlyexpressed in kWh/m2/day, which is the amount of solar energy that strikes asquare meter of the earth's surface in a single day. This is commonly referred to as a“Sun‐Hour‐Day”. The amount of insolation received at the surface of the Earth iscontrolled by the angle of the sun, the state of the atmosphere, altitude, andgeographic location.Figure 3 World insulation levels.This map divides the world into six solar performance regions based onwinter peak sun hours.It is important to keep this in mind when designing the system because asseen below in Figure 4, during the winter you have a much smaller ‘Solar Window’.Worst case scenarios should be calculated as it is better to have extra energy in thesummer than not enough in the winter. Therefore the “Sun‐Hour‐Day” values forDecember (since December days are shortest) are generally used.9
Figure 4 Sun path chart.Solar Insolation Levels for Arusha, the prototype deployment area, are seenbelow in Figure 5.Figure 5 Hankins.The compensated total power consumption per day value calculated above isthen divided by the solar insolation values for given deployment region todetermine minimum PV panel array power output requirement:2540.16 Watt Hrs/day / 5.5 461.84 Watts10
Sizing Battery ArrayNearly all large rechargeable batteries in common use are Lead‐Acid type,although there are three variations, flooded, gelled electrolyte (“Gell Cells”) andabsorbed glass matt (“AGM”). Flooded is the oldest and cheapest technology usedbut can be dangerous, in case of a malfunction acid can spill. Gell Cells contain acidthat has been "gelled" by the addition of Silica Gel, turning the acid into a solid mass,therefore even if the battery where cracked open, no acid would spill. Gell batteriesneed to be charged at a slower rate (capacity / 20) but this is not a concern in the PVsetup as the panels will not be outputting nearly this much current. AGM batteriesare the newest technology and have all the advantages of Gell Cells without thecharging limitations.All deep cycle batteries are rated in amp‐hours. An amp‐hour (Amps x Hours)is one amp for one hour, or 10 amps for 1/10 of an hour and so forth. The acceptedAH rating time period for batteries used in solar electric and backup power systemsis the "20 hour rate". This means that it is discharged down to 10.5 volts over a 20hour period while the total amp‐hours it supplies is measured (Windsun).The compensated total power consumption per day value is used again tocalculate minimum battery array size.2540.16 Watt Hrs/12 Volts 211.68 AmpHrs/dayNumber of days of autonomy to support: 1 (8hrs)211.68 1 211.68 AmpHrs“Battery life [deep cycle] is directly related to how deep the battery is cycledeach time. If a battery is discharged to 50% every day, it will last about twice as longas if it is cycled to 80% DOD [depth of discharge]. If cycled only 10% DOD, it will lastabout 5 times as long as one cycled to 50%. Obviously, there are some practicallimitations on this ‐ you don't usually want to have a 5 ton pile of batteries sitting11
there just to reduce the DOD. The most practical number to use is 50% DOD on aregular basis (Windsun).”Depth of discharge for battery: 0.5211.68 / 0.5 423.6 AmpHrsThis means that after 8 hrs of use without sun the battery will be discharged to 50%8 Hrs of autonomy and battery depth of discharge at 0.80 (Half the life‐span of 0.50):264.60 Amp Hrs6 Hrs of autonomy and battery depth of discharge at 0.50:264.6 Watts 6 Hrs 1587.6 Watt Hrs / day 1.2 1905.12 Watt Hrs / day1905.12 Watt Hrs/12 Volts 158.76 AmpHrs142.8 AmpHrs / 0.5 317.52 Amp Hrs4 Hrs of autonomy and depth of discharge at 0.50:238 Watts 4 Hrs 1058.4 Watt Hrs / day 1.2 1270.08 Watt Hrs / day1270.08 Watt Hrs / 12 Volts 105.84 Amp Hrs105.84 Amp Hrs / 0.5 211.68 Amp HrsWire Sizing and Connections:Another important consideration for the system is the electrical wiring. Allwiring needs to safely accommodate the amount of current draw of the system withan acceptable amount of losses. In a DC system losses quickly become an issue. Thisis especially a concern PV systems as they can only handle a small voltage drop asthere must be enough potential to charge the battery array, and of course it is goodpractice to keep energy loss sourced from the sun to a minimum. Generally a 3%drop between PV array and batteries is acceptable. Also, “any type of connectionbigger than AWG 10 should have a proper compression connector, with appropriatejoint compound and preparation. This does require special tools and dies. Otherwise12
you are running the risk of burning up your connections if you get any kind of heavycurrent flowing. (SolarForum)”Losses associated with transmission of DC power:CM (22.2 A D)/VDCM Circular Mills In CopperA current in ampsD one way cable distance in feetVD Voltage Drop22.2 Constant for CopperFor wiring from the PV panels to charge controller the maximum PV shortcircuit current specification (from PV data sheet) is used.Maximum Solar Power Output:24 Volt Systems:ConfigurationMax Current Out (Amps)6 x PW0803 x (5.14A‐ISC) 15.423 x ST‐16520.634 x KY12520.83Figure 612 Volt Systems:ConfigurationMax Current Out (Amps)6 x 80 Watt6*(5.14A‐ISC) 30.843 x PW16541.25Figure 713
Using the loss equation above the following result was obtained for theselected system:Distance: 50ftVoltage Drop: 0.72Current: 15.42 AmpsCircular Mills: 23772.5AWG: 6Inverter to Battery WiringFor current level estimates from the battery to inverter maximum powerdraw levels are used although this distance is generally short and maximumavailable wire gauge is recommended. This is also due to the fact that the systemwill encounter surge currents as various components are ‘turned on’. Since thesystem used as an example here is not continuously running and is to be turned offevery night and back on in the morning this was a serious issue that needed to betested. (Refer to Figure 9).Maximum Power Draw:ComponentPower (Watts)Lenovo S10 (Full Processor Hard Drive)116.76Satellite Router (Busty)72.517” LCD Screen x 4(20 4) 80Total270 WattsFigure 8Assuming the inverter that will be sourced in deployment area is operating at90% efficiency:270 Watts 300 Watts x 90%Maximum current draw in 12 Volt system 300 Watts / 12 Volts 25 AmpsMaximum current draw in 24 Volt system 300 Watts / 24 Volts 12.5 Amps14
Figure 9Figure 9 shows DC current draw as measured during power‐up of LenovoS10 Workstation (custom configuration) and L193p Monitor. Although the system isonly drawing 5 amps while running the surge current spikes are clearly visible. Thisis indeed one of the reasons why proper electrical connections are crucial.DC‐AC InverterSince the computer and monitors are designed to plug into AC power andaccessory plugs for phone charging are a project specification an inverter isnecessary. There are two types of inverters, pure sine wave and modified sine. Mostdevices will work from modified sine, this is what common uninterrupted powersupplies provide and what was selected for this system. It is important to make surethat the inverter is rated to provide enough power for everything running off of it.15
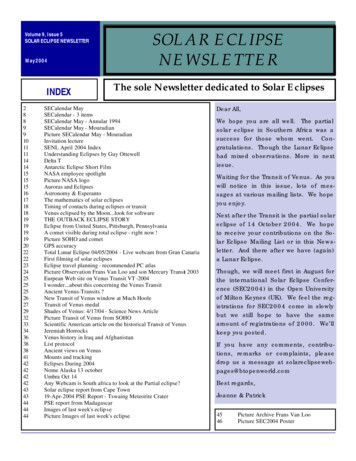
Charge ControllerThe charge controller chosen for this system is the Outback Power FlexMax60. This decision was based on versatility, efficiency, robustness, and availability indeployment area. The Outback can accept a wide range of voltage inputs as well asvarious battery arrays, this was important for this specific system as ultimatelywhatever solar panels are in stock at the time of deployment in the region will beused.Note, the efficiency curves (Figure 10 and Figure 11) are for the Flexmax80,they are identical to the Flexmax60 other than the fact that the FX60 does not accept85 and 100V.Figure 10 Outback charge controller.The highlighted area on the graph represents the highest efficiency whilecharging a 12V battery array. The charge controller is operating at about 95.5%efficiency with an input Voltage between 17‐34V. Typically a 12V PV panel's Voltageat Peak Power is around 17 Volts.16
Figure 11 Outback charge controller.The highlighted area in this graph represents the optimum efficiency if thesystem where charging a 24V battery array. The charge controller is operating atabout 98% efficiency with an input Voltage around 34V. Two 12V panels in serieswill typically have 34 Volt equivalent Voltage at peak power.In an ideal setup the FlexMax 60 would operate at 98.1% efficiency with aninput of 68V while charging a battery array at 48V. This would be the case with theoptimum PV panel chosen in section 1, the Kaneka G‐EA060 as the VPM is 67Volts.ConclusionDesigning an off grid photovoltaic system involves many steps and althoughthe math is simple all calculations should be double checked. If the calculations forone component are off chances are the whole system will not work, every stagerelies on the previous one. Designing the system for worst case scenarios is good17
practice, it is better to have extra energy than not enough. All safety precautionsshould be followed especially on electrical connections that have a possibility ofcarrying a lot of current. Breaker boxes before and after battery connections foreasy power disconnect should be implemented. These breakers should be rated forDC voltages.18
Section 2 ‐ Power ManagementThe core of the power management system is the data‐gathering module. Themodule uses a PIC microcontroller to measure voltages, currents and temperaturesand send the results to the computer via USB.The end result of this system is similar to the power management utility inyour laptop. Just as with a laptop this is a self contained system that will not haveaccess to external power some of the time (when there is no sunlight). We feel thatbecause of the complexity of the multi user computer as well as the photovoltaicsystem we needed to design a system that not only watches battery voltage but alsostores and interprets data for intelligent power decisions.ResearchThe current sensors used are LEM FHS seriessensors. They are Hall effect sensors which operate bymeasuring the electric field produced by the currentcarrying wire. The field is proportional to the current.These current sensors are isolated from the actual powerpath and can be turned off to conserve power. Differentmodels of the sensors are capable of measuring anything from milliamps to over 50amps. The biggest advantage of these sensors is scalability. A single chip can handleany range of current by clever PCB board design. We acquired several sample unitsfrom LEM and put them into small project boxes that can be used anywhere. Theyattach to the power management system via d‐sub cables.Temperature measurements use a small probe, which outputs a voltageproportional to the ambient temperature. We chose the national instrumentsLM335z. These are Zener diodes with a linear internal voltage drop proportional tothe temperature of the device. Our design allows for up to 4 sensors.19
Because the PIC uses a very small amount of power, it is continuouslyoperating to ensure system safety. The PIC is connected to a small LCD screen whichdisplays pertinent information about the condition of the battery and solar panels.Two buttons mounted beside the screen allow a user to scroll through theinformation showing them battery voltage, current, and amp hours remaining. Alsothere will be displays for voltage and current from the solar panel. This informationwill be used to compute time and percent remaining before system power down.There are also three status LED's that inform the user of system power, batterygood, or battery low.The PIC communicates to the computer via USB. This is done using the FTDIUM232R. This device automatically converts the USB signal to a standard serialsignal. It also registers with the computer as being a serial port. With theconnection, the computer can query the PIC about the status of the battery and canshut the system down safely when the battery is low. The computer can also querythe PIC to get real time data on the voltages, currents and temperatures. Theinformation is stored in an XML file and can be easily reprocessed into any fileformat for analysis of the data.Voltage MeasurementsVoltage measurements require the addition of a voltage divider into thecircuit because the PIC has a maximum dynamic range of 5 volts. An advantage ofusing the PIC to measure voltage is that the value of the resistors in the voltagedivider can be accurately measured and the program can use that information toimprove the accuracy of the voltage measurement.The built‐in 10‐bit ADC of the PIC 18F4520 microcontroller is a cheap way tomeasure analog voltages. A drawback is that it is limited to measuring only 0‐5VDC.By adding a voltage divider, customizing the software slightly, and using a digital IOpin as a current sink, we can efficiently and accurately measure much largervoltages.20
Figure 12 Voltage divider with selectable current sink.The 10‐bit ADC on the PIC18F4520 is implemented as an RC circuit inside ofthe PIC. Because of this, there are certain parameters to be aware of, all of whichhave been taken from the PIC18F4520 Datasheet.By adding a voltage divider to the input pin of the PIC, we are now able toscale the input voltage. All that is left is the selection of resistor values. Starting withknown values, we can select vout to be 5V, as that is vref on the PIC. Also, recallingfrom the first section, the nominal input impedance to the PIC is 2.5kΩ, and as suchwill be selected for R2. The node labeled vin is the high voltage input to the voltagedivider, and should be selected as the highest voltage desired to be measured. Forthis example we will say 50V.As can easily found by inspection, the formula for a voltage divider is:vout vin (R2 / (R1 R2))This gives us a formula, three knowns, and one unknown. Solving for R1:R1 R2 vin R2 / voutR1 R2 ((vin / vout) – 1)R1 2.5kΩ ((50V / 5V) – 1) R1 22.5kΩWe can now build our new voltage divider and accurately measurevoltages up to 50V! To convert the ADC result to actual voltage, the followingequation is now used:van0 ((VDD ADC output) / 1023) (R2 / (R1 R2))21
Control BoardThis is the schematic and for the control board. It is mounted behind thecontrol panel and connects directly to the LCD header. There are headers forconnection to the status LEDs as well as the control buttons. A ribbon cable connectsthis board to the rest of the circuitFigure 13 – LCD control board schematic.Power Management BoardThis circuit allows connection of up to 4 current sensors, 4 temperatureprobes, and 4 independent voltages. The voltage inputs have a voltage dividercircuit that can be configured to accept voltages for systems running at 12, 24, or 48volts. A USB connection allows data sharing with the computer.22
Figure 14 Power system monitor schematic.ConclusionOur power management system performs as it was designed to. Eachchannel accurately reads a voltage from the sensor and converts the voltage to avalue. The PIC then uses this information and displays this information clearly onthe LCD panel. Both boards are mounted in an enclosure with connectors for eachsensor. The board will be mounted in the main enclosure and will allow a user toturn of the entire system with the touch of a button. The sturdy PCB design andconstruction will stand the test of time. The PCB board also allows for on sitereprogramming if it is deemed necessary.23
Figure 15 Power system monitor and faceplate.24
Section 3 ‐ Multi Seat System Hardware and SoftwareThe primary goal of this project is to help promote education in developingcountries by providing grade schools with electronic resources. There are a varietyof other groups that have already initiated solutions to this problem. The mostprominent group is the One Laptop Per Child Association (hereinafter referred to asOLPC), which has created a cheap, durable laptop known as the XO‐1. Other groupssuch as the Center for Scientific Computing and Free Software (hereinafter referredto as C3SL) have made significant strides in reusing older computers for schools;however, both of those programs have some significant drawbacks.The primary competitor identified is the OLPC. The OLPC Association is dedicated toproducing low cost laptops and distributing them to low‐income areas. There existseveral problems with the program, including the per‐deployment cost anddeployment into rural areas. The original intent was to deliver a laptop to everychild for a cost of 100 per device. The program, however, is unable to deliver thelaptop at the 100 target; in fact, the cost to donate a system is almost 200.Deployments also require a minimum commitment of 100 laptops. This represents avery significant financial burden, though once deployed, it is difficult to integratemultiple PCs into a cohesive learning environment, and this takes away fromeducating the students. However, the XO‐1’s are extremely rugged PCs and do notdepend on any external power sources except to charge the batteries.C3SL’s solution integrates into school systems better, and was widelydeployed in the Paraná Digital project. This project involved having multipleterminals running off of a single computer in multiple schools. This program hasbeen very successful and shows great promise, but there is a critical flaw. Theprogram is entirely software, and this software was intended to run in a classroomequipped with basic utilities, such as power and internet connectivity.Our solution was to integrate the OLPC's ruggedness and the C3SL's no
There are many types of solar systems but most can be categorized into a variation of the following: A “grid‐tie” system where there are no batteries and the power grid provides back‐up power. A hybrid “grid‐tie” system where the power grid provides back‐up for the