Transcription
CHALLENGES IN SIX SIGMAIMPLEMENTATIONJAKARTA, DECEMBER 7TH, 2017WESTGARD QC, INC1STEN WESTGARD, MS
WHY LISTEN TO THESE GUYS?Son knows better?“The” Westgard“A” Westgard 40 years at theUniversity of Wisconsin “Westgard Rules” Method Validation Critical-Error graphs OPSpecs 25 years atWestgard QC Publishing Web Blog course portal3Father knows best!
WHY TAKE ADVANTAGE OFWESTGARD WEB?Blog:Website: 56,000 members 3 million viewsCourse Portal: 600 essays,Training in QC, Method Validation,lessons,Risk Analysis, Quality ManagementQC case studies,reference, resources4 400 Short articlesQ&A
WHY WORRY ABOUT QCAND QUALITY? Manufacturer SD used for control limits6 All data within 2 SD. Too good to be true!
POOR QC POOR PATIENT CAREClinicalconsequences oferroneouslaboratory resultsthat wentunnoticed for 10daysTse Ping Loh, Lennie Chua Lee,Sunil Kumar Sethi et al. J ClinPathol March 2013, Vol 166,No.3 260-261 1 test error 5 tests in error7 63 results in error
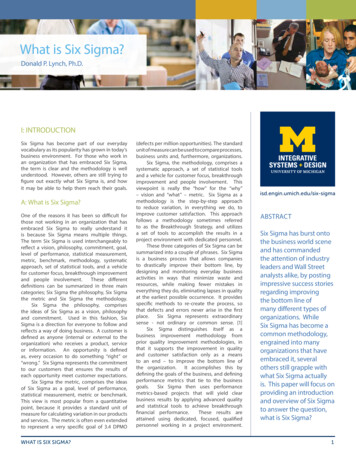
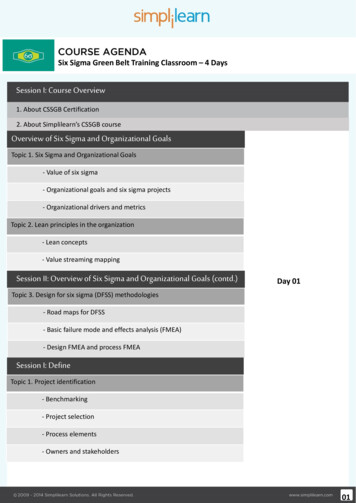
THE RIGHT QC COULD HAVECAUGHT THE ERRORS49 patients Affected 4 procedures ordered in error(including CT Scan) 7 patients ordered for retesting 6 misdiagnosesControl 2 ValuesControl 1 Values4433221100-1-1-2-2-3-3-4-481 2 3 4 5 6 7 8 9 101112131415161718192021222324252627282930 1 2 3 4 5 6 7 8 9 101112131415161718192021222324252627282930
STAYING IN COMPLIANCE DIDN’TKEEP THIS LAB (AND ITSPATIENTS) OUT OF TROUBLECAP certifiedJCI certified 2004Singapore Service Class award 2004ISO 15189 certifiedTriple ISO certification ISO 9001 ISO 14001 ISO 18001Awards and Awards and Awards 9We need Detailed QC HELP!
WE MUST WORRY NOT ONLY ABOUTBAD QC – ALSO BAD METHODSFor 2 YEARS, Mayo Clinic: about 5% of all IGF-1tests were false positives.“If the Mayo Clinic observations are generalized,a laboratory performing 1000 IGF-1 tests/monthwould be expected to generate around 50 falsepositive results each month. Some of these canbe expected to lead to follow-up appointments orfurther testing and, ultimately, increased financialburden and anxiety for patients.”10UVA: 8-month period in 2011, “20 abnormally highIGF-1 results in 17 patients that did not agree withclinical findings. In 17 of the 20 samples, the IGF1 concentrations measured by a massspectrometric method were within referenceintervals. In 7 of the patients, expensive growthhormone suppression tests were done; the resultswere within reference intervals in 6, with the resultin the seventh nondiagnostic.”
2015: CLEVELANDCLINICCATASTROPHE 769,000 fine levied on ClevelandClinic Marymount HospitalSeptember 2015Failing to run QCUsing expired reagentPT/EQA cheatingLab closed for 4 months, 2weeks; lab director fired CAP inspection in December2014 missed these problems 16[P]atients in "immediate jeopardy,"CMS says Cleveland Plain Dealer"Cobas 6000 Instrument Printouts: KB2014: Sample K-06: .e) Date: 07/27/14 12:54:53Handwritten notes stated:"COBAS 1“ "RERUN"The ID number 6 and date and timewere circled. The word rerun wasunderlined twice. Each numeric resultslisted below had a checkmark to left.Folate, Seru 1.50 ng/mLFerritin 12.67 L ng/mLFree T4 0.591 L ng/dLQuant Beta H 10.40 H miU/mLTSH 0.077 L uIU/mLVitamin B12 66.07 L pg/mLT4 3.32 L ug/dLFT3 III 3.82 pg/mL"
WHY WORRY ABOUT A LACKOF TRUENESS IN ALKALINEPHOSPHATASE?InstrumentLow BiasMed BiasHigh Bias1 Cobas 6000-7.2-9.0-9.62 Cobas 6000-5.4-5.9-7.03 AU 58005.96.65.84 Cobas 8000-5.2-6.8-8.65 Cobas 6000/8000-3.0-4.0-5.16 AU 6804.45.63.17 AU 68008.68.34.38 AU 58006.37.45.99 ADVIA-2.3-2.9-4.510 Cobas 8000-5.0-5.6-6.811 Cobas 8000-5.8-6.8-8.612 Vista-6.1-1.4-2.013 ARCHITECT c160002.3-1.0-0.617Evaluation of the trueness of serum alkaline phosphatase measurement in a group of Italianlaboratories, CCLM 2016: aopBraga F, Frusciante E, Infusino I, Aloisio E, Guerra E, Ceriotti F, Panteghini M
WHY WORRY ABOUT A LACKOF TRUENESS IN 5 COMMONIMMUNOASSAYS?MethodAbbott ARCHITECTBeckman CoulterUnicelRoche CobasSiemens ADVIACentaurCobalaminMeets GoalFails GoalMeets GoalMeets GoalFolateMeets GoalMeets GoalMeets GoalMeets GoalFerritinMeets GoalFails GoalFails GoalFails GoalTSHMeets GoalMeets GoalFails GoalMeets GoalFree T4Fails GoalFails GoalFails GoalMeets GoalFree T4 (reference)Fails GoalFails GoalFails GoalFails Goal18Analytical Bias Exceeding Desirable Quality Goal in 4 out of 5 Common Immunoassays: Resultsof a Native Single Serum Sample External Quality Assessment Program for Cobalamin, Folate,Ferritin, Thyroid-Stimulating Hormone, and Free T4 AnalysesClin Chem 62:9 1255-1263 (2016)Kristensen GBB, Rustad P, Berg JP, Aakre KM
WHY ISN’T THE FDA (ORSOMEONE) PROTECTING THEPATIENT FROM POOR QUALITY?“Conclusion 7-1. The 510(k) clearance process is notintended to evaluate the safety and effectiveness of medicaldevices with some exceptions. The 510(k) process cannot betransformed into a premarket evaluation of safety andeffectiveness as long as the standard for clearance issubstantial equivalance to any previously cleared device.”19Institute of Medicine 2011: Medical Devices and the Public’shealth: the FDA 510(k) Clearance Process at 35 years,prepublication copy
WHY IS THERE A GAPBETWEEN CERTIFICATIONSAND TRUE QUALITYASSURANCE?Systems without specificsPolicies without performance dataAspirations without Achievement?Assumptions that all tests are the same20If we have a quality system without a quality method,without quality practices, are our patients really safe?
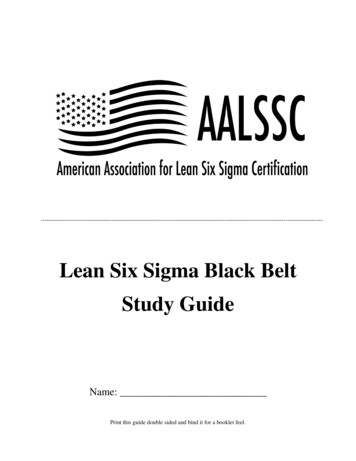
WHERE DO WE START WITHSIX SIGMA? THE CONCEPTSDefects Per Million (DPM)Scale of 0 to 6(Sigma short-term scale)23 3 Sigma is minimum for any business ormanufacturing process(66,807 dpm)456 World Class Performance (3.4 DPM)
HOW DO WE IDENTIFY THEPERFORMANCE SPECIFICATION?Total Allowable Errors(TEa) PT/EQA groups CLIA RCPA Rilibak Biologic VariationDatabase “Ricos Goals” SIGMA VP PROGRAM24http://www.westgard.com/biodatabase1.htm
HOW DO WE SELECT THE RIGHTPERFORMANCE SPECIFICATION?November 2014: Milan Meeting DraftMilan Consensus 2015 1: Outcome-based, Clinical Use Goals(HbA1c NGSP guidance) 2: Biologic-based, “Ricos Goals” 3: “State of the Art” (CLIA, Rilibak, EQA/PT)25 Different analytes will get goals from Different models. “Ricos Goals” are not practical for all tests! In the future, manyof these goals will become unreachable Supposedly not a hierarchy – merely different models
AnalyteRecommended Total AllowableError Goal (TEa %)10%TEa SourceAlk PhosALTAmylaseASTBilirubin, Direct30%20%30%20%44.5%CLIACLIACLIACLIARicos DesirableBilirubin, Total0.4 mg/dL or 20% (greater)(6.84 umol/L or 20%)1 mg/dL(0.249 mmol/L)5%10%CLIA25%30%0.3 mg/dL or 15% (greater)(26.41 umol/L)22.11%6 mg/dL or 10% (greater)(0.33 mmol/L)30%20%20%CLIARecommended Critical DecisionLevelNear 2.5 g/dLor 25 U/LNear 150 U/LNear 95 U/LNear 145 U/LNear 40 U/LNear 0.3 mg/dLor 5.13 umol/LNear 3.0 mg/dLor 51.3 umol/LNear 13.0 mg/dL or 3.24 mmol/LCLIACLIANear 100 mmol/LNear 180 mg/dL or 4.68 mmol/LCAP PTCLIACLIANear 25 mmol/LNear 275 U/LNear 2.0 mg/dL or 176 umol/LRicos DesirableCLIANear 85 U/LNear 120 mg/dL or 6.66 mmol/LCLIACLIACLIANear 50 mg/dL or 1.23 mmol/LNear 75 mg/dL or 13.4 umol/LNear 100 mg/dL or 2.59 mmol/L20%37.88%25%CAPRicosCAPNear 170 U/LNear 45 U/LNear 2.5 mg/dL or 1.02 mmol/LCAPNear 4.0 mg/dL or 1.29 mmol/LPotassiumTotal Protein0.3 mg/dL or 10.7% (greater)(0.1 mmol/L)0.5 mmol/L10%CLIACLIASodiumTriglycerides4 mmol/L25%CLIACLIANear 2.5 mmol/LNear 5.7 g/dLor 57 mg/dLNear 115 mmol/LNear 130 mg/dL or 1.46 mmol/LUrea Nitrogen2.0 mg/dL or 9% (greater)(0.714 mmol)17%CLIANear 40 mg/dL or 14.28 mmol/LCLIANear 3.3 mg/dL or 196.3 ne Kinase umPhosphorousUric AcidCLIA26A CONSENSUS ANSWER:SIGMA VP ESTABLISHESGLOBAL TEA GOALS
HOW DO WE MEASURE (SIX)SIGMA PERFORMANCE?Measure Variation – Use existing data Can we measure imprecision (CV)? Can we measure inaccuracy (bias)?27 Capture this data at critical medicaldecision levels
HOW DO YOU GET THEBEST CV AND BIAS?Imprecision 3 months or longer, third party controls, original manufacturer reagentBias Your mean vs Peer group mean Your mean vs EQA/PT group mean Your mean vs the Package Insert/Target mean28 (Ideal but generally impractical: vs reference mean)
HOW DO YOU ACTUALLYCALCULATE SIGMA METRIC?Sigma-metric (TEa – Bias)/CV- TEa TEaTrue ValueBiasCVdefects29-6s -5s -4s -3s -2s -1s 0s 1s 2s 3s 4s 5s 6s
How do you select theappropriate level for Sigma? 3 levels of cholesterol method, Clin Chem July 2014 CLIA PT criterion for acceptability 10%Total Precision (CV):1.0%0.9%Bias :3.0%2.5%Sigma (10 – 3) / 1.0 7.0 / 1.0 7.0Sigma (10-2.5) / 0.9 7.5 / 0.9 8.3Sigma (10 – 2.3) / 1.0 7.7 / 1.0 7.71.0%2.3%Average Sigma (7.0 8.3 7.7) / 3 7.67
COMPARISON OF6 COMPETITORS ON 8CHEMISTRY ANALYTES 20 patient serum samples Comparison against referencemethods or all-method-trimmed-mean“Additionally, large laboratory effectswere observed that causedinterlaboratory differences 30%.”“There is a need for improvementeven for simple clinical chemistryanalytes. In particular, theinterchangeability of results remainsjeopardized by assay standardizationissues and individual laboratoryeffects.”
SIGMA EVALUATIONOF .06Phosphate6.676.7103.464.82n/aUric 214.1818.158.328.02Average Sigma-metric calculated of 3 levels measuredApproximately 10 labs for each instrumentCLIA goals used
STANDARDIZATIONCONCLUSION Given conditions: achieving 6-Sigma performance orhighest performance among competitors:–Abbott: 6 of 8 analytes–Beckman: 4 of 7 analytes–Ortho: 3 of 7 analytes–Roche: 3 of 8 analytes–ThermoFisher: 3 of 7 analytes–Siemens: 2 of 8 analytes
36HOW DO YOU ASSESS SIGMAMETRIC VISUALLY?
2013 CS-6400 CHEMISTRYANALYZERAssayTEaAlbuminAlk PhosASTALTAmylaseBilirubin, DirectBilirubin, TotalCalciumCholesterolCreatinineKinase PhosphateTotal %10%Level 3%1.7%0.9%2.0%1.8%5.0%Urea Nitrogen9%13.53Uric .40.58140.138.6Level 233.50%38Evaluation of the CS-6400 Automated Chemistry Analyzer. Hyo-Jun Ahn, Hye-Ryun Kim, and YoungKyu Sun, J Lab Med Qual Assur 2013;35:36-46.
39DISPLAY OF SIGMA-METRICS:NORMALIZED METHOD DECISIONCHART (26 TESTS)
4027 rtance of implementing an analytical quality control system in acore laboratory, Marques-Garcia F, Garcia-Codesal F, del Rosario Caro-NarrosM, Contreras-San Feliciano T, Revista de Caldidad Asistencial 2015 NovDec;30(6):302-9.
SMALL VOLUME CHEMISTRYANALYZERKern ValleyHospitalDistrict92% ofassaysSodiumPotassiumChlorideCreatinineTotal ProteinAlbuminAlk PhosALTASTTotal BilirubinDirect BilirubinAmylaseLipaseCKPhosphorusIronUric AcidCholesterolTriglyceridesHDL4823 of 25testsare 5Sigma(25 methods) 6 Sigma:
HOW DO YOU USE THE SIGMAMETRIC TO IMPROVE YOUR LAB?THE OPSPECS CHART49Free download at http://www.westgard.com/normcharts.html
OPSPECS QC DESIGN FORCS-6400 ANALYZER
51COBAS 8000 QC DESIGN
53QC DESIGN FOR KERNVALLEY
SIX SIGMA IS AN INCREASINGLYIMPORTANT TECHNIQUE FORLABS AROUND THE WORLD IFCC committee on HbA1c standardization recommends Six Sigma asthe way to judge assay quality.Clin Chem. 2015 May;61(5):752-9. doi: 10.1373/clinchem.2014.235333. Epub 2015 Mar 3.Investigation of 2 models to set and evaluate quality targets for hb a1c: biological variation and sigma-metrics.Weykamp C1, John G2, Gillery P3, English E4, Ji L5, Lenters-Westra E6, Little RR7, Roglic G8, Sacks DB9, Takei I10; IFCC Task Force onImplementation of HbA1c Standardization. IFCC / EFLM committee on Pre-analytical and Post-analytical QualityIndicators recommends benchmarking on the Sigma scaleClin Chem Lab Med. 2015 May;53(6):943-8. doi: 10.1515/cclm-2014-1124.Performance criteria and quality indicators for the pre-analytical phase.Plebani M, Sciacovelli L, Aita A, Pelloso M, Chiozza ML. Collective Opinion Paper 2013/2015 in Australian recommends adoptionof Six Sigma metricsCollective Opinion Paper on a 2013 AACB Workshop of Experts seeking Harmonisation of Approaches to Setting a Laboratory Quality ControlPolicy Graham Jones John Calleja Douglas Chesher Curtis Parvin John Yundt-Pacheco Mark Mackay Tony BadrickClin Biochem Rev 36 (3) 2015 Belgian EQA program offers Sigma-metrics to their participantsClin Chem Lab Med. 2017 Feb 9. pii: 70.xml. doi:10.1515/cclm-2016-0970. [Epub ahead of print]Expressing analytical performance from multi-sample evaluation in laboratory EQA.Thelen MH, Jansen RT, Weykamp CW, Steigstra H, Meijer R, Cobbaert CM.Sigma-metrics calculated by Bio-Rad, Randox, MAS, and Technopath63
HOW DOES IT IMPACT OURDECISIONS? IFCC COMPARISONOF MAJOR HBA1C METHODSBias assessed usingAccuracy-based materialsacross 8 levels of HbA1cPerformance comparing Tosoh Bio-Rad Variant Turbo 2.0 Roche64 ARCHITECT enzymatic
65HBA1C SIX SIGMAPERFORMANCE
66HOW TO QC HBA1C
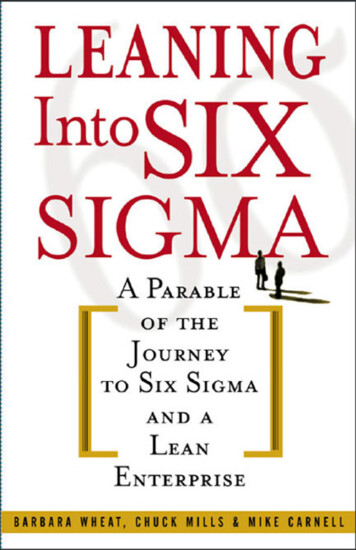
UNDERSTANDING THE IMPACT OF LABORATORY PERFORMANCE ON OUTCOMES IN A SCREENINGWu L1, Jülicher P2, Liu L3POPULATION FOR CARDIOVASCULARDISEASE IN TAIWAN1ChiMeiMedical Center, Tainan, Taiwan; 2Abbott Diagnostics, Wiesbaden, Germany; 3ChiMei Medical Center, Health Management Center, Tainan, TaiwanISPOR 7th Asia-Pacific Conference, 3-6 September 2016, SingaporeIntroductionRisk scores for cardiovascular disease (CVD) events based on laboratory values have been established in primary prevention programs [1]. The performance of laboratory test systems may lead to discordant treatment decisions in some cases.The goal of this study was to investigate the impact of laboratory diagnostic system performance on outcomes in a screening population for CVD in Taiwan.MethodsData were collected from 1,396 people (Age 40 years) enrolled for CVD screeningbetween January and April 2015 in Tainan (Table 1).A time-to-event microsimulation model was developed (Figure 1). Starting with screening,each individual was classified into risk categories based on observed values for LDL-,HDL-, total cholesterol, and a 10-years CVD risk score. Patients with observed values ofLDL 190mg/L, 70 LDL 190 and a risk score 7.5%, and diabetic patients with LDLbetween 70 and 190 plus a risk score between 5 and 7.5% were referred for treatment.They received lipid lowering drugs thus reducing risk for a CVD event. Individuals notassigned to treatment remained in the “No treatment”- state until the next screening cycleafter 1-4 years, the occurrence of a CVD event, or death.Minimum and optimum test specifications as suggested in literature were tested against acontrol scenario assuming perfect performances (Table 2).Samples were bootstrapped from the cohort with 100,000 iterations. Model followed alifetimehorizonandofacomparinghealth strategiessystem perspective. Results were expressed in costs, qualityTable 2. TestperformanceTotaland-CHDL-CLDL-C Model was tested in 1adjusted life-years (QALY),relative overor under-treatment.StrategyBias, %CV, %Bias, %CV, %Bias, %CV, % Sourceway and probabilistic sensitivity analysis.Mimimun (MIN)Optimum (OPT)Control 5.92.90.0VariableSex (% women)Age, years*BMIPulseBPSys (mmHg)BPDia (mmHg)GLUC FASTTCHOL (mg/dL)HDL-C (mg/dL)LDL-C (mg/dL)Table 1.Characteristics ofscreening cohort(n 1,396)Mean (SE)35.952.9 (40-85)24.2 (0.1)72.9 (0.3)116.5 (0.5)74.2 (0.3)100.8 (0.8)202.2 (1.0)54.7 (0.4)132.1 (0.9)VariableValueSetting, risk & eventsCVD risk (10 years)In-hospital mortality from strokeIn-hospital mortality from AMIMortality from stroke at 1 year, %Mortality from MI at 1 year, %Mortality (non-CVD)Annual risk for recurrent CVD, %Risk reduction under treatment, % (95%CI)CVD event type (Stroke vs. MI), %Smoking prevalence Male, % (95%CI)Smoking prevalence Female, % (95%CI)Laboratory resultsScreening cycle, yearsUtilityBaselineLipid lowering treatment, Mean (SD)MI (disutility), Mean (SD)Stroke (disutility), Mean (SD)Post MIPost strokeCosts, NT 1,2Screening & visitPermanent lipid lowering treatmentStrokePost-strokeMIPost MIFigure 1. Time-to-event microsimulation model structureAnnual discount rate for costs and utility, %DistributionSourceRisk based ][3][2][4]Age-, sex-specific lifetableWeibull[5]6.8Weibull[4]65 (58, 73)Uniform[6]7631 (28.0, 35.2)3.4 (2.8, 4.2)Mean from cohort1 to [12][13][14][15][14]0.9360.934 (0.001)0.080 (0.048)0.242 (0.039)0.799 (0.010)0.576 e 3. Model input assumptions.(1) All costs adjusted for inflation with a 3% rate to 2015 New Taiwan dollar.(2) A range of 25% was used to create upper and lowerbounds.[16,17]AssumptionResultsResults in terms of incremental values compared to the controlscenario are summarized in Table 2.Figure 2. Incremental costs and QALY per strategy compared to theControl.Microsimulation with 100,000 samples. Mean, 95%CI of Δ Costs per patient,and Δ QALY per 1,000 subjects.Analytical measurement uncertainty caused by CV and bias resultedin discordant management in some cases. The MIN and OPTstrategy led to different decisions in 14.1% and 4.1%, respectively.Patients who had not received preventive treatment based onerroneous results had a higher risk for CVD events at an earliertime. The observed strategies showed a small but significantlyper1,000 subjects43,events220), whereasa non-significanttrend was observed for the OPT performance. Loss inincreasednumber (95%CIof CVDand CVDrelated increasedcomparedto thefromcontrol.MIN resultedin a lossof lifeyears(LY) ofrisk for events, or increased mortality was found to besignificantforsubjectsMIN but not for OPT.131 p. 1,000CVD related life-time costs were significantly higher compared to CON for MIN ( NT 8,753) and OPT ( NT 2,075).Table 2. Incremental results from microsimulation.Minimum strategy (MIN), Optimum strategy (OPT), Control strategy (CON) as defined in Table 2. *Per 1,000 individuals screened.MIN vs. CONOPT vs. CONOutcome valueMean(95%CI)MeanΔ Costs per patient, NT 8753(7516; 9990)207595%CI(844; 3307)MIN vs.OPTMean95%CI6678Conclusions Analytical measurement uncertainty may impose a higher risk for missing prevention opportunities.-56(-96; systems-17)(-60; 18)-36 Δ QALY*The selection of high performancediagnosticplus-21a strict qualitycontrol managementinthe laboratory conforming to the optimum specification is critical to consistently providing high andefficient quality of care.Δ Total LY*Limitations-131(-220; -43)-33(-122; 55)-98Results are limited to the information derived from the cohort. Risk scores may not accurately estimate the actual risk. Patient characteristics weresampled from distributions in order to reflect variability and uncertainty. The model assumed a stable lipid status over the time span of thesimulation.AcknowledgementWe thank Roger Low and Sten Westgard for motivation and fruitful discussions.(5440;7916)75;3)(187;10)(The “Minimum” and “Optimum” strategy led to higher costscompared to the Control for 32% and 27%, respectively (Fig. 3).As revealed from a sensitivity analysis, for each increase inpercent point of CV, negative or positive bias 22, 43 or 7individuals per 1,000 screened subjects would be either over- orunder-treated compared to the control (Fig. 4, Tab. 3). Negativebias particularly increased the risk for denying preventivetreatment, and would affect six times more patients than positivebias.Incremental costs per patients caused from discordantmanagement decisions and related consequences would accrueTable 3. Impact of CV and bias on over- and under-treated individuals, and incrementalto NT 786 (96%CI 734;838), NT 762 (612;912) and NT 699costs.(668;729)per percentin regressionnegativebias,positivebias andOT/UT: Over-/Under-treated;Dataincreasebased on linearmodel.Sensitivityanalysesassumedperfect %CV or (95%CI)R-Sq, %(-) bias( ) biasΔUT, per 1,000 subjects43.3(40.6; 45.9)ΔCosts, NT 786(734;838)ΔOT, per 1,000 subjects6.5(5.6;7.3)Figure 3. Distribution of incremental costs (IC) per strategy.Figure 4. Impact of increasing Bias and CV on discordant treatments.OT: Over-treated; UT: Under-treated. No significant deviation from the Controlstrategy was observed for both, the number of individuals over-treated withincreasing negative bias, and the number of individuals under-treated withincreasing positive biasReferences1. Stone NJ, Robinson JG, Lichtenstein AH, et al. 2013 ACC/AHA guideline on the treatment of blood cholesterol to reduce atherosclerotic cardiovascular risk in adults. Circulation.2014;129(25 Suppl 2):S1-45.2. Lee HC, Chang KC, Huang YC, et al. Readmission, mortality, and first-year medical costs after stroke. JCMA. 2013;76(12):703-714.ΔCosts,762(612; 912)and in-hospital mortality of acute myocardial infarction over 15years in a Taiwanese population. Int J3. Yin WH, Lu TH,Chen NT KC, et al. The temporal trends of incidence,treatment,Card. 2016;209:103-113.4. Chiang FT, Shyu KG, Wu CJ, et al. Predictors of 1-year outcomes in the Taiwan Acute Coronary Syndrome Full Spectrum Registry. J Formos Med Assoc. 2014;113(11):794-8025. Ministry of Interior, Department of Statistics, Taiwan. Liftetable 2013. .htm. Accessed May 18, 2016.ΔUT,M,perMacedo1,000 subjects10.2 prevention(9.8;10.6)6. CVTaylor F, HuffmanA, et al. Statins for the primaryof cardiovascular disease. The Cochrane database of systematic reviews. 2013(1).7. Cheng CL, Chien HC, Lee CH, Lin SJ, Yang YH. Validity of in-hospital mortality data among patients with acute myocardial infarction or stroke in National Health Insurance ResearchDatabase in Taiwan. Int J Card. 2015;201:96-1018. Ng M, Freeman MK, Fleming TD, et al. Smoking prevalence and cigarette consumption in 187 countries, 1980-2012. JAMA. 2014; 311(2):183-92.ΔOT,per 1,000 subjects12.1(11.8;12.5)9. Kang EJ, Ko SK.A catalogueof EQ-5D utility weights forchronic diseasesamong noninstitutionalized community residents in Korea. Value Health. 2009;12 Suppl 3:S114-117.10.Pandya A, Sy S, Cho S, Weinstein MC, Gaziano TA. Cost-effectiveness of 10-Year Risk Thresholds for Initiation of Statin Therapy for Primary Prevention of Cardiovascular Disease.JAMA. 2015;314(2):142-150.11.Lin YK, Chen CP, Tsai WC, Chiao YC, Lin BY. Cost-effectiveness of clinical pathway in coronary artery bypass surgery. J Med Sys. 2011;35(2):203-213.ΔCosts,69912.Cobiac LJ, MagnusA,NT Barendregt JJ, Carter R, Vos T. Improvingthe(668;729)cost-effectiveness of cardiovascular disease prevention in Australia: a modelling study. BMC Public Health.2012;12(389).13.Lien HM, Chou SY, Liu JT. Hospital ownership and performance: evidence from stroke and cardiac treatment in Taiwan. J Health Econ. 2008;27(5):1208-1223.14.Chung CW, Wang JD, Yu CF, Yang MC. Lifetime medical expenditure and life expectancy lost attributable to smoking through major smoking related diseases in Taiwan. Tob Control.
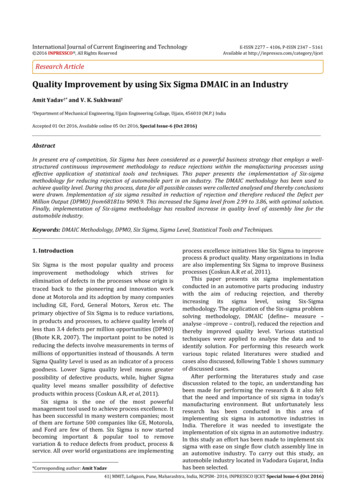
HEALTH ECONOMICS OUTCOMESOF OPTIMAL SIX SIGMA QUALITY“A time-to-event microsimulation model was developed . Starting withscreening, each individual was classified into risk categories based onobserved values for LDL-, HDL-, total cholesterol, and a 10years CVD risk score. Patients with observed values of LDL 190mg/L,70 LDL 190 and a risk score 7.5%, and diabetic patients with LDLbetween 70 and 190 plus a risk score between 5 and 7.5% were referred fortreatment. They received lipid lowering drugs thus reducing risk for a CVDevent. Individuals not assigned to treatment remained in the “Notreatment”- state until the next screening cycle after 1-4 years, theoccurrence of a CVD event, or death.“Minimum and optimum test specifications assuggested in literature were tested against a controlscenario assuming perfect performances .were expressed in costs, quality adjusted life-years(QALY), and relative over- or under-treatment. Model wastested in 1-way and probabilistic sensitivity ”78“Samples were bootstrapped from the cohort with 100,000 iterations. Modelfollowed a lifetime horizon and a health system perspective. Results
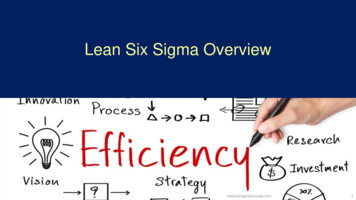
HOW SIX SIGMA METHODSIMPACT QC AND PATIENTOUTCOMES“The “Minimum” and “Optimum” strategy led tohigher costs compared to the Control for 32%and 27%, respectively (Fig. 3).“As revealed from a sensitivity analysis, foreach increase in percent point of CV, negativeor positive bias 22, 43 or 7 individuals per1,000 screened subjects would be eitherover- or under-treated compared to thecontrol .Negative bias particularly increasedthe risk for denying preventive treatment, andwould affect six times more patients thanpositive bias.(96%CI 734;838), NT 762 (612;912) andNT 699 (668;729) per percent increase innegative bias, positive bias and CV,respectively ”79“Incremental costs per patients caused fromdiscordant management decisions and relatedconsequences would accrue to NT 786
HOW SIX SIGMA METHODSIMPACT QC AND PATIENTOUTCOMESResults in terms of incremental values compared to the control scenario are summarized in Table 2.Analytical measurement uncertainty caused by CV and bias resulted in discordant management in some cases.The MIN and OPT strategy led to different decisions in 14.1% and 4.1%, respectively. Patients whohad not received preventive treatment based on erroneous results had a higher risk for CVD events at an earliertime. The observed strategies showed a small but significantly increased number of CVD events and CVD relateddeaths compared to the control. MIN resulted in a loss of life years (LY) of 131 p. 1,000 subjects(95%CI 43, 220), whereas a non-significant trend was observed for the OPT performance. Loss inQALY resulting from unnecessary treatment, earlier and increased risk for events, or increased mortality wasfound to be significant for MIN but not for OPT.Figure 2. Incremental costsand QALY per strategycompared to the Control.Microsimulation with 100,000samples. Mean, 95%CI of ΔCosts per patient, and Δ QALYper 1,000 subjects.80CVD related life-time costs were significantly higher compared to CON for MIN ( NT 8,753) andOPT ( NT 2,075).
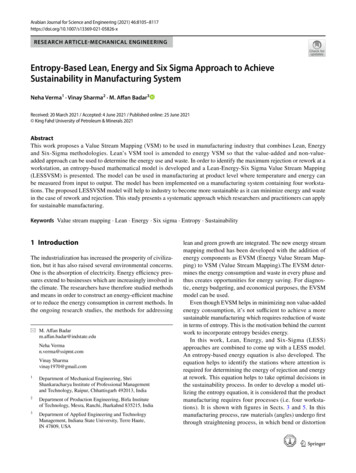
CLINICAL IMPACT SIMULATIONMATCHES HEALTH ECONOMICSTUDY RESULTSMethod differences result in riskSCORE l/LMen RiskSCOREWrongclassSCORE 7915.3-0.245.271%81‘Laboratories supporting lipid clinics with a high proportion of specimens with atypical lipoproteins could observediscrepant results on certain specimens that might confound treatment decisions’ .“It is vitally important for clinicallaboratories to consider assay reliability and specificity when choosing methods, particularly in dyslipidemic samples.”
CONCLUSIONSix Sigma Implementation is not Simple, but it can be SimplifiedUse the Westgard Six Sigma tools to allow the laboratory to Identify the RIGHT method Select the RIGHT rules Run the RIGHT number of controls100 Run the controls at the RIGHT time and frequency – next!
HOW DO WE MAKE THESIGMA IMPLEMENTATIONEASIER TO IMPLEMENT?101SIGMA VP PROGRAM
THANK YOU FOR YOUR KINDATTENTION! (QUESTIONS?)102westgard@westgard.com
SIX SIGMA? THE CONCEPTS Defects Per Million (DPM) Scale of 0 to 6 (Sigma short-term scale) 6 5 4 3 2 World Class Performance (3.4 DPM) 3 Sigma is minim