Transcription
VascularTechnologyAn Illustrated Review5th EditionClaudia Rumwell, RN, RVT, FSVUMichalene McPharlin, RN, RVT, RVS, FSVUSPECIALISTS IN ULTRASOUND EDUCATION,TEST PREPARATION, ANDCONTINUING MEDICAL EDUCATION
ivSPECIALISTS IN ULTRASOUND EDUCATION,Copyright 2015 by Davies Publishing, Inc.TEST PREPARATION, ANDCONTINUING MEDICAL EDUCATIONAll rights reserved. No part of this work may be reproduced, stored in a retrieval system, or transmittedin any form or by any means, electronic or mechanical, including photocopying, scanning, and recording, without prior written permission from the publisher.Michael Davies, PublisherDavies Publishing, Inc.Specialists in Ultrasound Education,Test Preparation, and ContinuingMedical Education32 South Raymond AvenuePasadena, California 91105-1961Phone 626-792-3046Facsimile 626-792-5308e-mail harlene Locke, Production ManagerChristina J. Moose, Editorial DirectorJanet Heard, Operations ManagerDaniel Liota, Digital MediaSatori Design Group, Inc., DesignDenise Eggman, IllustrationStephen Beebe, IllustrationNotice to Users of This Publication:In the field of ultrasonography, knowledge, technique, and best practices are continually evolving. With newresearch and developing technologies, changes in methodologies, professional practices, and medical treatmentmay become necessary.Sonography practitioners and other medical professionals and researchers must rely on their experience andknowledge when evaluating and using information, methods, technologies, experiments, and medicationsdescribed herein, always remaining mindful of their own, their patients’, their coworkers’, and others’ safety andwell-being.Regarding any treatments, procedures, technologies, and/or pharmaceutical products identified, users of thispublication are advised to check the most current information provided by product manufacturers and professional societies to verify their latest recommendations regarding methodologies, dosages, timing of administration,practice guidelines, standards of care, and contraindications. It is the responsibility of practitioners, relying ontheir own experience and knowledge of their patients, to report, make recommendations, and work within thesestandards, in consultation with other clinicians such as referring and supervisory physicians, to determine to takeall appropriate safety procedures and to determine the best treatment of each individual patient.To the fullest extent of the law, neither Davies Publishing, Inc., nor the authors, contributors, reviewers, or editorsassume any liability for any injury and/or damage to persons or property as a matter of products liability, negligence, or otherwise, or from any use or operation of any methods, products, instructions, or ideas contained inthe material herein.Library of Congress Cataloging-in-Publication DataRumwell, Claudia, 1946- author.Vascular technology : an illustrated review / Claudia Rumwell, Michalene McPharlin. — 5th edition.p. ; cm.Includes bibliographical references and index.ISBN 978-0-941022-85-9 (alk. paper) — ISBN 0-941022-85-4 (alk. paper)I. McPharlin, Michalene, 1949- author. II. Title.[DNLM: 1. Vascular Diseases—diagnosis—Examination Questions. 2. Diagnostic Techniques,Cardiovascular—Examination Questions. WG ted and bound in ChinaISBN 978-0-941022-85-9
viiReviewersJ. Dennis Baker, MDMarie Gerhard-Herman, MD, RVT, RPVIProfessor of Surgery, EmeritusAssociate Professor of Medicine, Harvard MedicalSchoolUniversity of California, Los Angeles, School ofMedicineBrigham and Women’s HospitalLos Angeles, CaliforniaBoston, MassachusettsBryan Dodd, MEd, RDMS, RVT, RT(R)William W. Harkrider, MD, FACS, RPVI, FSVUProgram Director, Diagnostic Medical SonographyAssociate Professor of Clinical SurgeryGateWay Community CollegeLouisiana State University Department of Surgery atUniversity Hospital and ClinicsPhoenix, ArizonaColleen Douville, BA, RVTLafayette, LouisianaDirector, Cerebrovascular UltrasoundPaula Heggerick, BS, RVT, RPhS, FSVUProgram Manager, Epilepsy & Clinical NeurophysiologyVascular ConsultantSwedish Neuroscience InstituteSarasota, FloridaSeattle, WashingtonAnn Marie Kupinski, PhD, RVT, RDMS, FSVUD. Preston Flanigan, MDPresident, North Country Vascular Diagnostics, Inc.Director of Vascular ServicesClinical Associate Professor of Radiology, AlbanyMedical CollegeDirector, Vascular LaboratorySt. Joseph HospitalOrange, CaliforniaKeith Fujioka, BS, RVT, FSVUVice President, Clinical ServicesMedstreamingRedmond, WashingtonAlbany, New YorkPatricia Marques, RN, RVT, FSVUConsultantCardiovascular Ultrasound and Consulting, LLCBaton Rouge, Louisiana
viiiREVIEWERSAngel Marshall, BSHSA, RVTWilliam B. Schroedter, BS, RVT, RPhS, FSVUVascular Ultrasound Program DirectorTechnical DirectorBaker College of Auburn HillsQuality Vascular Imaging, Inc.Auburn Hills, MichiganVenice, FloridaLeAnn Maupin, MEd, RT(R), RVT, FASA, FSVURobert Scissons, RVT, FSVUMedical Imaging Department ChairTechnical Director, Jobst Vascular LaboratoryProfessor of Vascular TechnologyToledo Hospital, Jobst Vascular InstituteOregon Institute of TechnologyToledo, OhioKlamath Falls, OregonRobert Smilanich, MD, RPVIM. Lee Nix, RN, BSN, RVT, FSVUMedical Director, Utah Valley Vascular SurgeryManager, Vascular Diagnostic LabUtah Valley Regional Medical CenterAffiliated Instructor, College of MedicineProvo, UtahUniversity of TennesseeMemphis, TennesseeDonald P. Ridgway, RVTProfessor EmeritusGrossmont CollegeR. Eugene Zierler, MD, RPVIProfessor of Surgery and Medical DirectorD. E. Strandness Jr. Vascular Laboratory, Universityof Washington Medical Center and HarborviewMedical CenterEl Cajon, CaliforniaUniversity of Washington School of Medicine,Department of SurgeryDavid L. Rollins, MD, FACSSeattle, WashingtonWilloughby, OhioMember, Editorial Review Board, Journal forVascular Ultrasound
xiiiContentsReviewers viiPreface to the 5th Edition ixAcknowledgments xiPART I ARTERIAL EVALUATION 1Chapter 1 Gross Anatomy of the Central and Peripheral Arterial Systems 3Chapter 2 Physiology and Fluid Dynamics 15Chapter 3 Testing Considerations, Patient History, Mechanisms of Disease, andPhysical Examination 43Chapter 4 Doppler Waveform Analysis in the Upper and Lower Extremities 57Chapter 5 Doppler Segmental Pressures—Lower Extremities 69Chapter 6 Doppler Segmental Pressures—Upper Extremities 81Chapter 7 Laser Doppler 89Chapter 8 Penile Pressures and Waveforms—Duplex/Color Flow ImagingEvaluation 93Chapter 9 Plethysmography—Upper and Lower Extremities 99Chapter 10 Digital Pressures and Plethysmography 107Chapter 11 Transcutaneous Oximetry (TcPO2) 115Chapter 12 Duplex Scanning and Color Flow Imaging of the UpperExtremities 119
xivCONTENTSChapter 13 Duplex Scanning and Color Flow Imaging of the LowerExtremities 127Chapter 14 Duplex Scanning and Color Flow Imaging of the AbdominalVessels 139Chapter 15 Preoperative Mapping Procedures 159Chapter 16 Atypical Vascular Disorders 165Chapter 17 Alternative Diagnostic Tests and Therapeutic Interventions 173PART II CEREBROVASCULAR EVALUATION 197Chapter 18 Gross Anatomy, Physiology, and Fluid Dynamics 199Chapter 19 Testing Considerations, Patient History, Mechanisms of Disease,and Physical Examination 207Chapter 20 Carotid Duplex Scanning and Color Flow Imaging 221Chapter 21 Transcranial Doppler (TCD) 239Chapter 22 Atypical Vascular Disorders 249Chapter 23 Alternative Diagnostic Tests and Therapeutic Interventions 253PART III VENOUS EVALUATION 263Chapter 24 Gross Anatomy of the Central and Peripheral Venous Systems 265Chapter 25 Venous Hemodynamics 277Chapter 26 Testing Considerations, Patient History, Mechanisms of Disease, andPhysical Examination 281Chapter 27 Venous Photoplethysmography 293
CONTENTSChapter 28 Venous Air Plethysmography 297Chapter 29 Continuous-Wave Doppler 301Chapter 30 Duplex Scanning and Color Flow Imaging in Venous Evaluation 307Chapter 31 Alternative Diagnostic Tests 331Chapter 32 Medical Therapies 337Chapter 33 Surgical and Endovascular Therapies and Other TreatmentOptions 341PART IV TEST VALIDATION, STATISTICS, AND PATIENT SAFETY 353Chapter 34 Statistical Profile and Correlation 355Chapter 35 Patient Care and Environmental Issues 363Appendix A Case Studies for Self-Assessment 367Appendix B Application for CME Credit 401Appendix C Bibliography 433Index 435xv
C H A P T E R2Physiology andFluid DynamicsArterial SystemEnergyBlood Flow CharacteristicsPoiseuille’s LawReynolds NumberPressure/Velocity Relationships (Bernoulli Principle)Steady versus Pulsatile FlowPeripheral ResistanceCardiac EffectsCollateral EffectsEffects of ExerciseEffects of Stenosis on Flow15
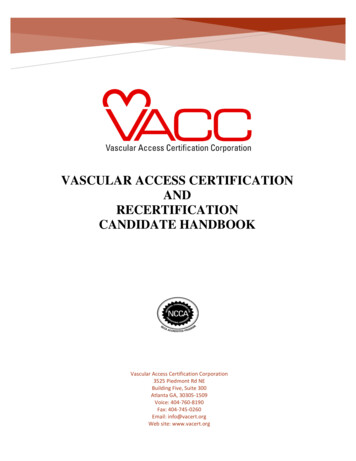
16PART IArterial EvaluationARTERIAL SYSTEMThe arterial system is a multibranched elastic conduit that carries blood awayfrom the heart and outward to the most distant tissues. The arterial tree oscillates with every beat of the heart, each one of whichpumps approximately 70 ml of blood into the aorta and causes a bloodpressure pulse. At the beginning of the cardiac contraction, the pressure in the left ventriclerises rapidly, quickly exceeding that in the aorta so that the aortic valve opens,blood is ejected, and the blood pressure rises. The amount of blood ejected iscalled the stroke volume. Increased heart rate delivers an increased blood volume that supplies morenutrients. Conversely, the lower the heart rate, the smaller the volume ofpumped blood. The patient’s cardiac status plays an important role in the movement of bloodthroughout the vascular system.The heart pump generates the pressure (potential energy) to move the blood.The stroke volume of blood produced by each heartbeat creates a pressure (orenergy) wave that travels rapidly throughout the arterial system (Figure 2-1): The propagation speed, shape, and strength of the pressure wave change asthe wave moves through the arterial system.Figure 2-1. Once the heart generates the pressure to move the blood,the energy wave produced travelsrapidly throughout the system beginning with the left ventricle (A) to thecapillary bed (E) back to the heart viathe venous system (F–I).I Right atriumA Left ventricleH Vena cavaB AortaC Large arteriesG Large veinsD ArteriolesF VenulesE Capillaries
Physiology and Fluid Dynamics Example: As the arterial pressure wave moves distally, away from the heartand out toward the periphery, the propagation speed—the pulse wave velocity—increases with the growing stiffness of the arterial walls. Variations in the characteristics of the vessels influence these alterations inblood flow. Velocity and flow direction also vary with each heartbeat. As the pressure wave moves from the large arteries through the highresistance vessels, capillaries, and then into the venous side, the meanpressure gradually declines because of losses in total fluid energy.The pumping action of the heart maintains a high volume of blood in the arterialside of the system that in turn sustains a high pressure gradient between thearterial and venous sides of the circulation. This pressure gradient is necessaryto maintain flow.Cardiac output governs the amount of blood that enters the arterial system,while arterial pressure and total peripheral resistance (which is controlled by thelevel of vasoconstriction in the microcirculation) determine the volume of bloodthat leaves it.A large portion of the energy created with each left ventricular contractionresults in distention of the arteries, producing an arterial “reservoir” that storessome of the blood volume and the potential energy supplied to the system.It is this store of energy and volume that promotes the flow of blood into thetissue during diastole. That is, potential energy is stored in the distended arterialwall and is released when the wall recoils.Pressure is greatest at the heart and gradually decreases as the blood movesdistally. This pressure difference (or gradient) is necessary to maintain blood flow.ENERGYThe movement of any fluid medium between two points requires two things:(1) a route along which the fluid can flow and (2) a difference in energy (pressure)levels between the two points. The volume of flow depends on the net energydifference between these two points, a factor that is affected by losses resulting from the movement of the fluid—i.e., friction—and any resistance within thepathway that opposes such movement.The greater the energy difference (or the lower the resistance), the greater theflow, as illustrated in Figure 2-2.The greater the pathway resistance and/or energy losses, the lower the flow.lower resistance higher flow ratehigher resistance lower flow rateCHAPTER 217
18PART IArterial EvaluationFigure 2-2. The greater thepressure gradient, the greater theflow. Example A has less pressuredifference and therefore less flowthan example B, which has a largerpressure gradient and greater flow.A100 mmHg75 mmHgB100 mmHg25 mmHgThe total energy contained in moving fluid is the sum of pressure (potential)energy, kinetic (movement) energy, and gravitational energy, as explainedbelow: Pressure energy is the main form of energy present in flowing blood (seeFigure 2-3A). It is created by the pumping action of the heart, which subsequently distends the arterial vessels. This distention occurs because ofelastin, which allows for a rapid increase in capacity. Arteries are more elasticproximally and less distally as they become smaller. Elastin quickly convertskinetic energy to pressure energy. The pressure energy is then convertedback to kinetic energy in diastole. Pressure energy is also referred to aspotential energy. Potential energy has several components. The dominantsource is the pumping action of the heart muscle, as well as distention of thearterial wall. Kinetic energy is the ability of flowing blood to do work as a result of itsvelocity; it is the energy of something in motion (see Figure 2-3B). With regardto blood flow, the kinetic energy portion is small compared to the pressureenergy. Kinetic energy is also proportional to the density of blood (whichis normally stable) and to the square of its velocity. The everyday exampleof a dam illustrates the difference between potential and kinetic energy:The water behind the dam has potential energy (with the height of the damproviding a form of gravitational energy), while the water flowing through thedam has kinetic energy. Gravitational energy (hydrostatic pressure) is expressed in millimeters of mercury (mmHg). Changes in the height of the fluid column introduce the elementof gravitational energy, which is hydrostatic pressure. In the circulatory system, hydrostatic pressure is equivalent to the weight of the column of bloodextending from the heart, where the right atrium is considered the 0 pressurereference point (i.e., atmospheric pressure), to the level where the pressure isbeing measured.
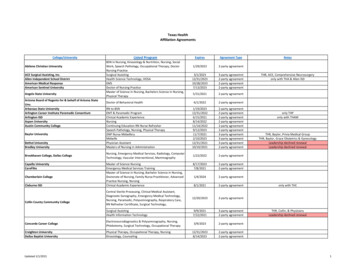
22PART IArterial EvaluationFigure 2-7. A In a poplitealartery aneurysm, resistance to flowis reduced due to the larger-thannormal diameter. Although thevolume of blood flow through thisvessel remains constant, velocitiesare decreased compared to normal.B In this superficial femoral artery(SFA) stenosis, resistance to flow isincreased because of the stenoticlumen. Although the volume flowremains constant, velocities areelevated as a result of the stenosis.ABPOISEUILLE’S LAWPoiseuille’s law defines the relationship between volume flow (Q), pressure (P),and resistance (R) and may be written as Q 5 P/R. It helps to answer the question of how much fluid is moving through a vessel. When combined with theresistance equation (see page 21), Poiseuille’s law may be stated as follows:Q5(P1 2 P2) pr 48hLwhere Q 5 volume flow, P1 5 pressure at the proximal end of the vessel, P2 5pressure at the distal end of the vessel, r 5 radius of the vessel, L 5 length of thevessel, p 5 3.1416, and h 5 viscosity of the fluid. A change in the diameter (hence, radius) of a vessel affects resistance moredramatically than viscosity or vessel length (see Figures 2-7A and 2-7B). The radius of a vessel is directly proportional to the volume flow. Smallchanges in radius may result in large changes in flow, as demonstrated inFigure 2-8.Figure 2-8. Parts A and B bothillustrate narrowed segments. Thereduction in volume flow throughsegment A will be greater than thatthrough segment B, where the radiusof the stenotic segment is somewhatlarger.AVolume inVolume outB
Physiology and Fluid Dynamics CHAPTER 2Figure 2-9. A As the diameterAdecreases, the velocities increase.DiameterVelocityBDiameterVelocity As vessel radius decreases, resistance increases. The volume of blood flowthrough the vessel nevertheless remains constant. To maintain volume flowas vessel size decreases, velocity must increase. As illustrated in Figures 2-9and 2-7A and B, the size of a vessel is inversely proportional to the velocity ofblood flow. According to the basic laws of fluid dynamics, most notably thelaw of conservation of mass (i.e., what goes in must come out), the relationship among velocity, volume flow, and cross-sectional area of the vessel isQV5Awhere V 5 velocity (cm/sec), Q 5 volume flow (cm3), and A 5 cross-sectionalarea (cm2). In the cardiovascular system, the length of the vessels and the viscosity ofthe blood usually do not change much. This means that changes in blood flowoccur mainly as a result of changes in the radius of a vessel and in the pressure energy gradient that makes flow possible.The abbreviated pressure/volume flow relationship is quite similar to oneused in electronics to explain the flow of electricity—Ohm’s law—commonlyexpressed as I (flow of electrons) 5 E/R. Please note that it may be written asI 5 V/R in some references. Here is how the two equations compare:Q 5 P/RI 5 E/RFlow volume (Q)similar toCurrent (I), flow volume of electronsPressure (P)similar toVoltage (E)Flow resistance (R)similar toElectrical resistance (R)B As the diameter increases, thevelocities decrease.23
24PART IArterial EvaluationREYNOLDS NUMBERAfter the initial acceleration in systole, blood movement continues and developsinto distinct streamline formations. Where P 5 pressure, note in Figure 2-10A thatthe streamlines are evenly distributed. When the flow pattern becomes unstable,these continuous streamlines break up and form small circular currents callededdy currents and vortices (swirling patterns of rotational flow) (Figure 2-10B).Osborne Reynolds sought to determine how viscosity, vessel radius, and thepressure/volume relationship influence the stability of flow through a vessel.Although most of his work applied to straight, rigid tubes, it still provides insightinto the physics of blood flow.Flow volume increases as pressure increases, but only to a point. As flowchanges from stable to disturbed, Reynolds found that an increase in pressureno longer increased flow volume. Instead, it increased flow disturbance, contributing to the formation of eddy currents.The elements that affect the development of turbulent flow are expressed by a“dimensionless” number called the Reynolds number (Re). The factors that affectthe development of turbulence are expressed by this number according to thefollowing equation:Vr2rRe 5hwhere Re 5 Reynolds number, V 5 velocity, r 5 the density of the fluid, r 5 theradius of the tube, and h 5 the viscosity of the fluid. Because the density andviscosity of the blood are fairly constant, the development of turbulence dependsmainly on the size of the vessels and the velocity of flow. When the Reynolds number exceeds 2000, laminar flow tends to become disturbed. Flow disturbancesalso can occur at lower values because of other factors, such as body movement,pulsatility of blood flow, and irregularities of the vessel wall and plaque.Turbulent flow may cause vessel walls to vibrate. The harmonics of this vibrationproduce vascular bruits.Figure 2-10. Arterial flowstreamlines. A Evenly distributed.B Disrupted (turbulent). P pressure.APBP
Physiology and Fluid Dynamics CHAPTER 2PRESSURE/VELOCITY RELATIONSHIPS(BERNOULLI PRINCIPLE)As previously described in the section on energy, the total energy contained inmoving fluid is the sum of potential (i.e., pressure), kinetic, and gravitational energies. If one of these variables changes, the others also must change to maintaintotal fluid energy at the same level.Example: If gravitational energy remains unchanged (that is, there is no changein the height of the fluid) but kinetic energy (velocity) increases, then potential(pressure) energy must decrease to maintain the same total fluid energy.The Bernoulli equation shows that velocity and pressure are inversely related.Where there is high velocity, there is low pressure; where there is low velocity,there is high pressure. This inverse relationship between pressure and velocityexplains why pressure decreases where fluid velocity increases (within thestenotic segment of an artery, for example) and why pressure distal to a stenosis(the region of poststenotic turbulence, where velocity decreases) is higher thanthat within the lesion itself. (See Figure 2-11.)In other words, this is the law of conservation of energy:1. In the region proximal to the stenosis (prestenosis), the pressure energyis higher and the kinetic energy lower. This region has the highest totalenergy sum.2. As blood flows into the area of the stenosis, the pressure energydecreases and the kinetic energy increases (higher). However, totalenergy in this stenotic segment is less than that in the prestenoticsegment because energy is lost (i.e., converted into heat) as it movesthrough the narrowing.3. Lastly, distal to the stenosis (poststenosis), the kinetic energy decreasesand the pressure energy increases. At this point the total energy sum islowest.Pressure gradients—the difference in pressure between two points in a vessel—are described as flow separations. Flow separations within a vessel may beVelocityVelocityPressurePressureFigure 2-11. Velocity energy iselevated and pressure energy diminished within a stenosis. Relativevelocity energy decreases andpressure energy increases distal toa stenosis. However, overall energydecreases.25
26PART IArterial EvaluationFigure 2-12. Flow separationpatterns. In both examples A and B,pressure energy is higher and velocityenergy lower in the area of thepressure gradient (flow separation).This causes flow direction to moveto the area of lower pressure energy.A Flow separation in the carotid bulb.B Flow separation at a curve (notethat it is located on the inside of thevessel curve).ACarotid bifurcationFlow separationVelocityPressureBFlow separationVelocityPressurecaused by changes in the geometry of the vessel (with or without intraluminaldisease) or the direction of the vessel, as depicted in Figures 2-12A and B. Seealso Figure 2-13.Flow separations leave behind regions of flow reversal, stagnant or little movement. Figure 2-14 demonstrates two different regions within a bypass graftwhere these flow separations can occur.Figure 2-13. Longitudinal imageof the carotid bifurcation in systole.The inset shows the same image indiastole. Note that flow separation(blue) is present during systole,absent in diastole.Because flow moves from high to low pressure (described as a pressure gradient),the direction of flow in the region of flow separation (e.g., carotid bulb, bypassgraft anastomosis) changes with respect to the transducer, causing a visiblecolor change in the color flow image at systole.During diastole, when flow at the vessel wall is stagnant, there is no movementof blood and therefore no color in the color flow image. The flow separationpattern is an ideal one to use to help define whether an image is in systole ordiastole.Figure 2-14. In this reversedsaphenous vein graft at the endto-side proximal anastomosis thereis an area of flow stagnation (flowseparation) on the inside wall. Distally,there are areas of flow separationat the site of a valve cusp. Note thevariability of vessel dimension in thebypass graft. CFA common femoralartery, SFA superficial femoralartery.Bypass graftFlow separationValve siteFlow separationCFASFA
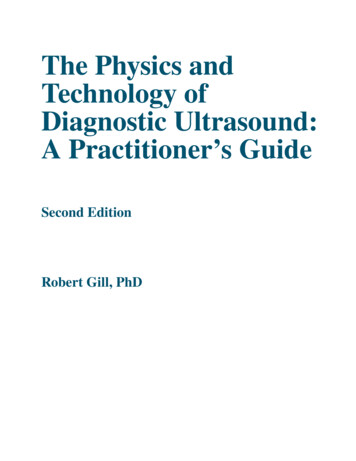
Physiology and Fluid Dynamics ACHAPTER 2BFigure 2-22. An irregular heart rhythm is evident in this spectral analysis of a commoncarotid artery. A severely irregular heart rhythm (Figure 2-23), on the other hand, representsa challenge in obtaining reliable peak systolic velocity (PSV) measurements.Some protocols call for averaging a few cycles to be the most reliable; othersconsider the averaging of 10 cycles to be the best method. When determiningthe significance of a stenosis, calculating a velocity ratio may be helpful; e.g.,the highest internal carotid artery PSV is divided by the PSV of the more distalcommon carotid artery.Stenosis of the Aortic Valve A delay in the systolic upstroke is evident (Figure 2-24). Decreased peak systolic velocities (PSVs) are also usually seen. Therefore,PSVs may underestimate a stenosis.Figure 2-23. Severely irregular heart rhythm provides significantFigure 2-24. A delay in the systolic upstroke is evident with achallenges in determining a reliable peak systolic velocity measurement.stenosis of the aortic valve. A decrease in peak systolic velocities isalso usually seen.31
32PART IArterial EvaluationFigure 2-25. Double systolic peak(pulsus bisferiens) in the commoncarotid artery of a patient with aorticregurgitation/insufficiency.Figure 2-26. Pandiastolic flowreversal in the subclavian artery ofa patient with aortic regurgitation/insufficiency.Figure 2-27. Significant flowreversal in the proximal aortaof a patient with severe sufficiency of the Aortic Valve A double systolic peak, sometimes referred to as pulsus bisferiens, may beevident (Figure 2-25). However, a similar finding, i.e., a second systolic peak,may be a normal finding in a young patient secondary to vessel wall compliance. In addition, one author* suggests that there may be a relationshipbetween a double systolic peak and aortic dissection. Diminished diastolic flow or even reversed flow throughout diastole may alsobe documented on spectral analysis (Figures 2-26 and 2-27).High Cardiac Output A systemic increase in peak systolic velocities may normally be evident inyounger, athletic individuals or physically fit adults (Figure 2-28). A decreasein end-diastolic velocities may also be evident in a low-resistance vessel, e.g.,the internal carotid artery. As previously mentioned, a double systolic peakmay also be a normal finding in a young patient secondary to vessel wallcompliance (Figure 2-25).*Burgess W: Recommended protocol for duplex ultrasound in common carotid artery dissectionextending from the aortic arch. Paper presented at the Annual Conference of the Society for VascularUltrasound, San Francisco, California, May 2013.
Physiology and Fluid Dynamics CHAPTER 2chronic obstructive pulmonary disease, primary pulmonary hypertension,and renal failure. It should be noted that elevated right heart pressure mayalso be related to a pulmonary embolism. In addition, it may reflect a fluidoverload condition not necessarily related to a disease process, such asoverhydration.COLLATERAL EFFECTSIn an extremity at rest, total blood flow may be fairly normal even in the presence of severe stenosis or complete occlusion of the main artery because of thedevelopment of a collateral network, as well as the aforementioned compensatory decrease in peripheral resistance.To evaluate the approximate location of the obstructed artery, Doppler segmental pressures may be helpful.Arterial obstruction may alter flow in nearby or more distant collateral channels,increasing volume flow, reversing flow direction, increasing velocity, and/or altering the pulsatility of the waveform. Note in Figure 2-38 the low-resistance qualityof the spectral waveform.The location of collateral vessels helps to provide a tentative indication of theobstruction level, as demonstrated in Figure 2-39.Secondary collateral changes (such as evidence of tissue healing or granulation,increased capillary refill, and decreased symptomatology) also provide somelimited information regarding the adequacy of a collateral system that hasevolved in response to arterial obstruction.Figure 2-38. With a proximalsuperficial femoral artery (SFA)occlusion, flow in this poplitealartery is reconstituted via collaterals.Because flow is collateral-based andmoving into a vasodilated vascularbed, its quality is of low resistance.Figure 2-39. Representation ofSFACollateralsan occluded superficial femoralartery (SFA) with reconstituted flowdistally due to collateralization.Arterial branches that were smallare now taking a larger portion ofthe arterial flow, actually bypassingthe obstruction in order to provideneeded arterial flow to the foot.37
38PART IArterial EvaluationEFFECTS OF EXERCISEExercise should induce peripheral vasodilation in the microcirculation so thatdistal peripheral resistance diminishes and blood flow markedly increases.Peripheral resistance—the resistance to blood flow caused by the ever-decreasingsize of the vessels, especially in the microcirculation—changes in response to avariety of stimuli such as heat, cold, tobacco use, and emotional stress.Figure 2-40. Because exerciseproduces a demand for blood to themuscles, a normally high-resistancearterial Doppler signal becomes lowresistance. In this analog waveform,the usual reversal below the baselineis seen as a forward reflectioninstead. This finding is quite normalafter exercise.Vasoconstriction and vasodilation of the blood vessels within skeletal musclesare also influenced by sympathetic innervation fibers that function primarily toregulate body temperature.Exercise is probably the best single vasodilator of high-resistance vessels withinskeletal muscle.Autoregulation also controls vasoconstri
Vascular Ultrasound viii REVIEWERS. xiii. Contents Reviewers vii. Preface to the 5th Edition ix. Acknowledgments xi. PART I ARTERIAL EVALUATION 1 Chapter 1Anatomy of the Central and Peripheral Arterial SystemsGross 3 Chapter 2 Physiology and Fluid Dynamics 15File Size: 1MBPage Count: 38