Transcription
Connors Research Trading Strategy SeriesTrading Stocks andOptions withMoving Averages ‐A QuantifiedApproachByConnors Research, LLCLaurence ConnorsMatt Radtke
Page 2Copyright 2013, Connors Research, LLC.ALL RIGHTS RESERVED. No part of this publication may be reproduced, stored in aretrieval system, or transmitted, in any form or by any means, electronic, mechanical,photocopying, recording, or otherwise, without the prior written permission of thepublisher and the author.This publication is designed to provide accurate and authoritative information in regardto the subject matter covered. It is sold with the understanding that the author and thepublisher are not engaged in rendering legal, accounting, or other professional service.Authorization to photocopy items for internal or personal use, or in the internal orpersonal use of specific clients, is granted by Connors Research, LLC, provided that theU.S. 7.00 per page fee is paid directly to Connors Research, LLC, 1-973-494-7333.ISBN 978-0-9886931-7-3Printed in the United States of America.
Page 3DisclaimerBy distributing this publication, Connors Research, LLC, Laurence A. Connors and Matt Radtke(collectively referred to as “Company") are neither providing investment advisory services nor acting asregistered investment advisors or broker-dealers; they also do not purport to tell or suggest whichsecurities or currencies customers should buy or sell for themselves. The analysts and employees oraffiliates of Company may hold positions in the stocks, currencies or industries discussed here. Youunderstand and acknowledge that there is a very high degree of risk involved in trading securities and/orcurrencies. The Company, the authors, the publisher, and all affiliates of Company assume noresponsibility or liability for your trading and investment results. Factual statements on the Company'swebsite, or in its publications, are made as of the date stated and are subject to change without notice.It should not be assumed that the methods, techniques, or indicators presented in these products will beprofitable or that they will not result in losses. Past results of any individual trader or trading systempublished by Company are not indicative of future returns by that trader or system, and are not indicativeof future returns which be realized by you. In addition, the indicators, strategies, columns, articles and allother features of Company's products (collectively, the "Information") are provided for informational andeducational purposes only and should not be construed as investment advice. Examples presented onCompany's website are for educational purposes only. Such set-ups are not solicitations of any order tobuy or sell. Accordingly, you should not rely solely on the Information in making any investment. Rather,you should use the Information only as a starting point for doing additional independent research in orderto allow you to form your own opinion regarding investments.You should always check with your licensed financial advisor and tax advisor to determine the suitabilityof any investment.HYPOTHETICAL OR SIMULATED PERFORMANCE RESULTS HAVE CERTAIN INHERENTLIMITATIONS. UNLIKE AN ACTUAL PERFORMANCE RECORD, SIMULATED RESULTS DO NOTREPRESENT ACTUAL TRADING AND MAY NOT BE IMPACTED BY BROKERAGE AND OTHERSLIPPAGE FEES. ALSO, SINCE THE TRADES HAVE NOT ACTUALLY BEEN EXECUTED, THERESULTS MAY HAVE UNDER- OR OVER-COMPENSATED FOR THE IMPACT, IF ANY, OF CERTAINMARKET FACTORS, SUCH AS LACK OF LIQUIDITY. SIMULATED TRADING PROGRAMS INGENERAL ARE ALSO SUBJECT TO THE FACT THAT THEYARE DESIGNEDWITH THE BENEFIT OFHINDSIGHT. NO REPRESENTATION IS BEING MADE THAT ANY ACCOUNT WILL OR IS LIKELY TOACHIEVE PROFITS OR LOSSES SIMILAR TO THOSE SHOWN.Connors Research10 Exchange PlaceSuite 1800Jersey City, NJ 07302
Page 4Table of ContentsSection 1 Introduction . 5Section 2 Strategy Rules. 8Section 3 Test Results . 15Section 4 Selecting Strategy Parameters . 21Section 5 Using Options . 25Section 6 Additional Thoughts . 29Appendix: The ConnorsRSI Indicator and Historical Volatility . 31
Page 5Section 1Introduction
Page 6Indicators are not always what they appear to be. Moving averages are widely used as a trend‐followingtool. In many of the trading strategies that we have developed over the years, the 200‐day movingaverage (MA) is used to identify the direction of the trend. We have found that taking buy signals onlywhen the price is above the 200‐day MA can improve profitability in many systems.Recently, we completed research that shows moving averages can also be used as part of a strategy tofind short‐term, mean reversion trading opportunities. This may be surprising to some traders because itmight seem odd to use a trend‐following indicator like MAs in a short‐term, mean reversion strategy.While MAs are used in this strategy, the MA is not being applied in its traditional way. As we highlightedin the 2004 book How Markets Really Work, it is important to develop unique insights into the behaviorof prices.In How Markets Really Work, we tested common knowledge and discovered it was not always best tofollow widely accepted market truths. We found that it was best to buy short‐term weakness, forexample, and research showed that selective buying when market breadth was poor was moreprofitable than buying when market breadth indicators were uniformly positive. We also discovered thatchanges in volume were irrelevant to making buy and sell decisions despite the widespread beliefamong traders that volume is needed to confirm an uptrend.We have continued that type of research and we always look at data rather than widely accepted truths.In doing so, we found that moving averages (MAs) can be used as short‐term timing tools.Traditionally, MAs are usually used as trend‐following tools. Buy signals are given when prices closeabove the MA and sell signals result from closes below the MA. While they can be used profitably in thisway, there are also a number of problems associated with MAs.When a market is range‐bound, which is most of the time, traders experience a number of whipsawtrades while waiting for the next trend to emerge. Whipsaw trades are entries that are quickly reversed.Commissions and other trading costs can be substantial when prices whip back and forth around themoving average and those costs decrease profits.Signals based on MAs will also always be late. This is by design since MAs trail the market. However,these delays can lead to missing large price moves. The price of SPDR S&P 500 ETF (NYSE: SPY) increasedmore than 30% after bottoming in March 2009, for example, before long‐term MAs gave buy signals.Systems based on MAs generally have low win rates and a majority of the system profits come from onlya few of the trades. Most trades end in only small gains or losses that result from whipsaws.These problems make MAs difficult to trade. In back‐testing over long periods, they seem to beprofitable but in real‐time, the delayed signals and large number of losing trades lead many traders toabandon the system.We viewed the problems of MAs as an opportunity to develop a trading system based on meanreversion.
Page 7Whipsaws are caused by the binary nature of the MA system. It is always either in or out of the market,or is always long or short, based on the interaction of the MA with prices. We can reduce this problemby defining rules that only take high probability trades. Many markets are untradeable the majority ofthe time and rules can be designed to recognize when the market is at an extreme and trade only underthe right conditions.Another weakness of MA systems is that they give back large amounts of profits after the trend reversesbefore they exit or they require delays that miss large profits before entering trades. This is caused bythe fact that prices move significantly away from the MA when markets are trending. Some tradersaddress this problem by closing trades when prices deviate too far from an MA, which leads to anotherproblem because strong trends will be missed and the profitability of the system will be reduced. Weaddress the problem of by using two MAs which minimizes the delays at turning points.All of the strategy rules are fully detailed in the next section. This is a powerful new way to use MAs thatcan deliver profits in any market.
Page 8Section 2Strategy RulesThis document cannot be reproduced without the expressed written permission of Connors Research, LLC.
Page 9Moving averages are generally used to follow the trends. Some traders will use MAs to help identifyoverbought or oversold markets. This approach usually involves identifying when the price has movedtoo far from the MA. To determine when prices are too far from an MA, channels, based onpercentages or standard deviations, are often added to the MA. Channels fail to identify strength andare invariably wrong during the market’s largest advances or declines.The Quantified Moving Average Strategy uses two moving averages to reduce the probability of beingwrong at major market turns. Both moving averages will move along with prices and the relationshipbetween the two averages will highlight oversold market extremes.This strategy executes trades using a simple three‐step process consisting of Setup, Entry and Exit. Therules for each of these steps are detailed below.A Quantified Moving Average Strategy Setup occurs when all of the following conditions are true:1. The stock’s price must be above 5.2. The stock’s average daily volume over the past 21 trading days (approximately one month)must be at least 250,000 shares.3. The historical volatility over the past 100 days, or HV(100), must be greater than 30. (See theAppendix for a definition of historical volatility).4. Today’s close must be above the 200‐day moving average, or MA(200).5. The fast MA is at least Y% below the slow MA where Y 2.5, 5.0, 7.5, or 10.0%. Thefollowing MA scenarios will be tested:Scenario12345Fast MAMA(C,5)MA(C,5)MA(C,5)MA(C,10)MA(C,10)Slow MAMA(C,10)MA(C,20)MA(C,50)MA(C,20)MA(C,50)If the previous day was a Setup, then we Enter a trade by:6. Submitting a limit order to buy the stock at a price X% below yesterday’s close,where X is 2, 4, 6, 8 or 10%.After we’ve entered the trade, we Exit using one of the following methods, selected in advance:7a. The closing price of the stock is higher than the previous day’s close. We typically refer tothis exit as the First Up Close.7b. The stock closes with a ConnorsRSI value greater than 50.7c. The stock closes with a ConnorsRSI value greater than 70.7d. The closing price of the stock is greater than the 3‐day moving average, or MA(3).7e. The closing price of the stock is greater than the 5‐day moving average, or MA(5).This document cannot be reproduced without the expressed written permission of Connors Research, LLC.
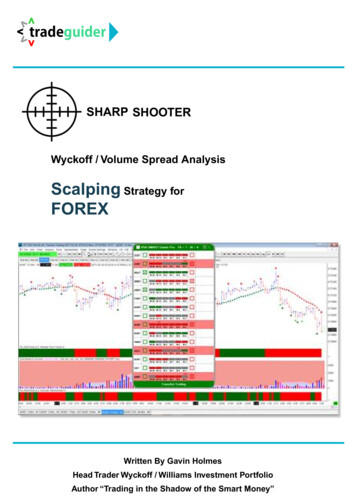
P a g e 10Let’s look at each rule in a little more depth, and explain why it’s included in the strategy.Rules 1 & 2 assure that we’re in highly liquid stocks which can be readily bought and sold with tightbid/ask spreads that reduce trading costs.Rule 3 assures that the stock has enough volatility to allow for large moves.Rule 4 identifies the direction of the long‐term trend. By requiring the close to be above the 200‐dayMA, we are finding stocks that are oversold but remain in a long‐term uptrend.Rule 5 identifies short‐term oversold extremes.Rule 6 allows us to enter the trade at an optimal price. The Setup rules identify an oversold stock andthe entry rule waits for it to become even more oversold on an intraday basis.Rule 7 provides a well‐defined exit method. Few strategies have quantified, structured, and disciplinedexit rules. Rule 7 gives you the exact parameters to exit the trade, backed by over 12.75 years ofhistorical test results. As with all other strategy parameters, we select in advance the type of exit thatwe will use, and apply that rule consistently in our trading.Rules 7b and 7c use ConnorsRSI to define the exit. In the past, many of our strategies used a 2‐day RSI,or RSI(2) to identify overbought and oversold conditions. Our recent research has shown ConnorsRSI tobe a more effective indicator. If you’re not familiar with ConnorsRSI, details can be found in theAppendix.In our testing we closed all trades at the close of trading on the day that the Exit signal occurred. If this isnot an option for you, our research has generally shown that similar results are achieved if you exit yourpositions at or near the open the next morning.Now let’s see how a typical trade looks on a chart.For the example below, we’ll use a strategy variation that requires the 5‐day MA to be more than 10%below the 20‐day MA on the Setup day. The limit order will be placed 6% below the Setup day’s closingprice. We will exit when the ConnorsRSI is greater than 70, the exit method defined by Rule 7c.This document cannot be reproduced without the expressed written permission of Connors Research, LLC.
P a g e 11Chart created in TradingView. Reprinted courtesy of TradingVew.com.Figure 1: Smith & Wesson Corp. (SWHC) TradeThe chart above is for Smith & Wesson Holding Corp. whose symbol is SWHC. In the chart, the top paneshows the price bars in black, the 5‐day MA or MA(5) in blue and the 20‐day MA or MA(20) in green. Thegreen arrow shows when the trade was entered and the red arrow highlights the day the Exit rule istriggered.Rule 1 is satisfied because the stock’s closing price is 7.96 on August 22, 2012, well above the minimumvalue of 5.Rule 2 is met
Connors Research Trading Strategy Series . In many of the trading strategies that we have developed over the years, the 200‐day moving average (MA) is used to identify the direction of the trend. We have found that taking buy signals only .