Transcription
Connors Research Trading Strategy SeriesAn Introduction toConnorsRSIByConnors Research, LLCLaurence ConnorsCesar AlvarezMatt Radtke
2 Ways to Get ConnorsRSI Readings FREE Every DayGet Live ConnorsRSI Readings withTradingMarkets Analyticshttp://analytics.tradingmarkets.com/Get a Custom Sort of Pre‐Market ConnorsRSI Readings withthe TradingMarkets er/
Page 2Copyright 2012, Connors Research, LLC.ALL RIGHTS RESERVED. No part of this publication may be reproduced, stored in aretrieval system, or transmitted, in any form or by any means, electronic, mechanical,photocopying, recording, or otherwise, without the prior written permission of thepublisher and the author.This publication is designed to provide accurate and authoritative information in regardto the subject matter covered. It is sold with the understanding that the author and thepublisher are not engaged in rendering legal, accounting, or other professional service.Authorization to photocopy items for internal or personal use, or in the internal orpersonal use of specific clients, is granted by Connors Research, LLC, provided that theU.S. 7.00 per page fee is paid directly to Connors Research, LLC, 1-973-494-7333.ISBN 978-0-9853072-9-5Printed in the United States of America.This document cannot be reproduced without the expressed written permission of Connors Research, LLC.Copyright 2012, Connors Research, LLC. All Rights Reserved.
Page 3DisclaimerBy distributing this publication, Connors Research, LLC, Laurence A. Connors, Cesar Alvarez, and MattRadtke (collectively referred to as “Company") are neither providing investment advisory services noracting as registered investment advisors or broker-dealers; they also do not purport to tell or suggestwhich securities or currencies customers should buy or sell for themselves. The analysts and employeesor affiliates of Company may hold positions in the stocks, currencies or industries discussed here. Youunderstand and acknowledge that there is a very high degree of risk involved in trading securities and/orcurrencies. The Company, the authors, the publisher, and all affiliates of Company assume noresponsibility or liability for your trading and investment results. Factual statements on the Company'swebsite, or in its publications, are made as of the date stated and are subject to change without notice.It should not be assumed that the methods, techniques, or indicators presented in these products will beprofitable or that they will not result in losses. Past results of any individual trader or trading systempublished by Company are not indicative of future returns by that trader or system, and are not indicativeof future returns which be realized by you. In addition, the indicators, strategies, columns, articles and allother features of Company's products (collectively, the "Information") are provided for informational andeducational purposes only and should not be construed as investment advice. Examples presented onCompany's website are for educational purposes only. Such set-ups are not solicitations of any order tobuy or sell. Accordingly, you should not rely solely on the Information in making any investment. Rather,you should use the Information only as a starting point for doing additional independent research in orderto allow you to form your own opinion regarding investments.You should always check with your licensed financial advisor and tax advisor to determine the suitabilityof any investment.HYPOTHETICAL OR SIMULATED PERFORMANCE RESULTS HAVE CERTAIN INHERENTLIMITATIONS. UNLIKE AN ACTUAL PERFORMANCE RECORD, SIMULATED RESULTS DO NOTREPRESENT ACTUAL TRADING AND MAY NOT BE IMPACTED BY BROKERAGE AND OTHERSLIPPAGE FEES. ALSO, SINCE THE TRADES HAVE NOT ACTUALLY BEEN EXECUTED, THERESULTS MAY HAVE UNDER- OR OVER-COMPENSATED FOR THE IMPACT, IF ANY, OF CERTAINMARKET FACTORS, SUCH AS LACK OF LIQUIDITY. SIMULATED TRADING PROGRAMS INGENERAL ARE ALSO SUBJECT TO THE FACT THAT THEYARE DESIGNEDWITH THE BENEFIT OFHINDSIGHT. NO REPRESENTATION IS BEING MADE THAT ANY ACCOUNT WILL OR IS LIKELY TOACHIEVE PROFITS OR LOSSES SIMILAR TO THOSE SHOWN.Connors Research10 Exchange PlaceSuite 1800Jersey City, NJ 07302This document cannot be reproduced without the expressed written permission of Connors Research, LLC.Copyright 2012, Connors Research, LLC. All Rights Reserved.
Page 4Table of ContentsSection 1 The ConnorsRSI Indicator . 5Section 2 ConnorsRSI Base Performance . 10Section 3 ConnorsRSI Pullback Strategy Rules . 14Section 4 The Role of Exits . 21Section 5 Test Results . 24Section 6 Trading Options Using the ConnorsRSI Pullback Strategy. 30Section 7 Additional Thoughts . 34This document cannot be reproduced without the expressed written permission of Connors Research, LLC.Copyright 2012, Connors Research, LLC. All Rights Reserved.
Page 5Section 1The ConnorsRSIIndicatorThis document cannot be reproduced without the expressed written permission of Connors Research, LLC.Copyright 2012, Connors Research, LLC. All Rights Reserved.
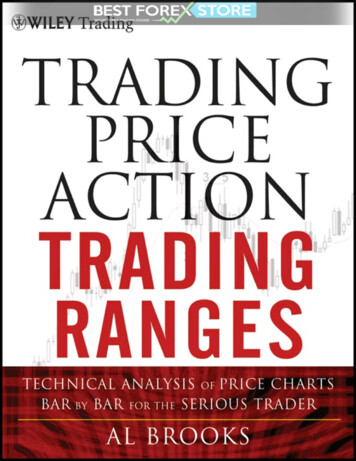
Page 6Connors Research has been developing, testing, and publishing quantified trading strategies since themid‐1990s. During that time, we have had the opportunity to evaluate a great number of differenttechnical indicators and to assess their effectiveness in predicting future price action. Now we’ve takenthe next step and created an indicator of our own: ConnorsRSI. The purpose of this guidebook is todescribe the indicator itself and also to provide a well‐defined, quantified trading strategy that utilizesthis new indicator.ConnorsRSI is a composite indicator consisting of three components. Two of the three componentsutilize the Relative Strength Index (RSI) calculations developed by Welles Wilder in the 1970s, and thethird component ranks the most recent price change on a scale of 0 to 100. Taken together, these threefactors form a momentum oscillator, i.e. an indicator that fluctuates between 0 and 100 to indicate thelevel to which a security is overbought (high values) or oversold (low values).Before we discuss how to calculate ConnorsRSI, let’s review Wilder’s RSI. RSI is a very useful andpopular momentum oscillator that compares the magnitude of a stock's gains to the magnitude of itslosses over some look‐back period. Wilder himself believed that 14 periods was the ideal look‐back. Weoften use the shorthand notation RSI(14) for the 14‐period RSI. The formula below computes RSI(14) fora series of price changes:If we wanted to compute RSI for a different number of periods (N), then we would replace 14 in theformula above with N, and replace 13 with N‐1. Regardless of the number of periods used in thecalculation, the result will always be a number between 0 and 100. Traders who use RSI(14) typicallylook for values greater than 70 to identify overbought conditions, and values less than 30 to indicateoversold conditions.Our previous research has shown that using shorter look‐back periods makes RSI more effective inpredicting short‐term price movements. We have published many strategies that utilize RSI(2), as wellThis document cannot be reproduced without the expressed written permission of Connors Research, LLC.Copyright 2012, Connors Research, LLC. All Rights Reserved.
Page 7as several that use RSI(3) and RSI(4). Changing the number of periods also has an effect on the RSI levelsthat best identify overbought and oversold conditions. For example, an RSI(2) value of less than 10 isusually a reliable indicator of an oversold condition, while an RSI(2) value over 90 is a good benchmarkfor an overbought condition.Now let’s turn our attention back to ConnorsRSI. As mentioned previously, ConnorsRSI combines threecomponents, and as you might guess, they are all elements that our research has repeatedly shown tohave significant predictive ability:Price Momentum: As we just discussed, RSI is an excellent way to measure price momentum,i.e. overbought and oversold conditions. By default, ConnorsRSI applies a 3‐period RSIcalculation to the daily closing prices of a security. We will refer to this value as RSI(Close,3).Duration of Up/Down Trend: When the closing price of a security is lower today than it wasyesterday, we say that it has “closed down”. If yesterday’s closing price was lower than theprevious day’s close, then we have a “streak” of two down close days. Our research has shownthat the longer the duration of a down streak, the more the stock price is likely to bounce whenit reverts to the mean. Likewise, longer duration up streaks result in larger moves down whenthe stock mean reverts. In effect, the streak duration is another type of overbought/oversoldindicator.The problem is, the number of days in a streak is theoretically unbounded, though we couldprobably place some practical limits on it based on past experience. For example, we mightobserve that there have been very few instances of either an up streak or a down streak lastingfor more than 20 days, but that still doesn’t get us to a typical oscillator‐type value that variesbetween 0 and 100.The solution is two‐fold. First, when we count the number of days in a streak, we will usepositive numbers for an up streak, and negative numbers for a down streak. A quick examplewill help to illustrate this:Day12345678Closing Price 20.00 20.50 20.75 19.75 19.50 19.35 19.35 19.40Streak Duration12‐1‐2‐301The closing price on Day 2 is higher than on Day 1, so we have a one‐day up streak. On Day 3,the price closes higher again, so we have a two‐day up streak, i.e. the Streak Duration value is 2.On Day 4, the closing price falls, giving us a one‐day down streak. The Streak Duration value isThis document cannot be reproduced without the expressed written permission of Connors Research, LLC.Copyright 2012, Connors Research, LLC. All Rights Reserved.
Page 8negative (‐1) because the price movement is down, not up. The downward trend continues onDays 5 and 6, which our Streak Duration reflects with values of ‐2 and ‐3. On Day 7 the closingprice is unchanged, so the Streak Duration is set to 0 indicating neither an up close nor a downclose. Finally, on Day 8 the closing price rises again, bringing the Streak Duration value back to1.The second aspect of the solution is to apply the RSI calculation to the set of Streak Durationvalues. By default, ConnorsRSI uses a 2‐period RSI for this part of the calculation, which wedenote as RSI(Streak,2). The result is that the longer an up streak continues, the closer theRSI(Streak,2) value will be to 100. Conversely, the longer that a down streak continues, thecloser the RSI(Streak,2) value will be to 0. Thus, we now have two components ‐‐ RSI(Close,3)and RSI(Streak,2) ‐‐ that both use the same 0‐100 scale to provide a perspective on theoverbought/oversold status of the security we’re evaluating.Relative Magnitude of Price Change: The final component of ConnorsRSI looks at the size oftoday’s price change in relation to previous price changes. We do this by using a Percent Rankcalculation, which may also be referred to as a “percentile”. Basically, the Percent Rank valuetells us the percentage of values in the look‐back period that are less than the current value.For this calculation, we measure price change not in dollars and cents, but as a percentage ofthe previous day’s price. This percentage gain or loss is typically referred to as the one‐dayreturn. So if yesterday’s closing price was 80.00, and today’s price is 81.60, the one‐dayreturn is ( 81.60 ‐ 80.00) / 80.00 0.02 2.0%.To determine the Percent Rank, we need to establish a look‐back period. The Percent Rankvalue is then the number of values in the look‐back period that are less than the current value,divided by the total number of values. For example, if the look‐back period is 20 days, then wewould compare today’s 2.0% return to the one‐day returns from each of the previous 20 days.Let’s assume that three of those values are less than 2.0%. We would calculate Percent Rank as:Percent Rank 3 / 20 0.15 15%The default Percent Rank look‐back period used for ConnorsRSI is 100, or PercentRank(100). Weare comparing today’s return to the previous 100 returns, or about 5 months of price history.To reiterate, large positive returns will have a Percent Rank closer to 100. Large negativereturns will have a Percent Rank closer to 0.The final ConnorsRSI calculation simply determines the average of the three component values. Thus,using the default input parameters would give us the equation:ConnorsRSI(3,2,100) [ RSI(Close,3) RSI(Streak,2) PercentRank(100) ] / 3The result is a very robust indicator that is more effective than any of the three components usedindividually. In fact, ConnorsRSI also offers some advantages over using all three components together.When we use multiple indicators to generate an entry or exit signal, we typically set a target value forThis document cannot be reproduced without the expressed written permission of Connors Research, LLC.Copyright 2012, Connors Research, LLC. All Rights Reserved.
Page 9each one. The signal will only be considered valid when all the indicators exceed the target value.However, by using an average of the three component indicators, ConnorsRSI produces a blending effectthat allows a strong value from one indicator to compensate for a slightly weaker value from anothercomponent. A simple example will help to clarify this.Let’s assume that Trader A and Trader B have agreed that each of the following indicator values identifyan oversold condition: RSI(Close,3) 15RSI(Streak,
Connors Research has been developing, testing, and publishing quantified trading strategies since the mid‐1990s. During that time, we have had the opportunity to evaluate a great number of differentFile Size: 478KBPage Count: 46