Transcription
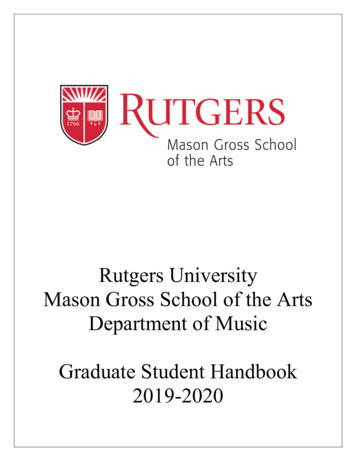
Chapter 3 ReviewRPMDemRPMandRPMQOSQOSASMyQOS Elasticit # FlightsityTime ElasticSpillUnit CostEconomiesOf ScaleYieldityPrice ElasticRevenueUnit CostOperating ExpenseProfit
Fundamentals of Pricing andRevenue ManagementChapter 4Lesson 3
Outline Airline Pricing and O‐D Markets– Pricing Strategies– Price Discrimination vs. Product Differentiation Airline Differential Pricing– “willingness to pay”(WTP) Airline Revenue Management
Airline Pricing and O‐D MarketsPricing Strategies
Airline Prices and O‐D Markets Pricing – refers to the process of determining fare levels, combinedwith various service amenities and restrictions, for a set of fareproducts in an origin‐destination market Revenue Management – is the subsequent process of determininghow many seats to make available at each fare level Regulated Pricing – the Civil Aeronautics Board (CAB) used amileage‐based formula to ensure equal prices for equal distances “Deregulated” or Liberalized Pricing – Different O‐D markets canhave prices not related to distance traveled, or even the airline’soperating costs, as airlines match low‐fare competitors to maintainmarket presence and share of traffic– Its possible that low‐volume O‐D markets are more costly to serve perpassenger basis will see higher prices than high‐density O‐D markets, evenif similar distances are involved
Theoretical Pricing Strategies For determining prices to charge in an O‐D market,airlines can utilize one of following economic principles:– Cost‐based pricing– Demand‐based pricing– Service‐based pricing In practice, most airline pricing strategies reflect a mix ofthese theoretical principles:– Prices are also highly affected by competition in each O‐DMarket– In the US, severe competition in some markets has led to“price‐based costing”, meaning airlines must reduce costs tobe able to match low‐fare competitors and passengers’ priceexpectations
Price Discrimination vs. ProductDifferentiation Price discrimination:– The practice of charging different prices for same productwith same costs of production– Based solely on different consumers’ “willingness to pay” Product differentiation:– Charging different prices for products with differentcharacteristics and costs of production Current airline fare structures reflect both strategies:– Differential Pricing based on differentiated fare products– But higher prices for fare products targeted at businesstravelers are clearly based on their willingness to pay
Airline Pricing Practices Differential pricing presents a trade‐off to customersbetween inconvenience and price levels:– Business travelers are “willing” to pay higher fares in returnfor more convenience, fewer restrictions on use of tickets– Leisure travelers less “willing” to pay higher prices, but acceptdisutility “costs” of restrictions on low fare products Economic concept of “willingness to pay”(WTP) is definedby the theoretical price‐demand curve:– “Willingness” does not mean “happiness” in paying higherprices– Differential pricing attempts to make those with higher WTPpurchase the less restricted higher‐priced options
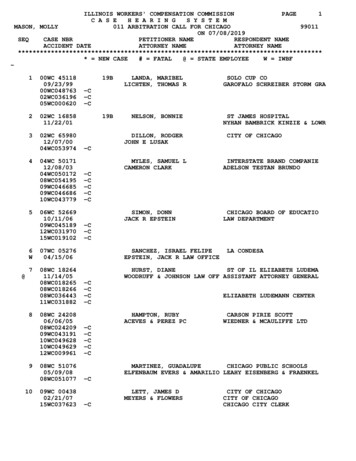
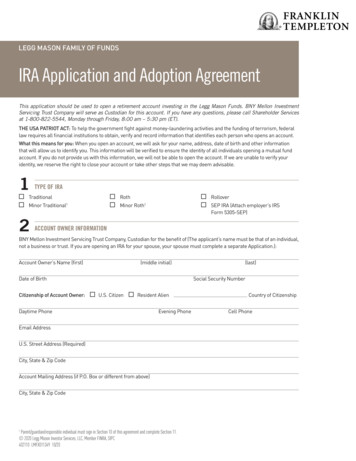
PriceDifferential Pricing Theory (circa 2000)Demand Market segments withdifferent “willingness topay” for air travel Different “fare products”offered to businessversus leisure travelers Prevent diversion bysetting restrictions onlower fare products andlimiting seats available Increased revenues andhigher load factors thanany single fare strategy
Airline Differential Pricing
Why Differential Pricing? It allows the airline to increase total flight revenues with little impacton total operating costs:– Incremental revenue generated by discount fare passengers whootherwise would not fly– Incremental revenue from high fare passengers willing to paymore– Studies have shown that most “traditional” high‐cost airlines couldnot cover total operating costs by offering a single fare level Consumers can also benefit from differential pricing:– Most notably, discount passengers who otherwise would not fly– It is also conceivable that high fare passengers pay less and/orenjoy more frequency given the presence of low fare passengers If airline could charge a different price for each customer based ontheir WTP, its revenues would be close to the theoretical maximum
Market Segmentation Business and Leisure travelers are the twotraditional segments targeted by the airlines intheir different pricing efforts– First Class, Business Class, and Economy– Restrictions on advance purchase, use, andrefundability A wide enough range of fare product options atdifferent price levels should be offered to captureas much revenue potential from the marketprice‐demand curve as possible
Traditional Approach: Restrictions onLower Fares Progressively more severe restrictions on low fareproducts designed to prevent diversion:– Lowest fares have advance purchase and minimum stayrequirements , as well as cancellation and change fees– Restrictions increase the inconvenience or “disutilitycost” of low fares to travelers with high WTP, forcingthem to pay more– Studies show “Saturday night minimum stay” conditionto be most effective in keeping business travelers frompurchasing low fares Still, it is impossible to achieve perfect segmentation:– Some travelers with high WTP can meet restrictions– Many business travelers often purchase restricted fares
Example: Restriction Disutility Costs
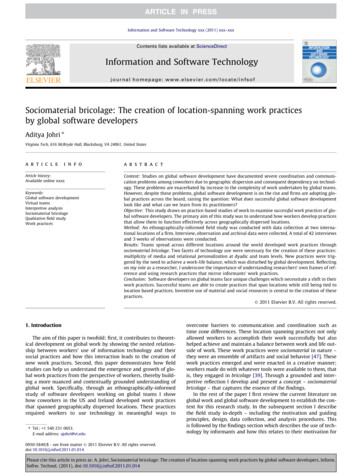
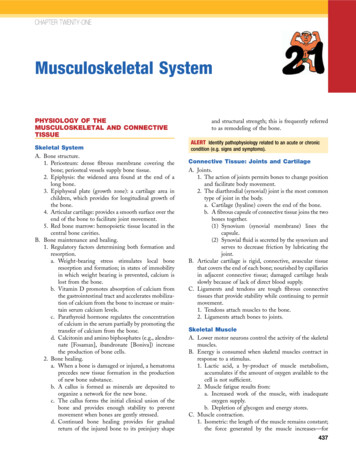
Example: BOS‐SEA TraditionalFaresRound‐TripFare ( )ClsAdvancePurchaseMinimumStayChangeFee?Comment 458N21 daysSat. NightYesTue/Wed/Sat 707M21 daysSat. NightYesTue/Wed 760M21 daysSat. NightYesThur‐Mon 927H14 daysSat. NightYesTue/Wed 1001H14 daysSat. NightYesThur‐Mon 2083B3 daysNoneNo2xOW Fare 2262YNoneNoneNo2xOW Fare 2783FNoneNoneNoFirst ClassFigure 4.5
Fare Simplification:Less Restricted and Lower Fares Recent trend toward “simplified” fares –compressed farestructures with fewer restrictions– Initiated by some LFAs and America West, followed by Alaska– Most recently, implemented in all US domestic markets byDelta, matched selectively by legacy competitors Simplified fare structures characterized by:– No Saturday night stay restrictions, but advance purchase andnon‐refundable/change fees– Revenue management systems still control number of seatssold at each fare level Higher load factors, but 10‐15% lower revenues:– Significantly higher diversion with fewer restrictions
Example: BOS‐ATL Simplified FaresDelta Air Lines, April 2005
Revenue Impact of Each “Simplification”
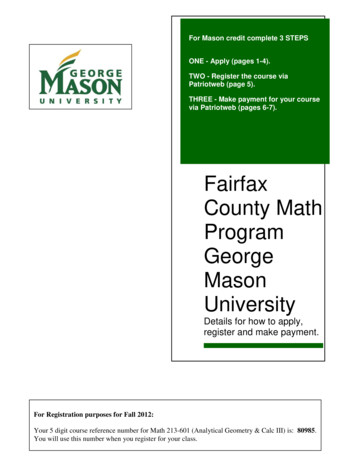
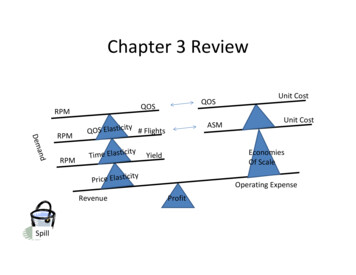
PriceImpacts on Differential Pricing ModelDemand Drop in businessdemand and willingnessto pay highest fares Greater willingness toaccept restrictions onlower fares Reduction in lowestfares to stimulate trafficand respond to LCCs Result is lower totalrevenue and unit RASMdespite stable loadfactors
Airline Revenue Management
Airline Revenue Management Two components of airline revenue maximization:Differential Pricing:– Various “fare products” offered at different prices fortravel in the same O‐D marketYield Management (YM):– Determines the number of seats to be made available toeach “fare class” on a flight, by setting booking limits onlow fare seats Typically, YM takes a set of differentiatedprices/products and flight capacity as given:– With high proportion of fixed operating costs for acommitted flight schedule, revenue maximization tomaximize profits
Why Call it “Yield Management”? Main objective of YM is to protect seats for later‐booking,high‐fare business passengers. YM involves tactical control of airline’s seat inventory:– But too much emphasis on yield (revenue per RPM) can leadto overly severe limits on low fares, and lower overall loadfactors– Too many seats sold at lower fares will increase load factorsbut reduce yield, adversely affective total revenues Revenue maximization is proper goal:– Requires proper balance of load factor and yield Many airlines now refer to “Revenue Management”(RM)instead of “Yield Management”
Seat Inventory Control ApproachesFigure 4.11
Computerized RM Systems Size and complexity of a typical airline’s seat inventorycontrol problem requires a computerized RM system Consider a US Major airline with:500 flight legs per day15 booking classes330 days of bookings before departure At any point in time, this airline’s seat inventory consistsof almost 2.5 million booking limits:– This inventory represents the airline’s potential for profitableoperation, depending on the revenues obtained– Far too large a problem for human analysts to monitor alone
Typical 3rd Generation RM System Collects and maintains historical booking data byflight and fare class, for each past departure date. Forecasts future booking demand and no‐show ratesby flight departure date and fare class. Calculates limits to maximize total flight revenues:– Overbooking levels to minimize costs of spoilage/deniedboardings– Booking class limits on low‐value classes to protect high‐fare seats Interactive decision support for RM analysts:– Can review, accept or reject recommendations
Example of Third Generation RM SystemFigure 4.12
Revenue Management Techniques Overbooking– Accept reservations in excess of aircraft capacity toovercome loss of revenues due to passenger “no‐show”effects Fare Class Mix (Flight Leg Optimization)– Determine revenue‐maximizing mix of seats available toeach booking (fare) class on each flight departure Traffic Flow (O‐D) Control (Network Optimization)– Further distinguish between seats available to short‐haul(one‐leg) vs. long‐haul (connecting) passengers, tomaximize total network revenues
Flight Overbooking Determine maximum number of bookings to acceptfor a given physical capacity. Minimize total costs of denied boardings andspoilage(lost revenue). U.S. domestic no‐show rates can reach 15‐20 percentof final pre‐departure bookings:– On peak holiday days, when high no‐shows are leastdesirable– Average no‐show rates have dropped, to 10‐15% withmore fare penalties and better efforts by airlines to firmup bookings Effective overbooking can generate as much revenuegain as fare class seat allocation.
Overbooking Terminology Physical CapacityCAP– Actual # of seats on the flight, usually maximum capacity ofthe aircraft Authorized CapacityAU– Maximum # of bookings that an airline is willing to accept Confirmed BookingsBKD AU– Total # of passenger reservations that have been accepted No Show RateNSR– Mean % of passengers with confirmed bookings that do notshow up Denied Boardings Spoilage Show up RateDBSPSUR
Overbooking Models Overbooking models try to minimize:– Total costs of overbooking (denied boardingsplus spoilage)– Risk of “excessive” denied boardings onindividual flights, for customer service reasons Mathematical overbooking problem:– Find OV 1.00 such that AU CAP * OV– But actual no‐show rate is highly uncertain
Manual/Judgmental Approach Relies on judgment of human analyst to setoverbooking level:– Based on market experience and perhaps recentno‐show history– Tendency to choose OV 1 NSR (or lower)– Tendency to focus on avoidance of DB For CAP 100 and mean NSR .20, then:AU 100 (1.20) 120
Deterministic Model Based on estimate of mean NSR from recenthistory:– Assume that BKD AU (“worst case”scenario)– Find AU such thatAU ‐NSR*AU CAP– Or, AU CAP/(1‐NSR) For CAP 100 and NSR 0.20, then:AU 100/(1‐.20) 125
Probabilistic/Risk Model Incorporates uncertainty about NSR for future flight:– Standard deviation of NSR from history, STD Find AU that will keep DB 0, assuming BKD AU, with a95% level of confidence:– Assume a probability (Gaussian) distribution of no‐show rates Keep show‐ups less than or equal to CAP, when BKD AU:– Find SUR*, so that AU x SUR* CAP,and Prob[AU x SUR* CAP] 5% From Gaussian distribution, SUR* will satisfy:Z 1.645 SUR* ‐SURSTDwhere SUR mean show‐up rateSTD standard deviation of show‐up rate
Probabilistic/Risk Model (cont.) Optimal AU given CAP, SUR, STD with objective ofDB 0 with 95% confidence is:AU CAPSUR 1.645 STD CAP1‐NSR 1.645 STD In our example, with STD 0.05 & NSR .20:AU 100 / (1‐0.20 1.645*0.05) 113 The larger STD, the larger the denominator and thelower the optimal AU, due to increasedrisk/uncertainty about no‐shows.
More Overbooking Terminology Waitlisted passengersGo‐show passengersStand‐by passengersNo‐showsShow‐upsPassengers BoardedVoluntary DBWLGSSBNSSUPAXVOLDB
Probabilistic Model Extensions Reduce level of confidence of exceeding DB limit:– Z factor in denominator will decrease, causing increase inAU Increase DB tolerance to account for voluntary DB:– Numerator becomes (CAP VOLDB), increases AU Include forecasted empty F or C cabin seats forupgrading:– Numerator becomes (CAP FEMPTY CEMPTY), increases AU– Empty F C could also be “overbooked” Deduct group bookings and overbook remainingcapacity only:– Firm groups much more likely to show up– Flights with firm groups should have lower AU
Cost‐Based Overbooking Model Find AU that minimizes :[Cost of DB Cost of SP] For any given AU:Total Cost DB * E[DB] SP * E[SP] DB and SP cost per DB and SP, respectivelyE[DB] expected number of DBs, given AUE[SP] expected number of SP seats, given AU Mathematical search over range of AU values to findminimum total cost.
Example: Cost‐Based Overbooking Model
Cost Inputs to Overbooking Model Denied Boarding Costs:– Cash compensation for involuntary DB– Free travel vouchers for voluntary DB– Meal and hotel costs for displaced passengers– Space on other airlines– Cost of lost passenger goodwill costs Many airlines have difficulty providingaccurate DB cost inputs to these models.
Dynamic Revision and Intervention RM systems revise forecasts and re‐optimize bookinglimits at numerous “checkpoints” of the booking process:– Monitor actual bookings vs. prev
Revenue Management Techniques Overbooking – Accept reservations in excess of aircraft capacity to overcome loss of revenues due to passenger “no‐show” effects Fare Class Mix (Flight Leg Optimization) – Determine revenue‐maximizing mix of seats available toFile Size: 636KBPage Count: 70