Transcription
Introducing a web application for labeling, visualizing speech and correctingderived speech signalsRaphael Winkelmann, Georg RaessInstitute of Phonetics and Speech ProcessingSchellingstraße 3, 80799 Münchenraphael@phonetik.uni-muenchen.de, graess@phonetik.uni-muenchen.deAbstractThe advent of HTML5 has sparked a great increase in interest in the web as a development platform for a variety of different researchapplications. Due to its ability to easily deploy software to remote clients and the recent development of standardized browser APIs, weargue that the browser has become a good platform to develop a speech labeling tool for. This paper introduces a preliminary versionof an open-source client-side web application for labeling speech data, visualizing speech and segmentation information and manuallycorrecting derived speech signals such as formant trajectories. The user interface has been designed to be as user-friendly as possible inorder to make the sometimes tedious task of transcribing as easy and efficient as possible. The future integration into the next iterationof the EMU speech database management system and its general architecture will also be outlined, as the work presented here is onlyone of several components contributing to the future system.Keywords: EMU, web application, labeling1.IntroductionIn recent years, user-friendly systems for automaticallygenerating aligned phonetic transcriptions given a speechsignal and an orthographic transcription have emerged (Reichel, 2012; Kisler et al., 2012; Schiel, 1999). A furtherwell established method in the research community is theusage of detection algorithms for derived speech signals,such as formant trajectories, to make manual formant tracing or other forms of manual feature extraction redundant.Although these procedures can achieve very usable results,they still struggle to match the precision of a manual transcription or a manually corrected derived signal (Schiel etal., 2011). However, certain phonetic research requires thismanual precision. Although preexisting tools such as Praat(Boersma and Weenink, 2013) and ELAN (Wittenburg etal., 2006) have the ability to achieve these tasks for mostlabeling needs, they lack the ability to easily integrate theoutput of external algorithms and other data, such as articulator movement contours produced by electromagnetic articulography (EMA) recordings, into their interfaces. However, such integration of external algorithms and other supplementary data is often necessary to provide a visual aidor for correction purposes.The current EMU speech database management system(Cassidy and Harrington, 1996; Cassidy and Harrington,2001) achieves this by being able to read, display andmanipulate any time-discrete signal contours that can beconverted into the simple signal file format (SSFF) (Cassidy, 2013). Unfortunately due to several maintainabilityand other issues of the current EMU DB system, we havemade the decision to reimplement the system almost fromscratch. In doing so we are trying to keep most of the concepts of the current system in place while improving onthings like usability, maintainability, scalability, stability,speed and more.The tool presented here is one of several components comprising the next iteration of EMU (see Section 5. for anoverview of all the components). Here we introduce theEMU-webApp, which is a browser-based labeling and correction tool that offers simple mechanisms for integratingexternally produced transcripts and derived signal files suchas formant trajectories much like the current EMU DB system.2.The browser as the graphical userinterfaceTwo of the initial key requirements for writing a graphical user interface (GUI) for the next iteration of the EMUspeech database management system were to write an interface that is cross-platform and as easy as possible for theuser to install. Due to dependency issues, installation isunfortunately an issue in the current EMU DB system. Theclassical approach to building cross-platform GUIs is eitherusing a cross-platform widget toolkit or implementing multiple versions of the same GUI to accommodate the different platforms. The browser offers a unified solution to thisproblem that fits the write-once-run-everywhere paradigmbetter than most alternatives. Today most machines, including mobile devices such as smart-phones and tablets,already have the appropriate runtime for a web applicationinstalled. If such a browser is available to the user, the installation process is as simple as pointing the browser to aspecific URL.Not long ago, browsers did not have the features neededfor the implementation of our tool natively available. Onlyrecently have modern browsers gained the ability to implement a full client-side implementation of a speech labelingtool. This is due to the development and standardization ofseveral new browser APIs as part of the HTML5 specification.The development of the file API (W3C, 2013a) and webworker API (W3C, 2013d) for accessing files on the user’shard drive and running time-intensive tasks such as calculating and drawing a spectrum asynchronously are examples of new browser functionalities.4129
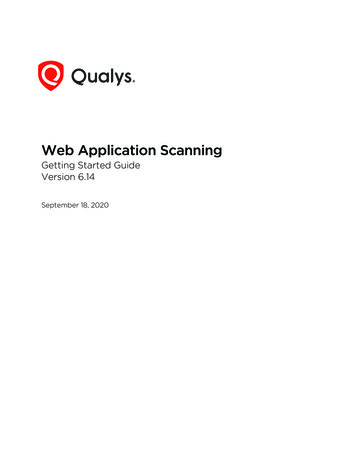
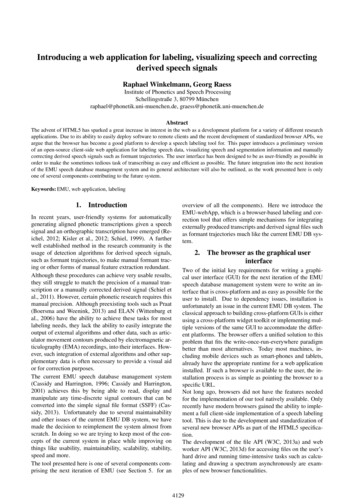
2.1.ConnectionA large benefit gained by choosing the browser as the userinterface is the ability to easily interact with a backendserver or other servers using standard web protocols, suchas http/https or websockets. Using these standard protocols data can easily be shared between the backend and theclient. As simple static web servers can easily be implemented in a multitude of programming languages, hostinga private version of the client is fairly simple. If the userdoes not wish to host her/his own version of the interface, alive public version of the interface is available on the worldwide web1 .For the communication with a backend server we havedeveloped a simple communication protocol (see Section4.2.) that can easily be implemented in various server-sideprogramming languages. Once a connection is establishedthe backend provides the interface with data that adheres tothe data interfaces provided by our tool (see Section 4.1.).However, the web application can also be used in standalone mode, without the need for a backend (see section3.3.)We are currently working on a client-side websocket serverimplementation that will run within the R Project for Statistical Computing (R Development Core Team, 2011). Thiswill allow the user to serve local data to the web applicationby running a local server that implements the communication protocol (see Section 5.).3.the order in a configuration file, the default is to visualizethe oscillogram and spectrogram one on top of the other.Due to a flexible configuration approach it is also possible to display further tracks such as fundamental frequencycontours either as overlays on the spectrogram/oscillogramor on separate canvases. All of the tracks can be resized asa propotion of window space using the split screen slider.The time-aligned levels of the currently loaded annotationfile(s) are displayed below the split screen slider.To the left of the interface is a hideable side menu to displaythe current bundles offered by the backend and to the righta further menu to switch between different pre-configurableviews of the data.3.1.Labeling work-flowTo ease labeling as much as possible, a lot of attention hasbeen given to implementing features often requested by experienced labelers. One much requested feature is the integration of an overview of the entire signal to improve thenavigation within a signal. This feature is integrated intothe bottom menu bar in the form of a scrollable mini-mapof the oscillogram (see Figure 1). Others features (mostavailable via keyboard shortcuts) include: snap selected boundary to nearest bottom boundary snap selected boundary to nearest top boundary select/move multiple segmentsThe interface add/delete time to start/end of (multiple) segments unlimited undos/redos of edits zooming while holding a boundary in specific position multiple views of the data (via the configuration ofperspectives)Figure 1: EMU-webApp displaying a bundle from the aecorpusThe general layout of the interface (see Figure 1) consistsof two menu bars (top and bottom) containing buttons forfrequent commands, such as opening and saving files, connecting to a backend server and the audio and zoom controls. However, users are advised to familiarize themselveswith the keyboard shortcuts to control and navigate the interface, as there are certain features that can only be accessed using these. A list of the key commands can befound in the About dialog. This dialog can be accessed byclicking on the application icon, which is located on theright hand side of the top menu bar.The signal tracks are displayed beneath the top menu bar.Although the order of the tracks can be altered by changing1http://ips-lmu.github.io/EMU-webApp/To further aid the user the interface allows her/him to fullypre-configure the keyboard shortcuts. Most of the defaultkeyboard shortcuts are centered around the W-A-S-D keyswhich represent the navigation shortcuts.To select a certain boundary the user hovers the mouse cursor over a level. By doing so the cursor position is automatically tracked and the nearest boundary in the current levelis calculated and automatically preselected and marked. Ifthe user wishes to move the boundary, she/he holds downthe shift key on the keyboard to select and move the boundary to the desired position without the need for left-clickingthe mouse. The same is possible for segments, althoughthese are explicitly selected by clicking on the accordingsegment and moved by holding down the alt key. To changethe label of any given segment or event boundary, the usersimply double clicks the desired item. Generating new segment boundaries can be achieved using the Return key. Acomprehensive list of all the features can be found in theAbout dialog.3.2.Visualizing and correcting dataAs formant values sometimes need to be manually corrected, the web application is not only able to visualize but4130
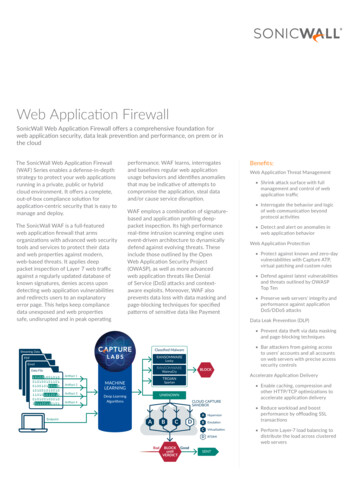
also to correct pre-calculated formant tracks. After loading the files that are to be corrected, these can be displayedas a frequency-aligned overlay over the spectrogram, anoverlay over the oscillogram or in a separate signal canvas.The frequency-aligned spectrogram overlay is the obviouschoice for correcting formant contours (see Figure 2).face can delegate several tasks to the server. The server canthen take care of such things as file/database handling, signal processing and user management on datasets, to namea few. This means that the labeler can be integrated intomany different setups and adapted to the requirements ofthe given scenario.4.ImplementationAs per the definition of a web application, the interface iswritten entirely in HTML, Javascript and CSS2 . This enables the complete labeling functionality to be accessed online as well as offline in a browser. The offline functionalityof the EMU-webApp is achieved by using the HTML5 application cache browser API (W3C, 2013b). To ease testingand to enable easy integration and extendability we choseto use the AngularJS Javascript framework (Google, 2014).4.1.Figure 2: second formant being corrected using the formantcorrection toolBefore beginning the formant correction process, the corresponding correction tool is chosen by pressing the 1 keyto alter the first formant, the 2 key to alter the second andso on. Once the desired tool has been chosen, the contourscan be manually redrawn by grabbing the relevant samplesusing the shift key and moving the mouse to the desiredposition.This feature is almost completely analog to correction possibilities in the current EMU speech database managementsystem. However, the correction work-flow is improved byproviding the user with unlimited undo/redo functionality.This enables the labeler to toggle between all the variouschanges made to the formant contours.3.3.Although subject to change, a short overview of the datamodel and the file reading capabilities are presented here.The internal label data model is represented as a simpleJavascript object whose corresponding Javascript object notation (JSON) can be seen in Listing 1. We chose to usesamples to represent our label boundary times, which isalso reflected by the interface design, to avoid confusioncaused by fractional digit precision and to have definitesample-segment affiliations.In future releases, the links array in the JSON representation in Listing 1 will be used to represent hierarchical annotation structures known from the current EMU DB system(see Section 5.).Listing 1: label representation{"name": "msajc003","annotates": "path/to/msajc003.wav","sampleRate": 20000,"levels": [{"name": "Phonetic","type": "SEGMENT","items": [{"id": 1,"label": "V","sampleStart": 3750,"sampleDur": 1390 },.]},.],"links" : [{"fromID" : 1,"toID" : 102},.]Modes of usageThe EMU-webApp can be used in two different modes depending on the intended scenario. The first is the standalone mode, the other the client mode (in a client-serverenvironment).The stand-alone mode is meant as an ad-hoc solution whensmall changes to a corpus/file collection have to be made.Used in this way, the application can be used in a fairlysimilar fashion to the labeler offered by Praat (Boersmaand Weenink, 2013). However, it has the ability to display externally-computed derived signals (e.g. by thelibassp library (Scheffers and Bombien, 2012)) as wellas other time parallel contours that where acquired duringthe recording (e.g. EMA tongue contours). In this mode,the labeler uses the aforementioned file API to handle thefile loading. Unfortunately, there is no browser API forwriting data back to the user’s hard drive. For security reasons, browsers do not allow web applications to touch thehard drive outside of a so-called sandbox. This means thataltered files are offered as a download to the user if she/hewants to save the changes to disc. In future version we planfor this to be done by dragging and dropping the respectivefile to the place the user wishes to save the file.The more flexible of the two modes is the client mode. Bybeing integrated into a client-server environment the inter-Files and data model}For the web application to be able to convert existing labelfiles to the format depicted in its stand-alone mode, several transcription file parsers are available. This includes2The code can be found here: https://github.com/IPS-LMU/EMU-webApp4131
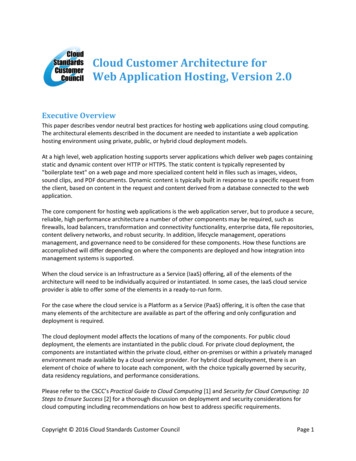
GETPROTOCOL: Check if the server speaks the sameprotocola parser for the labeling format used by the EMU DB system (ESPS/waves label format) and a Praat TextGrid fileparser. The above JSON representation can of course alsobe parsed directly.The same holds true for the signal format. A Javascriptparser is available to convert the simple signal file format,used by the current EMU and the libassp library, to theinternal Javascript object (see Listing 2 for its JSON representation). The SSFF file format, upon which our internalrepresentation is based, has proven itself to be a very flexible file format: flexible enough to represent anything fromformant values (fm) and their bandwidths (bm), as in Listing 2, to EMA contours and entire spectrograms. GETDOUSERMANAGEMENT: See if the server handlesuser management (if yes this prompts a login dialog LOGONUSER) GETGLOBALDBCONFIG: Request the configurationfile for the current connection GETBUNDLELIST: Request the list of available bundles for current connection GETBUNDLE: Request data belonging to a specificbundle nameListing 2: signal format representation SAVEBUNDLE: Save data belonging to a specific bundle name{"ssffTrackName": "FORMANTS","sampleRate" 200,"origFreq" 20000,"startTime" 0.0025,"columns" [{"name": "fm","length": 4,"ssffDataType": "SHORT""values" : [[0, 1042, 2072, 3170],[0, 1260, 2122, 3118],[0, 1339, 2293, 3258],.]},{"name": "bw","length": 4,"ssffDataType": "SHORT""values" : [[0, 886, 371, 890],[0, 724, 567, 826],[0, 410, 664, 740],.]}]Due to the inability to perform cross-domain request, viaregular http/https, the web application currently uses thewebsocket protocol to allow the EMU-webApp to connectto any websocket servers that implement the above protocol. In future versions we also hope to include crossorigin resource sharing (CORS) (W3C, 2014) support intothe client. This will enable regular http/https servers thatimplement the protocol and have CORS enabled to communicate with the EMU-webApp.5.As mentioned, this interface will be part of a larger softwaresuite aiming to be the next iteration of the EMU speechdatabase management system. This new software suite willenable the user to have a self-contained system on her/hismachine without having to rely on network connectivity. Asimplified overview of the future system architecture can beseen in Figure 3.}EMU-webAppThe EMU-webApp can also convert the above-mentionedlabel file format to either the Praat TextGrid or the ESPS/waves label format and offer them to the user as downloadable files. For the user this means she/he can use thelabeler in stand-alone mode to do ad-hoc labeling of PraatTextGrid files, the ESPS/waves label format and the newJSON label format shown in Listing 1.Due to restrictions concerning the decoding flexibility ofthe popular web audio API (W3C, 2013c), which alwaysdecodes files to the system’s default sample rate, we havemade the decision to implement our own .wav file decoder.This means that the EMU-webApp can currently only readuncompressed mono .wav files. Further decoders mightbe added in future releases.4.2.Future workCommunication protocolTo standardize the communication between the client andserver we have developed a simple request-response communication protocol. This protocol defines a set of JSONobjects for both the requests and responses. The definedrequest-response actions, most of them triggered by theclient after connection, are:websocket connectionwrasspSignal proc.EMU-rPackageSignal proc.file/DB handlingfiles comprising speechDBFigure 3: future system architectureThe system will be largely based in the R language for Statistical Computing. Two R packages (the gray items in Figure 5.) are currently being developed to complete the system, one being the wrassp package, which as the nameimplies, is a port of the libassp library to a native C extension for R. This package will be responsible for handling the speech signal processing. The EMU-rPackagewill handle database manipulation and querying as well as4132
serve as a local websocket server to communicate with theinterface presented in this paper. This infrastructure willprovide researchers with a self-contained system to querydatabases, perform signal processing and statistical evaluations all within the same environment. Being autonomous,however, wrassp and the web application will also be ableto be used separately if desired.The tool presented here is still in the early stages of development. One of the key and most powerful features of thecurrent EMU DB system is the ability to annotate and queryhierarchical annotation structures. Although our annotationformat (see section 4.1.) allows items to be linked, the interface is not yet able to display and edit these hierarchicalstructures. In future releases we hope to accomplish thistask.Further future efforts will include improving the stability,extending the parsing/file-handling capabilities, optimizingthe EMU-webApp for mobile devices and more.6.AcknowledgementsResearch supported by the European Research CouncilGrant (295573) to Jonathan Harrington and the CLARIN-Dproject (BMBF-FKZ: 01UG1120A).7.’New Tools and Methods for Very-Large-Scale PhoneticsResearch’, University of Pennsylvania, USA.Florian Schiel. 1999. Automatic Phonetic Transcriptionof Non-Prompted Speech. In Proc. of the ICPhS, pages607–610, San Francisco, August.W3C. 2013a. File API. http://www.w3.org/TR/FileAPI/.W3C. 2013b. Offline apps. e.html.W3C. 2013c. Web Audio API. /specification.html.W3C. 2013d. Workers. http://www.w3.org/TR/workers/.W3C. 2014. Cross-Origin Resource Sharing. http://www.w3.org/TR/cors/.Peter Wittenburg, Hennie Brugman, Albert Russel, AlexKlassmann, and Han Sloetjes. 2006. Elan: a professional framework for multimodality research. In Proceedings of LREC, volume 2006.ReferencesPaul Boersma and David Weenink. 2013. Praat: doing phonetics by computer (Version 5.3.56)[Computerprogram]. Retrieved October 9, 2013. http://www.fon.hum.uva.nl/praat/.Steve Cassidy and Jonathan Harrington. 1996. Emu: Anenhanced hierarchical speech data management system.In Proceedings of the Sixth Australian InternationalConference on Speech Science and Technology, pages361–366.Steve Cassidy and Jonathan Harrington. 2001. Multi-levelannotation in the emu speech database management system. Speech Communication, 33(1):61–77.Steve Cassidy. 2013. The Emu Speech Database System Manual: Chapter 9. Simple Signal File Format. oogle. 2014. AngularJS. http://angularjs.org/.Thomas Kisler, Florian Schiel, and Han Sloetjes. 2012.Signal processing via web services: the use case WebMAUS. In Proceedings Digital Humanities 2012, Hamburg, Germany, pages 30–34, Hamburg.R Development Core Team, 2011. R: A Language and Environment for Statistical Computing. R Foundation forStatistical Computing, Vienna, Austria. ISBN 3-90005107-0.Uwe D. Reichel. 2012. PermA and Balloon: Tools forstring alignment and text processing. In Proc. Interspeech, page paper no. 346, Portland, Oregon.Michel Scheffers and Lasse Bombien. 2012. libassp advanced speech signal processor, 03.Florian Schiel, Christoph Draxler, and Jonathan Harrington. 2011. Phonemic Segmentation and Labelling usingthe MAUS Technique. In Proceedings of the Workshop4133
Introducing a web application for labeling, visualizing speech and correcting derived speech signals Raphael Winkelmann, Georg Raess . Abstract The advent of HTML5 has sparked a great increase in interest in the web as a development platform for a variety of different research applicat