Transcription
FlightSim CommunitySurvey 2021Final Report
Copyright Notice 2021 NavigraphBy licensing our work with the CC BY-SA 4.0 license it means that you are more than welcome tocopy, remix, transform and build upon the results of this survey and then redistribute it to whomeveryou want in any way.You only have to give credit back to Navigraph and keep the same /4.0/2
PreambleAnother year is about to close, and it is time to summarize the flight simulation year. It amazes mewhat the collective efforts of the community can accomplish. Last year 23,500 respondentsparticipated in the survey. I was convinced that this had to be some sort of plateau. Just thinkingabout 23,500 people is mind-boggling. That’s more people than citizens in the little country townwhere I grew up! It blew my mind when my colleague Andreas Goodholm reported on closing datethat this year no less than 24,200 respondents had contributed to the survey!In this report we summarize the results of the 93 questions in the survey. We cover flight simulatorpreference, flight simulation habits, flight training, various demographics, virtual reality, graphicscard, Xbox usage, preferences in addon software, and much more.While the respondents’ input are crucial, they are not the only ingredient in this Christmas cake wecall the survey. In fact, this survey is the result of a collaborative effort between partners –developer, companies, organizations and media outlets in the flightsim community. Navigraph’s roleis to organize, design and compile the survey and make the results freely available for the commongood of the flightsim community to guide future projects and ultimately to attract new pilots.At Navigraph Andreas Goodholm, Stephen O’Connell, and myself have coordinated the efforts inproducing this survey. It’s been hard work, but also fun and interesting. We hope you enjoy readingit!Stockholm, December 2021Magnus AxholtCEO & Co-Founder3
Table of Contents1. Introduction81.1. Partners . 81.2. Purpose and Target Audience . 101.3. Data Protection . 101.4. Previous Work . 102. Method123. Analysis133.1. Respondents . 133.2. Demographics. 143.2.1. Age . 143.2.2. Gender . 153.2.3. Employment Status . 163.2.4. Country . 173.2.5. Education . 193.2.6. Income . 203.3. Relation to Aviation . 213.3.1. Work . 213.3.2. Pilot License . 223.3.3. Simulation in Relation to Aviation . 243.3.4. Flight School Enrollment . 253.3.5. Flight Lesson Consideration. 263.4. Simulator Habits - Mobile. 273.4.1. Mobile Simulation Interest . 273.4.2. Online Simulation . 283.4.3. Air Traffic Control . 283.4.4. EFB Usage . 293.5. Simulator Habits - Air Traffic Control . 303.5.1. ATC Simulation Interest . 303.5.2. ATC Simulation Usage . 313.7. Simulator Habits – General . 333.7.1. Aircraft Types . 333.7.2. Usage . 353.7.3. Roles . 374
3.7.4. Platforms . 383.7.5. Purpose. 393.7.6. Flight Rules . 403.7.7. ATC. 413.8. Consumption Habits . 423.8.1. Software Expenses . 423.8.2. Hardware Expenses . 443.8.3. Inability to Purchase Hardware . 463.8.4. Preferred Online Stores . 473.8.5. Freeware Versus Payware . 493.9. Community . 503.9.1. Conferences . 503.9.2. Contribution . 513.9.3. Communication Platforms. 533.9.4. Virtual Airline Membership . 553.9.5. Online Flying . 563.9.6. Online Network Preference. 573.10. Simulator Platform . 583.10.1. Simulator Software . 583.10.2. Simulator Software Change . 603.10.3. X-Plane 12 Purchase Likelihood. 643.10.4. Computer. 653.10.5. Operating System . 663.10.6. Graphics Card Usage . 673.10.7. Graphics Card Satisfaction. 703.10.8. VRAM Storage . 713.10.9. Xbox Consoles. 733.10.10. Console Activity . 743.10.11. Console Controller . 753.10.12. Internet Connection Speed . 773.10.13. Auxiliary Systems . 783.10.14. Qualified Training Device . 803.11. Virtual Reality . 813.11.1. Ownership . 813.11.2. Brand . 823.11.3. VR Simulator Software . 845
3.11.4. VR Session Duration . 853.11.5. VR Flight Types . 863.11.6. VR vs Desktop Flying. 873.11.7. VR Desktop Switch. 883.11.8. VR Plugins/Mods . 893.12. Addons in General . 903.12.1. Addon Purchase Influences . 903.13. Aircraft Addons. 923.13.1. Aircraft Feature Importance. 923.14. Scenery and Weather . 943.14.1. Scenery Importance . 943.14.2. Airport Importance . 953.14.3. Weather Sources . 963.14.4. Weather Importance . 973.15. Charts Products and Addons . 993.15.1. Charts Products Popularity . 993.15.2. Charts Products Awareness . 1013.15.3. Charts Preference . 1023.15.4. Flight Tracking Products . 1033.16. NavData/FMS Data . 1043.16.1. NavData/FMS Data Products Popularity . 1043.17. Flight Planning . 1053.17.1. Usage . 1053.17.2. Services . 1073.17.3. Important Features . 1093.18. Training . 1103.18.1. Learning . 1103.18.2. Learning Method . 1113.19. Media. 1123.19.1. Media Consumption . 1123.20. Video. 1143.20.1. Platform Preference . 1143.21. Survey Meta Analysis . 1163.21.1. Participation . 1163.21.2. Survey Experience . 1174. Results1196
4.1. First a Word on Sampling Bias and Validity . 1194.2 Brief Summary . 1194.3 Discussion . 1204.3.1. Simulation Platform Popularity . 1204.3.2. Xbox Console . 1214.4. Survey Meta Analysis. 1225. Future Work1227
1. Introduction1.1. PartnersThe FlightSim Community Survey 2021 is a collaborative effort conducted by the developers,organizations and companies alphabetically presented in the list of partners below. AerosoftCarenadoCruiselevel.deDigital Flight DynamicsDrzewiecki actu.frFlightSimLabsFlightSimulator.blogFly By WireFSEliteFSExpoFSMagazinFSNewsGaya SimulationsGeoFSHeliSimmer.comHoneycombInfinite FlightIVAOLaminar ResearchLittle NavmapMeteonauticsMilVizNavigraphORBXPC PilotPinpoint SimulationsPMS50ProSimRealSimGearREXSalty SimulationsSim4FlightSimFlightSynaptic Simuations8
TFDiThresholdx.netVATSIMNavigraph was responsible for coordinating, designing, compiling and funding the survey, as well asauthoring this document.9
1.2. Purpose and Target AudienceThe primary purpose of the survey is to provide the participating partners with information about theflight simulation community so that they are better able to: recruit new pilots to the flight simulation communitydevelop products and services in response to pilots’ needs and requestsThe secondary purpose of the survey is to provide all members of the flight simulation communitywith information so that they are better able to: find resources to develop their flight simulation interestmaintain and develop the community1.3. Data ProtectionThe data was collected from the respondents anonymously without storing any personallyidentifiable information. The results are presented in aggregated form, never individually. The datawas collected in the legitimate interest pursued by Navigraph and the partners. To the best of ourjudgement, the survey was conducted in a fashion compliant with the General Data ProtectionRegulation (EU) 2016/679. For any questions regarding user privacy, please contactcontact@navigraph.com.1.4. Previous WorkVATSIM conducted a survey in 20061. It had 6,691 respondents.AVSIM has previously published a demographic survey for the flight simulation community. The mostrecent one was made in 20132. It had approximately 2,800 respondents.Laminar Research has collected usage data from its X-Plane simulator and published two reports3 inNovember 2017, and June 2018.Navigraph has previously conducted customer surveys. In 20174 it had 3,187 respondents. In 20162,200 participated. While these surveys had significant portions aimed at product feedback specificfor Navigraph, it also had demographics questions included from the AVSIM survey.Navigraph has also, with the help of partners, conducted a previous flight community survey in 20185which has 15,000 respondents, in 20196 which had 17,800 respondents, and 20207 which had 23,500respondents.It is our impression that there have been additional small surveys completed in the past. Either theyhave been published by various developers with the intent of obtaining specific product feedback; urvey-results210
they have been published by interest organizations with the intent of obtaining feedback of theparticular operations of that organization.The flightsim community surveys 2018, 2019, 2020 and 2021 are different in that they have: a larger sample size, i.e. many more respondents compared to any previous flight simulationcommunity survey to datea sample which represents multiple user groups, i.e. users from various developers andmembers from various organizations11
2. MethodNavigraph began by posting an official invite on social media and in the Navigraph newsletter forpartners to collaborate on the survey. Partners who participated to the survey earlier years werecontacted directly via email. To get a representative sample of the community partners were chosenfrom as many different parts of the flightsim community as possible.Partners were asked to submit areas of particular interest to them. Navigraph edited, consolidated,and designed questions based on the partners’ areas of interest.All partners were asked to publish an individual survey link at a specific date and time. The partnerswere free to choose how to distribute the link, but many chose to publish on social media, forums,websites, and in newsletters. The individual links permitted tracking of how successful each partnerwas at gathering respondents to the survey.The respondents were not compensated for their contribution. The incentive for the respondents tocontribute to the survey is the possibility to guide development in the flightsim community. Theincentive for the partners to contribute to the survey is the possibility to direct the survey intovarious areas of interest and reach a wider audience compared to publishing an individual surveythemselves.The information presented in this survey report is only diagrams over aggregated data. No otheranalysis as to statistical significance, power, or confidence interval has been done.12
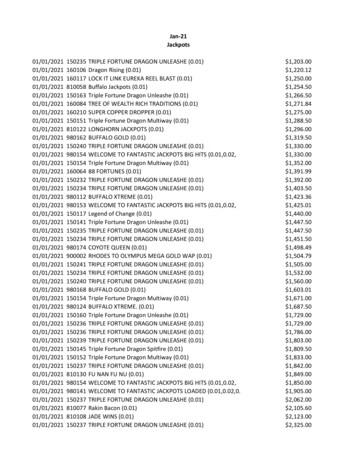
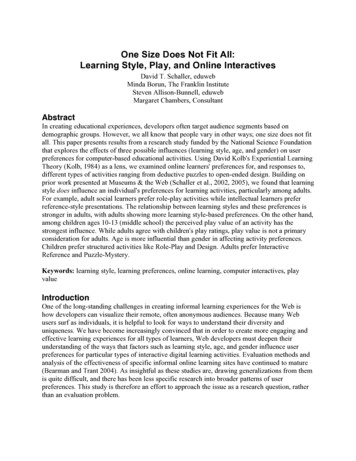
3. Analysis3.1. RespondentsThe survey had 24,200 (23,476) respondents out of which 70% (62%) completed the 93 (119)questions in the survey and spent on average 21 (22) minutes. (Last year’s values withinparentheses.)The diagram below illustrates the number of respondents clicking a link published by a surveypartner over time starting from November 26 when the link to survey was first published, until noonof December 6 when the survey closed. Navigraph, illustrated at the top of the diagram contributedwith the most respondents followed by Orbx, Honeycomb, GeoFS, and FSElite. All partners whocontributed with less than 100 respondents are aggregated into the bottom bar.Survey Respondents by Partner01,000 2,000 3,000 4,000 5,000 6,000 7,000 8,000 9,000NavigraphOrbxHoneycombGeoFSFSEliteFly By WireInfinite mFlightHelisimmerflightsim.comPinpointDigital Flight lightGearFSNewsSalty SimulationsPartners 100 respondents13
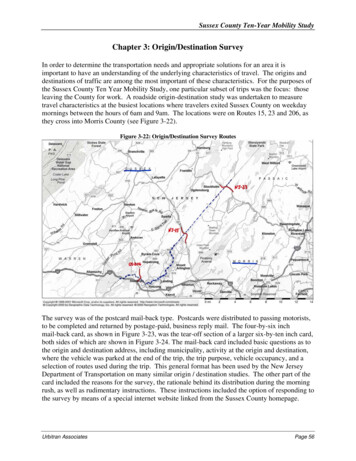
3.2. Demographics3.2.1. AgeThe rather even distribution suggests that flight simulation is interesting to people of all ages. Whilethe bulk of the users are in the range of 15-85 years, we notice a peak around 20 and an impressivetail towards 85.The age distribution this year is very similar to those of the three previous surveys, in terms of rangebut also with the distinct peak around 20.How old are %5101%0%0%0%9095 1000%0%9095 1000%1520253035404550556065706%6%758085YearsLast year’s result:How old are 5101%0%0%152025303540455055Years14606570758085
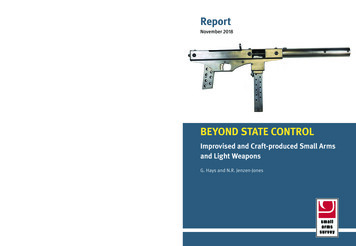
3.2.2. GenderFlight simulation continues to be a predominantly male activity. The results are the same as theprevious years.What best describes your %0.2%1.4%Non BinaryOtherPrefer not tosay0%FemaleMaleLast year’s result:What best describes your .0%20.0%10.0%0.9%0.3%0.2%1.6%Non BinaryOtherPrefer not tosay0.0%FemaleMale15
3.2.3. Employment StatusMost flight simulator pilots are either employed full-time or fully retired. Compared to the previousyear, the number of furloughed flight simmers went down from 1.4% to 0.4%, and the number offull-time employees went up from 46.5% to 50.5%.What is your employment status?Prefer not to say3.4%I am unemployed3.4%I am semi-retired4.0%I am in school and employed part time3.3%I am in school9.0%I am furloughed0.4%I am fully retired16.4%I am employed part time3.2%I am employed full time50.5%I am a full time student6.3%0%10%20%30%40%50%60%Last year’s result:What is your employment status?Prefer not to say3.4%I am unemployed4.3%I am semi-retired4.2%I am in school and employed part time3.2%I am in school10.4%I am furloughed1.4%I am fully retired16.0%I am employed part time3.4%I am employed full time46.5%I am a full time student7.3%0%10%20%1630%40%50%60%
3.2.4. CountryThe top five countries are the same this year as the two previous years. France, the Netherlands, Italyand Spain and Switzerland follow next, just like previous years, but in varying order.Where do you live?United States [US]27.5%United Kingdom [GB]12.4%Germany [DE]11.1%Canada [CA]5.1%Australia [AU]4.2%France [FR]4.0%Netherlands [NL]3.3%Italy [IT]2.1%Spain [ES]1.8%Switzerland [CH]1.7%Russian Federation [RU]1.5%Brazil [BR]1.4%Belgium [BE]1.4%Austria [AT]1.3%Norway [NO]1.3%0%5%10%15%20%1725%30%
Last year’s result:Where do you live?United States [US]26.7%United Kingdom [GB]13.9%Germany [DE]10.4%Canada [CA]5.0%Australia [AU]4.3%France [FR]3.9%Netherlands [NL]3.3%Spain [ES]2.2%Italy [IT]2.1%Switzerland [CH]1.8%Sweden [SE]1.5%Belgium [BE]1.4%Norway [NO]1.4%Austria [AT]1.3%Brazil [BR]1.2%0%5%10%15%20%1825%30%
3.2.5. EducationSecondary School and Bachelor’s were the most common levels of education this year. This is thesame result as the last two years. In 2018, however, Bachelor’s was the most common one, followedby Secondary School.What is the highest level of education you havecompleted?None1%Primary School4%Secondary School / High School26%Technical or Vocational degree14%Associates 5%20%25%30%Last year’s result:What is the highest level of education you havecompleted?None1%Primary School5%Secondary School / High School28%Technical or Vocational degree14%Associates 5%1920%25%30%
3.2.6. IncomeRespondents were asked to enter their annual income before tax in their local currency. Exchangerates as per December 2021 were then used to calculate the income in US Dollars.The distribution is very similar to last year’s survey result. Most respondents are in the intervalbetween 40,000 and 70,000. We also notice a peak in the 10,000 bracket, which is consistentwith recent survey results.What is your yearly income level before tax?12%10%9%10%8%6%6%4%9%9% 8%8%7%5% 5%4%4% 4%3%2%2% 3% 2%1% 1% 1% 000200001000000%Income (USD)Last year’s result:What is your yearly income level before tax?12%9%10%9%10%10%9%7%7%8%6%6%5%4%5%4% 3%4%2% 2% 2%2%1% 1% 1%1% 1%Income 00030000200001000000%
3.3. Relation to Aviation3.3.1. WorkBy asking this question we wanted to establish how many of the respondents work within theaviation industry. Almost one in five work within aviation. This is comparable to the previous year’sresults.Do you work within aviation?Yes, other5.4%Yes, as ground crew1.2%Yes, as dispatch0.5%Yes, as cabin crew0.4%Yes, as an instructor0.9%Yes, as an engineer/mechanic2.3%Yes, as an airplane pilot4.4%Yes, as an air traffic controller1.0%Yes, as a software developer0.7%Yes, as a helicopter ast year’s result:Do you work within aviation?Yes, other6.0%Yes, as ground crew1.3%Yes, as dispatch0.6%Yes, as cabin crew0.5%Yes, as an instructor0.8%Yes, as an engineer/mechanic2.4%Yes, as an airplane pilot4.7%Yes, as an air traffic controller0.9%Yes, as a software developer0.7%Yes, as a helicopter %
3.3.2. Pilot LicenseOne in four flight simulator pilots holds a pilot license. A total of 9% have a Private Pilot License (PPL).A comparable result was presented when we asked this question in the last year’s survey.What pilot license do you currently have?Student Pilot LicensePrivate Pilot License with Instrument Rating (PPL-IR)5.0%2.0%Private Pilot License with Enroute Instrument Rating 0.2%Private Pilot License Helicopter (PPL-H)0.1%Private Pilot License (PPL)Other (please specify)8.7%2.6%NoneCommercial Pilot License with Instrumental Rating 74.9%2.8%Commercial Pilot License Helicopter (CPL-H)0.2%Commercial Pilot License (CPL)0.6%Airline Transport Pilot License (ATPL)2.7%0.0% 10.0% 20.0% 30.0% 40.0% 50.0% 60.0% 70.0% 80.0%22
Last year’s result:What pilot license do you currently have?Student Pilot License5.0%Private Pilot License with Instrument Rating (PPL-IR)2.1%Private Pilot License with Enroute Instrument Rating(PPL-EIR)0.3%Private Pilot License Helicopter (PPL-H)0.1%Private Pilot License (PPL)9.0%Other (please specify)2.8%None74.2%Commercial Pilot License with Instrumental Rating (CPLIR)2.8%Commer
We cover flight simulator preference, flight simulation habits, flight training, various demographics, virtual reality, graphics . design and compile the survey and make the results freely available for the common . the survey was conducted in a fashion compliant with