Transcription
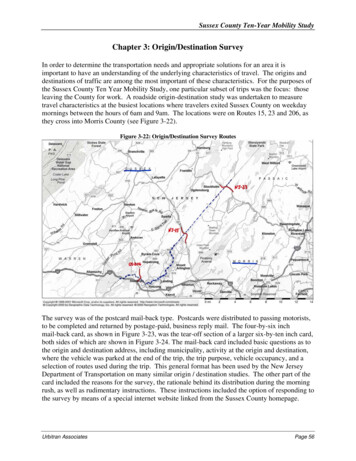
Sussex County Ten-Year Mobility StudyChapter 3: Origin/Destination SurveyIn order to determine the transportation needs and appropriate solutions for an area it isimportant to have an understanding of the underlying characteristics of travel. The origins anddestinations of traffic are among the most important of these characteristics. For the purposes ofthe Sussex County Ten Year Mobility Study, one particular subset of trips was the focus: thoseleaving the County for work. A roadside origin-destination study was undertaken to measuretravel characteristics at the busiest locations where travelers exited Sussex County on weekdaymornings between the hours of 6am and 9am. The locations were on Routes 15, 23 and 206, asthey cross into Morris County (see Figure 3-22).Figure 3-22: Origin/Destination Survey RoutesThe survey was of the postcard mail-back type. Postcards were distributed to passing motorists,to be completed and returned by postage-paid, business reply mail. The four-by-six inchmail-back card, as shown in Figure 3-23, was the tear-off section of a larger six-by-ten inch card,both sides of which are shown in Figure 3-24. The mail-back card included basic questions as tothe origin and destination address, including municipality, activity at the origin and destination,where the vehicle was parked at the end of the trip, the trip purpose, vehicle occupancy, and aselection of routes used during the trip. This general format has been used by the New JerseyDepartment of Transportation on many similar origin / destination studies. The other part of thecard included the reasons for the survey, the rationale behind its distribution during the morningrush, as well as rudimentary instructions. These instructions included the option of responding tothe survey by means of a special internet website linked from the Sussex County homepage.Urbitran AssociatesPage 56
Sussex County Ten-Year Mobility StudyFigure 3-23: Origin/Destination Survey Mail-back CardFigure 3-24: Origin/Destination Survey CardUrbitran AssociatesPage 57
Sussex County Ten-Year Mobility StudyBecause of the speed and volume of traffic at the County line, the actual survey sites werelocated at intersections and ramps. These were chosen on the basis of visibility, as well asmaximizing the number of surveyed vehicles destined for the County line. The survey locations,grouped by primary route, and illustrated in Figures 3-25 – 3-27, were as follows:US Route 206 (all at the Acorn Street signal in Byram Township / Stanhope): Route 206 southbound approach; Right turns from Acorn Street eastbound approach; and Left turns from the northbound Route 206 jughandle (westbound approach).Figure 3-25: Origin/Destination Survey Route 206 Survey LocationsNJ Route 15 (all in Sparta Township) Route 15 southbound approach at the NJ Route 181 signal (northern freeway terminus); Ramp from County Route 517 / Sparta Bypass to Route 15 southbound; and Ramp from Blue Heron Road eastbound (just east of Route 181) to Route 15 southbound.NJ Route 23 (both in Hardyston Township) Route 23 southbound approach at the County Route 515 signal; and Route 515 southbound, 0.5 mile north of Route 23 (typical back of queue).Urbitran AssociatesPage 58
Sussex County Ten-Year Mobility StudyFigure 3-26: Origin/Destination Survey Route 15 Survey LocationsFigure 3-27: Origin/Destination Survey Route 23 Survey LocationsUrbitran AssociatesPage 59
Sussex County Ten-Year Mobility StudyThe survey was conducted on weekdays between October 29 and December 19, 2002, during thehours of 6:00 to 9:00 am. These hours were selected to encompass the peak periods of travelwhen traffic volumes are highest in the study area. They also took into account the overallexpanded peak period attributable to attempts to avoid downstream congestion, as well as thelonger trip lengths expected for residents of Sussex County and Pike County, Pennsylvania.A summary of survey statistics, broken down by route and location, is presented in Table 3-16.Table 3-16: Origin/Destination Survey StatisticsAs shown, a total of 12,346 cards were distributed to passing motorists, with 5,186 responsesbeing received; an impressive 32%. Of these responses, almost 18 percent were submitted via thesurvey website – about 2 out of every 11. In order to avoid the safety problems of inadequatelight, as well as to allow queuing caused by the set-up process to dissipate, some of the earlier15-minute periods were not surveyed at some locations. Even so, about 32 percent of the totaltraffic passing through the survey locations between 6 and 9 am – the surveyed “population” –provided usable responses. At individual locations, the sample ranged from 26 to 37 percent –these numbers represent an outstanding rate of return.Return rates as low as 10% are often expected and accepted for roadside surveys and this samplesubstantially exceeds that rate. A sample rate this high can be attributed, at least partially, tomotorists perceiving a significant problem and believing that participation might help to bringabout solutions. This is further borne out by the website responses. In addition to the requireddata, participants who responded to the survey using the website had the option of submittingcomments along with their response. As a result, 722 out of 5,235 total responses - about 14 % - includedcomments regarding the survey itself, traffic conditions, and/or possible solutions. This equates to about 4.5percent of the surveyed population – a sizeable sample for an optional, open-ended question. Thesecomments were submitted separately from this report.Survey postcards that were returned were encoded and entered into a database. While addressinformation was entered, and retained for potential future use, analysis of origins anddestinations was conducted at the municipality level.Urbitran AssociatesPage 60
Sussex County Ten-Year Mobility StudyIn order to account for the fact that 100 percent of the surveyed population did not respond to thesurvey, expansion factors were developed. These factors essentially indicate how manymembers of the population are represented by each response, based on the sample size and trafficvolume. They were computed for each survey station and 1/2-hour time period and then addedto each response record. One instance, the absence of 30 minutes of data, required the use of anexpansion factor covering an entire hour. Following thorough quality assurance checks,including removal of duplicate web-site responses and making data entries for equivalentanswers uniform, tabulations of the data were prepared.Table and charts, based on these tabulations, are presented in the remainder of this section. In allcases, the data represent the total 6 am to 9 am volume passing through the survey locations.Note that the total number of trips / responses may vary slightly from table to table. This isbecause respondents did not necessarily answer all questions, and therefore the number of usableresponses varied from question to question.Before getting into the origins and destinations of the survey respondents, first we will look athow and why they are making their trips.Travel ModeRespondents were asked how they were making their trip on the day of the survey. Respondentswere asked where they parked their car to determine if a multi-mode trip was taken and wereasked which routes they used to get to their destination. The following items must be noted: “Drive Only” mode trips include carpools that formed before reaching the surveylocation, and thus are not equivalent to “drive alone”.Given that about 10 percent of vehicles had two or more occupants, it is possible thatsome percentage of multi-mode trips were “Carpool / rather than “Drive / It was not possible to determine if “Drive / Carpool” mode trips utilized the vehicle thatwas surveyed upon reaching the park and ride (or equivalent) lot, or the occupant(s)became passengers of another vehicle.Top Park and Ride Lots includes top-ten or 11, depending on ties.From the travel mode questions, the following general observations were made: At just under 3 percent, Route15 had the largest share of multi-mode trips, and Route 206with just over 2 percent had the smallest share of multi-mode trips.With almost 17 percent, the Newfoundland Park and Ride on Route 23 had the largestshare of multi-mode trips; Dover had the highest share by rail station at about 11.5percent.While unidentified carpool park and ride lots had just under a 5 percent share of multimode trips, the identified carpool lot at Blue Heron Road off the Route 15 freeway inSparta had the highest share with about 3.5 percent.Urbitran AssociatesPage 61
Sussex County Ten-Year Mobility StudyTables 3-17 and 3-18 and Figures 3-29 describe the travel modes used by survey respondents.The charts show the travel mode information for the total of all surveyed routes (routes 15, 23,and 206).Table 3-17: Origin/Destination Survey Distribution of Travel ModesDistribution of Travel ModesTravel ModeDrive Only*Drive / CarpoolDrive / BusDrive / TrainDrive / FerryMulti-Mode TotalTOTAL** Usable responses onlyUS-206Trips%NJ-15Trips%NJ-23Trips%All 68100.0%16,248100.0%Figure 3-28: Origin/Destination Survey Travel Mode for All Surveyed RoutesAll RoutesDrive / Bus1.2%Drive / Train0.9%Drive / Ferry0.1%Drive / Carpool0.4%Drive Only97.4%Urbitran AssociatesPage 62
Sussex County Ten-Year Mobility StudyTable 3-18: Distribution of Top Park & Ride Lots for Multimode Trips for All Surveyed RoutesAll rainTrainPark & Ride / Rockaway MallDoverNetcong*unspecified*North BergenWillowbrook Mall*unspecified*Blue Heron Rd*unspecified*Mount OliveTotalTotal of All Multi-Mode Trips415Figure 29: Percent of Top Park & Ride Lots for Multimode Trips for All Surveyed RoutesBusBus T rain T rain Carpool BusBusMount Olive*unspecified*Blue HeronRd*unspecified*WillowbrookMallNorth 4%12%10%8%6%4%2%0%NewfoundlandPercent of All TripsAll Rout esBus CarpoolT rain T rainP ark & Ride LotVehicle OccupancyRespondents were asked how many occupants were in their vehicle including themselves. Pleasenote that if the occupancy was listed as 12 or higher then the response was considered to be a busand was excluded from the occupancy tabulations.The following general observations were made about occupancy: Single occupant vehicles represent 90.6 percent of all trips, with up to 1 percent variationfor individual routes.Urbitran AssociatesPage 63
Sussex County Ten-Year Mobility Study Vehicles with two occupants comprise 7.5 percent of all trips, while those with three ormore occupants comprise just under 2 percent.The average auto/van occupancy for the surveyed routes was calculated at 1.14 – typicalfor a suburban area during a weekday, morning peak period.Table 3-19 and Figure 3-30 describe vehicle occupancy in detail.Table 3-19: Origin/Destination Survey Distribution of Vehicle OccupancyDistribution of Vehicle 80Total *3,807100.0% 7,262Occupancy*Avg. 0.0%All RoutesTrips%90.6% 14,714 90.6%7.8% 1,223 00.1%0.0%30.0%0.3%340.2%0.0%60.0%100.0% 5,171 100.0% 16,240 100.0%1.131.151.14* Usable responses onlyUrbitran AssociatesPage 64
Sussex County Ten-Year Mobility StudyFigure 3-30: Origin/Destination Survey Vehicle Occupancy for all Surveyed RoutesAll Routes27.5%43 0.4%1.0%5 0.4%190.6%Trip PurposeRespondents were asked their trip purpose on the day of the survey and were given severalchoices of which they could check one. Figure 3-31 and Table 3-20 present the trip purposeinformation in detail. Figure 3-31 shows the trip purpose for the total of all surveyed routes.The following Trip purpose were made: As expected with morning peak period traffic, an overwhelming majority of trips aredestined for the workplace – just over 91 percent; with 3 percent variation for individualroutes.The next highest trip purposes were business and school, with 1.5 to 2 percent each.If “no responses” were apportioned among the specific trip purposes; work trips wouldincrease to about 93.5 percent.Urbitran AssociatesPage 65
Sussex County Ten-Year Mobility StudyTable 3-20: Origin/Destination Survey Distribution of Trip PurposesDistribution of Trip PurposesUS-206PurposeWorkNJ-15NJ-23All 0.7%Personal 8%1240.8%No 66100.0%5,170100.0%16,250100.0%TOTAL ** Usable responses onlyFigure 3-31: Origin/Destination Survey Trip Purpose for All Surveyed RoutesAll RoutesSchool1.6%P ersonal1.0%Social0.4%Business1.8%Ot her0.8%No Response2.5%Shopping0.7%W ork91.2%Origin of TripsWhen asked the origin of their trip, respondents had the option of designating the nearestintersection, the actual address, the municipality, the state, and the zip code. The followinggeneral observations were made from the survey results:Urbitran AssociatesPage 66
Sussex County Ten-Year Mobility Study Approximately 95 percent of all trips originate in Sussex County, with about 3 percentdifference between the individual routes.Approximately 4 percent of all trips originate in Pennsylvania; this figure reaches 7perce
the survey by means of a special internet website linked from the Sussex County homepage. Sussex County Ten-Year Mobility Study Urbitran Associates Page 57 Figure 3-23: Origin/Destination Survey Mail-back Card Figure 3-24: Origin/Destination Survey Card . Sussex County Ten-Year Mobility Study Urbitran Associates Page 58 Because of the speed and volume of traffic at the County line, the actual .
