Transcription
THE SYNTHESIS PROJECTNEW INSIGHTS FROM RESEARCH RESULTSRESEARCH SYNTHESIS REPORT NO. 17JULY 2009Derek DeLia, Ph.D., AssociateResearch Professor;Joel Cantor, Sc.D., Professor andDirector; Center for State Health Policy,Rutgers UniversityEmergencydepartment utilizationand capacitySee companion Policy Brief available at www.policysynthesis.org
TABLE OF CONTENTS1Introduction2Methodology3Findings14 Conclusion15 Implications for Policy-Makers17 The Need for Additional InformationAPPENDICES18 Appendix I References26 Appendix II Healthcare Effectiveness Data and Information Set (HEDIS)THE SYNTHESIS PROJECT (Synthesis) is an initiative of the Robert Wood Johnson Foundation toproduce relevant, concise, and thought-provoking briefs and reports on today’s important healthpolicy issues. By synthesizing what is known, while weighing the strength of findings and exposinggaps in knowledge, Synthesis products give decision-makers reliable information and new insights toinform complex policy decisions. For more information about the Synthesis Project, visit the SynthesisProject’s Web site at www.policysynthesis.org. For additional copies of Synthesis products, please goto the Project’s Web site or send an e-mail request to pubsrequest@rwjf.org.SYNTHESIS DEVELOPMENT PROCESS426POLICYIMPLICATIONS13Scan FindingsAudience Suggests TopicWeigh EvidenceSynthesize Results5Distill for Policy-MakersExpert Reviewby Project Advisors
IntroductionFindingsThe hospital emergency department (ED) plays a unique and important role in the Americanhealth sector and broader society. EDs are designed to treat the most critically ill and injuredpatients and they are part of the first response to public health emergencies such as naturaldisasters and terrorist attacks. In addition, EDs also serve as a bellwether of performance in otherparts of the health care system. For example, limited access to primary care often reveals itself innon-urgent or preventable care provided in the ED (125, 14, 135).1 The availability and utilizationof ED care can reveal limitations in other areas such as inpatient and psychiatric capacity. The EDhas also been described as the “safety net for the safety net” as it is the one place where patientsknow they can be seen regardless of financial resources or time of day (146).Several converging events have led the Institute of Medicine (IOM) to describe emergency care inAmerica as reaching a “breaking point” (79). From 1996–2006, annual ED visits grew from 90.3million to 119.2 million nationally (131). On a per capita basis, ED utilization grew from 34.2 to40.5 visits per 100 residents during the same period (131). Despite the increase in ED utilization,the number of hospitals operating EDs in the United States declined from more than 5,000 in1991 to fewer than 4,000 in 2006 (131, 5).2 As a result, a growing number of visits are concentratedin a smaller number of EDs, which are taking on a heavier patient load. In their safety net role,EDs face a steady demand for uncompensated care, which raises concern about the financialviability of their operations, especially in light of past ED closures.ED overcrowding, a situation where the demand for care exceeds the ability of the ED to provideit in a timely way, has become increasingly common (79). The prevalence of ED overcrowdingduring ordinary times raises additional concern about the ability of emergency medical providersto respond to an unexpected surge of patients during a public health emergency.This synthesis describes what is known, and importantly what is not known, about hospital EDs inthe United States. This synthesis addresses key questions about the performance and sustainabilityof hospital EDs and what patterns of ED utilization reveal about the functioning of the U.S.health sector overall. The following questions are addressed:1.What characteristics of patients and local health care systems are associated withED utilization?2.How frequently do patients use the ED for non-urgent or preventable conditions andwhat are the factors that influence this utilization?3.How does patient cost-sharing affect ED utilization and health outcomes?4.How do current ED utilization patterns affect hospital finances?5.What are the causes and consequences of ED overcrowding?6.What are the cost implications of ED utilization?1 Preventable care refers to care in the ED that is urgent but could have been avoided with access to primary care at an earlier stageof illness or injury.2 Since some states require general care hospitals to maintain an ED, ED closures (particularly those that are not the result of hospital closure) are likely concentrated in states without this requirement.Emergency department utilization and capacity THE ROBERT WOOD JOHNSON FOUNDATION RESEARCH SYNTHESIS REPORT NO. 17 1
FindingsMethodologyThe synthesis draws on previously published studies about ED utilization and capacity. Itfocuses primarily on the day-to-day functioning of the ED, with little analysis of public healthsurge capacity, which can be viewed as a separate research field altogether. Emphasis is placedon recent peer-reviewed studies in the United States that are based on national or multistatedata. However, much of the current research in this area is based on single-hospital or singlestate studies and reports produced by medical societies, government agencies, and other healthresearch and policy centers. Also, certain topics such as consequences of ED overcrowdinghave been analyzed in an international context, making an exclusively American focus lessinformative. These additional studies are included whenever peer-reviewed U.S. studies arevery limited or not available for a specific topic. The synthesis also highlights importantareas of research that remain underdeveloped or inconclusive. A more detailed discussion ofmethodological issues appears in Appendix II.2 RESEARCH SYNTHESIS REPORT NO. 17 THE ROBERT WOOD JOHNSON FOUNDATION Emergency department utilization and capacity
FindingsWhat characteristics of patients and local health care systems areassociated with ED utilization?ED utilization rates are especially high among infants, people age 75 and over,nursing home residents, the homeless, African Americans, and individualscovered by Medicaid/SCHIP. Table 1 compares rates of total ED use (with and withouthospital admission) among the most frequent users to the national average in 2006. As describedbelow, heavy ED users typically have significant health needs and/or face barriers to receivingother kinds of care. The extremely high rate among nursing home residents, in particular, isdriven by multiple factors including high rates of chronic illness, limited medical capabilities innursing homes, reimbursement incentives, and poor communication between patients’ familiesand medical providers (60). Nevertheless, many of these high-use groups account for a smallpercentage of total ED visits (Table 1).Table 1: Annual ED visits by high-use population groups, 2006Population groupED visits per 100 individualsGroup’s share of allU.S. ED visitsU.S. average41—Age 1 year853%Age 75 609%Nursing home residents1402%Homeless population84 1%African American/Black8025%Medicaid/SCHIP enrollees8226%Source: Pitts et al., 2008 (131)Notes: High-use populations are those with at least 60 visits per 100 individuals. Visit rates include individuals with multiple visitsas well as those with no visits. Groups shares should not be summed because individuals may be part of multiple groups.ED patients who are not admitted to the hospital and individuals with multiple EDvisits account for large shares of total ED volume. Only 15 percent of ED visits resultedin admission or transfer to another hospital in 2006 (131). Data for adults from 2000–2001 showthat only 23 percent made any visit to the ED (156). This percentage may be somewhat highertoday, because ED utilization rates have risen since then.Non-citizen residents of the United States use the ED at a rate that is much lowerthan the national average. Hispanic residents (regardless of citizenship) haveED utilization rates similar to the non-Hispanic white population, while AfricanAmericans have higher rates. Survey data pertaining to ED visits without admissionshow that non-citizen residents have a substantially lower ED utilization rate (17.2 less per100 population) than U.S. citizens after adjusting for demographic, health, and health systemcharacteristics (29). Similarly, communities with lower-than-average ED utilization rates have ahigher percentage of residents who are not U.S. citizens (29). At least two studies have shownthat there is no difference in the ED visit rate between Hispanic and non-Hispanic populations(132, 29). However, African American residents use the ED more frequently (by 9.9 visits per 100population) than white residents even after adjusting for other factors (29). Utilization rates forother racial and ethnic groups have been more difficult to estimate due to small sample sizes.Emergency department utilization and capacity THE ROBERT WOOD JOHNSON FOUNDATION RESEARCH SYNTHESIS REPORT NO. 17 3
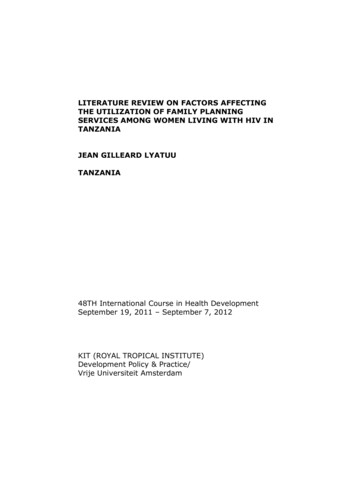
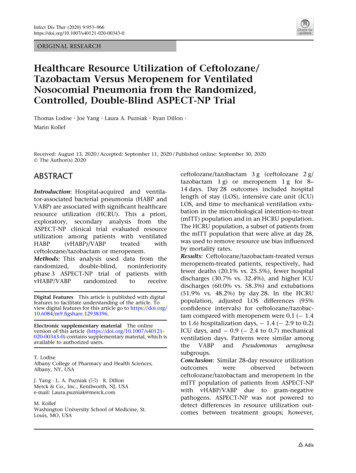
FindingsWithout controlling for other factors, the rate of ED use is higher for uninsuredpatients relative to the privately insured but lower than the rate for patientscovered by Medicare, Medicaid and SCHIP. After adjustment for health, incomeand other factors, however, ED use by the uninsured is no different from theprivately insured. Compared with the privately insured, ED utilization rates are almost fourtimes as high among Medicaid/SCHIP patients and more than twice as high for patients withMedicare or no insurance (131). After adjustment for self-reported health status, demographics,and the capacity of local EDs and primary care providers, uninsured patients used the ED at thesame rate as the privately insured, while patients with Medicaid/SCHIP or Medicare coveragecontinued to exhibit much higher utilization rates (29).The recent growth in volume of ED utilization is driven by individuals with privateinsurance, higher income, and private physicians as their usual source of care.Due to their large number in the general population, privately insured individuals account forthe largest share of total ED visits (Figure 1). The payer mix of adult ED visits remained stablefrom 1996–1997 to 2003–2004 (155). As a result, most of the growth in total ED visits overallhas been driven by greater use among the privately insured. Rising ED use among the privatelyinsured coincides with rising use of all ambulatory care (31).Figure 1: Expected payer distribution of total ED visits, 2006Medicare17%Private insurance40%Uninsured17%26%Medicaid/SCHIPSource: Pitts et al., 2008 (131)Note: Uninsured includes patients classified as self-pay, no charge, charity, or where no other payment source was reported.A study by Weber from 1996–1997 to 2003–2004, there were changes in the composition of adultED visits by income and usual source of care (155). The share of visits attributable to patientswith income above 400 percent of the poverty level increased steadily from 21.9 percent to 29.0percent during the study period, while shares for other income groups fell or fluctuated with nopattern. Moreover, most ED visits throughout this period were made by individuals reporting aprivate physician as their usual source of care. This percentage also rose steadily from 52.4 percentto 59.0 percent.4 RESEARCH SYNTHESIS REPORT NO. 17 THE ROBERT WOOD JOHNSON FOUNDATION Emergency department utilization and capacity
FindingsThe Weber study may understate somewhat the share of ED volume attributed to Medicaid andSCHIP, because children are excluded from the analysis. Since the analysis is based on a populationbased survey, it may underrepresent undocumented and homeless patients, leaving some uninsuredpatients out of the analysis as well. Nevertheless, both survey and administrative data indicate thatthe majority of ED visits overall are made by individuals with some form of insurance.Low income and poor health are strong predictors of ED utilization even afteradjusting for other variables. The poorer health of Medicaid enrollees accounts fora large share of the difference in ED use between Medicaid and uninsured patients.After adjustment for demographics, coverage and various health system characteristics, individualswith poor health or income below the poverty level have much higher ED use rates than otherindividuals (29). Income differences above the poverty level are less important in predicting EDuse rates. Mortensen and Song used regression decomposition techniques to explain the greaterprobability of any ED use by adults in Medicaid (27%) relative to uninsured adults (10%) (116).Most of this difference is attributed to lower income and poorer health measured by self-reportedhealth status, presence of chronic illness, and difficulty with activities of daily living, all of whichwere less favorable in the Medicaid population.Frequent ED users have substantial physical and mental health problems andtypically low income. Studies using survey and administrative data have examined thecharacteristics of frequent ED users, defined as patients with multiple ED visits in a single year(76, 168, 85). A predominant characteristic among these patients is poor physical and mentalhealth. Frequent users appear to use the ED as a supplement rather than a substitute for otherforms of care. Indeed, patients with frequent ED use have higher-than-average utilization ofother health services and typically have a usual source of care outside the ED (76, 168). Lack ofinsurance is not a factor common to frequent ED users. Instead the most frequent users mostoften have coverage through Medicare or Medicaid. In addition, frequent users are more likely tobe poor or near poor even after adjusting for health and insurance status. Patients who visit theED at least 3–5 times annually account for a disproportionate share of total ED visits. Althoughthey represent less than 8 percent of all ED users (and a much smaller share of the generalpopulation), they account for 18 percent to 28 percent of total ED volume (76, 168, 85).Patients with “extreme” levels of ED use have a variety of complex physical andmental health problems, but account for a small percentage of total ED volume. Amuch smaller subset of patients may be classified as “extreme” users of the ED with 10 or morevisits annually (132, 18, 89, 102). These patients are of special concern due to the breadth andcomplexity of their physical and mental health problems. Nevertheless, extreme ED users accountfor a very small percentage (1 percent to 5 percent) of total ED volume.The supply and capacity of providers to meet the demand for ambulatory care alsoinfluences the rate of ED use within communities. Although studies on the characteristicsof ED users are much more common, two studies have demonstrated the importance of healthsystem factors in determining the rate of ED use. Both show higher rates of ED utilization in areaswith a limited supply of primary care providers and a greater supply of ED capacity (29, 97).Emergency department utilization and capacity THE ROBERT WOOD JOHNSON FOUNDATION RESEARCH SYNTHESIS REPORT NO. 17 5
FindingsHow frequently do patients use the ED for non-urgent or preventableconditions and what are the factors that influence this utilization?Although use of the ED for non-urgent and preventable conditions appears to bevery common and growing, identification of these conditions remains imprecise.Several studies have examined the urgency of ED visits based on triage categories recorded inhospital records. For example, Pitt et al. found that 12 percent of all ED visits in 2006 wereclassified as non-urgent (patient should be seen in 2–24 hours) versus 5 percent that wereclassified as requiring attention immediately (131). That same year, 13 percent of ED visits wereclassified as having unknown or no triage. Similar results are found in other reports of ED visitsby the National Center for Health Statistics (NCHS). Using data from the NCHS, Cunninghamand May attribute all of the increase in total ED visits between 1997–1998 and 1999–2000 tovisits classified as semi-urgent (care required within 1–2 hours), non-urgent, or no/unknowntriage (31).An alternative assessment of the urgency and the preventable nature of ED visits is offered by theED Use Profiling Algorithm developed at New York University (15). The algorithm allows EDvisits to be classified as “ambulatory care sensitive,” defined as visits for conditions that could betreated elsewhere or conditions that are emergent but preventable with earlier access to primarycare.3 Using a national sample, Weinick et al. (158) found that 56 percent of ED visits (not leadingto admission) were classified as ambulatory care sensitive from 1997–2000. Details from the studyare limited, since it has been published in the form of an abstract only. Other studies at the statelevel, however, have found similar results (37, 86).Use of the ED for ambulatory care sensitive conditions is associated with limitedaccess, financial or otherwise, to primary care providers. Children age 5 andunder are very likely to use the ED for these conditions. Ambulatory care sensitiveutilization is most common among Medicaid patients, uninsured/self-pay patients, children age5 and under, and patients visiting public hospitals (158, 37, 86). But in terms of total volume,patients with Medicare or private insurance account for the majority of ambulatory care sensitiveED utilization.A study of patients at five EDs in the northeastern United States found that those with a regulardoctor were significantly less likely to have a non-urgent ED visit (127). However, analysis ofdata from a safety net clinic in St. Louis suggested that simply having access to clinic care (withno mention of a regular doctor) does not reduce non-urgent ED use (27). Moreover, parentsof children age 5 and under often seek care in the ED for non-urgent conditions when theirpediatrician cannot be reached quickly (28).3 More detail about the algorithm and its limitations is found in Appendix II.6 RESEARCH SYNTHESIS REPORT NO. 17 THE ROBERT WOOD JOHNSON FOUNDATION Emergency department utilization and capacity
FindingsSome patients indicate a preference for ED care due to convenience, the accessit provides to specialty care, or perceptions that higher-quality care is availablein a hospital setting. Analysis of patient focus groups across the United States suggests anumber of reasons why patients may prefer to receive primary care from an ED instead of adoctor’s office or health center (135). In many neighborhoods, the hospital ED is perceived asa provider of advanced, high-quality medical care and is known for its requirement to serve allpatients regardless of ability to pay. Some patients find the ED convenient, since appointmentsare not required and it is always open. Others view the ED as the only access point for specialtyand behavioral health services, which are often unavailable or prohibitively expensive in othersettings. Similar results were obtained in the “24 Hours in the ED Study,” in which patients at56 EDs nationwide were interviewed about their reasons for coming to the ED on a single dayin 1994 (166).Patient perceptions of the urgency of ED visits often differ from the judgmentsof clinicians and researchers. Moreover, these perceptions are often complexand uncertain, creating a demand for rapid confirmation and reassurance. Astudy of patients in the waiting area of an urban teaching hospital found that 82 percent ofpatients classified by triage nurses as non-urgent believed to the contrary that their conditionwas urgent (56). A limitation of the study is that patients may have exaggerated their conditionto receive quicker attention (despite efforts by the researchers to limit this). In the “24 Hoursin the ED Study,” the chief complaints of patients classified by triage nurses as non-urgent didnot differ from the complaints of patients classified as urgent (166). Moreover, 5.5 percent ofpatients triaged as non-urgent were later admitted as inpatients, suggesting that even cliniciansmight underestimate the medical needs of ED patients upon first presentation.Patients often come to the ED for a variety of complex and overlapping concerns that areultimately judged by clinicians as non-urgent (63). Concerns include the need to quicklyrelieve pain or discomfort and “making sure everything is OK.” Caretakers of young childrenexpress additional concerns. Some feel they need professional reassurance to deal with theirchild’s inability to express pain and other symptoms precisely. Others want to make surethey are not to blame for the child’s problem. Some describe their choice to seek immediateverification of non-urgency as a form of parental responsibility.How does patient cost-sharing affect ED utilization and healthoutcomes?Greater cost-sharing is associated with reduced utilization of the ED, especiallyfor non-urgent/low-severity conditions. A recent study examined changes in EDand related utilization among individuals with private employer-sponsored coverage wherethe employer switched from an HMO plan to a high-deductible health plan (160).4 Theseindividuals used less ED care, especially repeat ED visits, than a control group after adjustingfor individual demographic and health characteristics. Many of these findings are consistentwith the RAND Health Insurance Experiment, which found that cost-sharing reduced ED useoverall and more rapidly for conditions defined as “less serious.” (122, 120).4 Deductibles of 500– 2000 for individuals and 1,000– 4,000 for families.Emergency department utilization and capacity THE ROBERT WOOD JOHNSON FOUNDATION RESEARCH SYNTHESIS REPORT NO. 17 7
FindingsNo studies have shown adverse health effects from ED cost-sharing. However, anumber of important caveats limit the generalizability of these studies. Most studiesof ED cost-sharing are limited to individual health plans and integrated delivery systems and relyon data that are at least 10 years old. The Kaiser-Permanente System in northern California is thesetting for several detailed studies. They found that ED cost-sharing reduced ED use primarilythrough reductions in low-acuity visits (145, 74, 134, 100). Related studies found no relationshipbetween ED cost-sharing and mortality, later hospitalization, or delay in seeking care for chestpain (74, 100). In the Kaiser System, patients who limited their use of the ED in response tocost-sharing typically obtained care from urgent care centers or other providers (134). Patientslacking access to these alternative providers may respond differently to cost-sharing.A related study found that even though Kaiser patients were well informed about prescription andoffice-visit co-payments, more than half underestimated their ED co-payments by 20 or more(75). Those who believed that they had a higher co-payment (rightly or wrongly) were more likelyto delay or avoid ED care.5Increases in ED co-payments are associated with larger reductions in EDutilization among patients from low-income neighborhoods, including caseswith high-severity diagnoses. Several studies reviewed above conducted separate analysesfor patients in low-income categories, measured in each case as living in a low-income censustract. These studies found a much stronger response to ED cost-sharing in terms of total EDvolume and the number of visits for high-severity conditions (74, 160, 145). The only studythat examined health effects of ED cost-sharing on patients from low-income areas found noassociation with patient mortality (74). These studies do not measure patient income directly anddo not include patients covered by Medicaid or SCHIP. Lack of precision in the way incomeis measured could create a downward bias in estimating the size of the relationship betweenincome and the effects of cost-sharing. Also, patients in public programs may have even lowerincome and greater disability than low-income populations in private plans.Cost-sharing for most services typically is limited in Medicaid and SCHIP. However, an analysisby the General Accounting Office (GAO)6 found that co-payments in the ED can vary from zeroto 50 per visit depending on the state, patient eligibility category, and whether the patient wasadmitted as an inpatient (55). Although studies have assessed the effects of cost-sharing in theseprograms for prescription drugs and other services, literature searches found no studies on theeffects of ED co-payments in these populations.Many studies have examined the impacts of cost-sharing in Medicare (136), but most do notexamine ED use directly. Two studies using data from the state of Washington found that EDco-payments or lack of Medigap insurance did not cause delays in seeking treatment formyocardial infarction (70, 100). A study of Medicare patients covered by Kaiser-Permanentefound that cost-sharing reduced ED utilization but did not lead to increased mortality oradmissions to the ICU (74).5 A caveat to this study is that it was based on a survey that excluded a number of potentially vulnerable groups, including patientswith Alzheimer’s, hearing difficulties, or inability to speak English.6 GAO is now known as the Government Accountability Office.8 RESEARCH SYNTHESIS REPORT NO. 17 THE ROBERT WOOD JOHNSON FOUNDATION Emergency department utilization and capacity
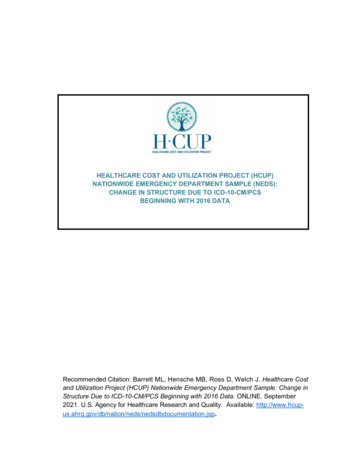
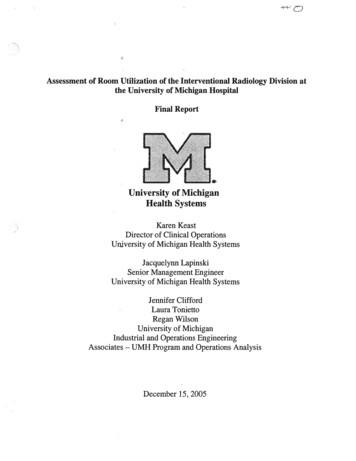
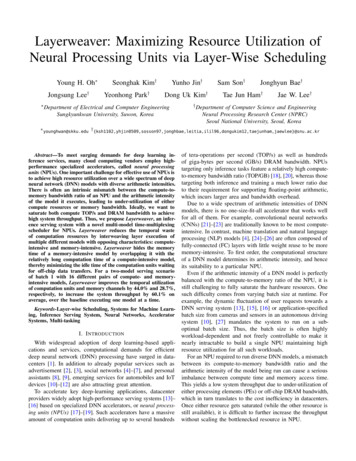
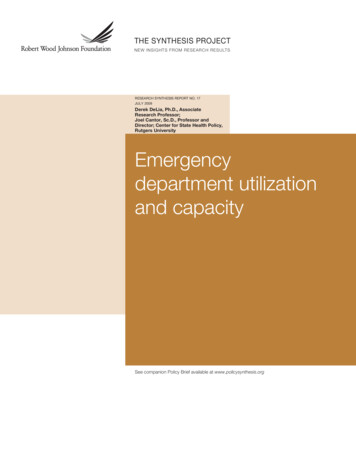
FindingsHow do current ED utilization patterns affect hospital finances?The ED is exposed to potentially large financial losses due to federal and statelaws requiring EDs to treat all patients regardless of ability to pay for services.However, no studies have evaluated directly the effects of these laws onhospitals’ financial conditions. The ED is the dominant source of hospital admissionsfor the uninsured. In 2003, 60 percent of all inpatient admissions by uninsured/self-paypatients originated in the ED compared with 32 percent for the privately insured, 39 percentfor Medicaid, and 44 percent overall (42). A study based on patient focus groups suggeststhat the ED is the primary, and sometimes only, path for the uninsured to receive specialtycare (135).ED use by the uninsured is widely believed to be influenced by the federal EmergencyMedical Treatment and Active Labor Act (EMTALA) of 1986, which requires hospitalsto provide screening and stabilization to all patients regardless of ability to pay (79).7Although EMTALA was originally enacted to prevent denial of emergency care to indigentpatients, many argue it has created a virtual “right” to any care provided in the ED (33, 47).Nevertheless, no rigorous studies have directly evaluated the impact of EMTALA on patients’care-seeking behavior or hospital finances and operations. Similarly, little is known about theimpact of state regulations that require EDs to provide more extensive forms of care thanthose required by EMTALA.Despite the unique regulatory mandate placed on EDs, most ED visits areprovided to insured patients and the ED is a growing source of revenue frominpatient admissions. The percentage of all inpatient admissions originating in the EDhas grown fairly steadily since the early 1990s (Figure 2). Although the uninsured are themost dependent on the ED as a gateway to inpatient admission, they account for only asmall share of total admissions through the ED (Figure 3). Some studies suggest that the EDis a positive contributor to hospital financial performance because it is a source of profitableinpatient admissions (112, 113). Moreover, a detailed study of a single trauma center foundthat ED admissions are usually more profitable than other admissions (69). These findings,however, are far from universal. Net revenue from ED admissions can vary widely bypayment source and clinical service category (69, 77). EDs serving large volumes of nonadmitted patients and those that are part of trauma centers are more likely to contributenegatively to hospital financial performance (113, 103). Ultimately, the impact of the ED onhospital finances appears to depend heavily on hospital location, service mix, payer mix andaccess to public subsidies.7 U. S. Statute 42-USC-1395-ddEmergency department utilization and capacity THE ROBERT WOOD JOHNSON FOUNDATION RESEARCH SYNTHESIS REPORT NO. 17 9
FindingsFigure 2: Trend in Share of Inpatient Admissions from the EDPercentage of inpatient admissions originating in the ED50 020012002200320042005Source: Authors’ tabulations from HCUPnet, based on data from the Healthcare Cost and Utilization ProjectFigure 3: Distribution of expected payer for inpatient admissions through the ED, 2003Uninsured6.2%Other2.9%Private ce: Owens and Elixhauser, 2006 (126)Note: Uninsured includes patients classified as self-pay, no charge, charity, or where no other payment source was reported.10 RESEARCH SYNTHESIS REPORT NO. 17 THE ROBERT WOOD JOHNSON FOUNDATION Emergency department utilization and capacity2006
FindingsVarious subsidy mechanisms exist to support uncompensated care provided by EDs and hospitals,in general, with large volumes of poor and uninsured patients. In 2008, public subsidies covered82 percent of the 35 billion of uncompensated care provided by hospitals (64). These subsidies,however, are often poorly targeted and applied inconsistently across states (111, 59). This createsa situation where some EDs with a limited uncompensated care burden have access to publicsubsidies that are not available to EDs with a greater burden (23).What are the causes and consequences of ED overcrowding?ED overcrowding is caused by a complex set of conditions that occur acrosshospital units and across the entire health care system. Inability to move
and medical providers (60). Nevertheless, many of these high-use groups account for a small percentage of total ED visits (Table 1). Table 1: Annual ED visits by high-use population groups, 2006 Population group ED visits per 100 individuals Group's share of all U.S. ED visits U.S. average 41 — Age 1 year 85 3% Age 75 60 9%