Transcription
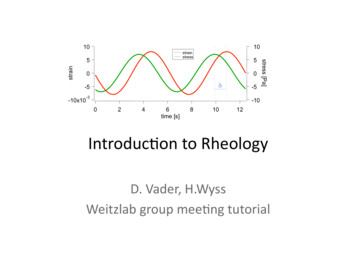
Understanding Rheology ofThermoplastic PolymersKeywords: polymers-thermoplastics, adhesives, DMA, melt, glass transition, viscosity, viscoelasticity, modulus,elasticity, normal forceGENERAL CONSIDERATIONSRheological testing of thermoplastic materials can beperformed on both solid samples and on melts. This isimportant because the choice of material form andphysical state is more than a matter of convenience: Productperformance issues usually are related to solid samplesproperties; process ability issues can be correlated withpolymer melt properties. In either case, since rheology isan indirect and non-unique measurement of structure, theapplication of rheology to solving processing and productperformance problems often reduces to comparativeanalysis of good and poor performing samples.Thermoplastic solids are tested using MechanicalSpectroscopy to study polymer morphology and structureand relate these to end-use performance. Accurate solidstate measurements of the material’s glass transitiontemperature (Tg), modulus (G’) and damping (tan δ) areused to predict practical use temperatures, impact properties,energy dissipation, stiffness and many other performanceproperties. (Dynamic mechanical testing is considered themost sensitive method for measuring the glass transition andsecondary transitions of polymers.)AAN013shear rate behavior. For example, gauge variation can becaused by variable post-extrusion die swell, and warpagecan occur from non-uniform relaxation during cooling of animproperly formulated injection molding compound. Also, bytesting at low enough shear rates so that the measurementsare in the melt’s linear viscoelastic region, the data can belinked directly to the polymer’s molecular structure suchas molecular weight and molecular weight distributionfactors which control polymer process ability and productperformance.Time dependence and Deborah numberThermoplastic polymers are viscoelastic materials and assuch exhibit a pronounced time or frequency dependence.For convenience, thermoplastic melts are characterizedwith a representative material relaxation time. In a similarway, individual steps in a manufacturing or transformationprocess can be described by a characteristic process time(see Figure 1).Moreover, rheological properties can be measuredcontinuously as the material undergoes temperatureinduced changes from amorphous to crystalline; solid tomolten and vice versa. Rheological tests on thermoplasticmelts measure material’s flow properties and provide vitalinformation about polymer processing.Viscosity and ElasticityMelts are non-Newtonian fluids and their viscosity decreaseswith increasing shear rate. Oscillation measurements over arange of frequencies can be used to gauge the rate of theviscosity changes with shear rate (Cox-Merz1).This is importantfrom the standpoint of processing ease, and for determiningprocessing energy needs. The dynamic measurement alsoprovides a simultaneous measure of melt elasticity, the maindeterminant of viscoelastic melt behavior, and the cause ofsuch phenomena as die swell.Low shearLow shear rate measurements in the melt’s linear viscoelasticregion are a key in material problem solving. Whilethermoplastic polymer processing operations such asextrusion and injection molding typically involve high shearrates, finished part quality is often controlled by the low1Cox, W.P.; Merz, E.H. J.Polym.Sci., 28, 118 (1958)Figure 1: Process and material timeThe ratio of both, the De (Deborah) number is an importantprocess parameter. Increasing the take up speed in a filmblowing process is identical to decreasing the process time: inorder for the Deborah number, characteristic for the process,to be constant, the material time has to be modified, typicallyby reducing the viscosity (decreasing the temperature or themolecular weight). Not adapting the characteristic materialstime would cause the material to behave more solid-like(high De number) under the new processing regime and1 AAN013
lead to reduce performance and eventual breaking of thefilm. A low De number stands for a predominately viscousbehavior, a high De number for an elastic material response. Mwa with a 3.08 0.39 in this exampleMolecular Weight DistributionShear and ElongationAlso most rheological tests are done in shear using rotationalor capillary rheometers, process flows are usually mixedflows with elongation deformations being important anddominant in processes like film blowing, blow molding, fiberspinning, etc. The elongation viscosity of elastic materials atlarge deformations can deviate significantly from the shearviscosity and therefore is an important parameter to predictprocessing performance or to design process equipment.Elongation properties at large deformations correlate withmolecular structure. The elongation viscosity as such is a verysensitive indicator of long chain branchingEFFECT OF MOLECULARMORPHOLOGYSTRUCTUREANDBeyond the Newtonian region, melt viscosity drops withincreasing shear rate, a phenomenon called shearthinning. This behavior is considered the most importantnon-Newtonian property in polymer processing because itspeeds up material flow and reduces heat generation andenergy consumption during processing.At constant molecular weight, the amount of energy requiredto process the polymer is directly related to the viscosity’sshear rate dependence. The onset and degree of shearthinning vary among materials and qualitatively correlatewith the molecular weight distribution: Polymers with a broaddistribution tend to thin more at lower shear rates than thosewith a narrow distribution at the same average Mw. (Figure 3).Molecular WeightMolecular weight is the main structural parameter ofpolymers’ flow behavior at temperatures above the glasstransition temperature (for an amorphous material) or themelting point (for a semi-crystalline polymer).Melt viscosity is a constant at low shear rates or frequencies.The viscosity in this region is known as the zero shear, orNewtonian, viscosity ho. For low molecular weight polymersin which chain entanglement is not a factor, the zero shearviscosity is proportional to the polymer’s molecular weight.However, above a critical molecular weight, chains beginto entangle and the zero shear viscosity depends muchstronger on molecular weight, proportional now to about the3.4 power of the molecular weight. This is shown in Figure 2.Rheological measurements are therefore ideal for studyingthe effects of molecular weight differences in resins as smalldifferences in molecular weight are manifested in largechanges in viscosity.Figure 3: Molecular weight distribution differences in polymer melts areeasily detected by measuring the complex viscosity η* as a functionof frequency.Some important consequences of this: molding andextrusion can for example be made easier by broadeninga polymer’s molecular weight distribution; finished productcharacteristics, such as sag and haze in blown LDPE films,or surface smoothness in a variety of thermoplastic moldedgoods can be altered by changing molecular weightdistribution.The slope of the modulus versus the frequency curve for a meltalso mirrors changes due to molecular weight distribution.Isothermal measurements of the modulus at frequenciesbelow one reciprocal second show marked increases inthe storage modulus as distribution is broadened. Suchchanges have been used to distinguish between good andpoor performing products and guide subsequent productimprovements through adjustments in molecular weightdistribution (Figure 4).Figure 2: The zero shear viscosity is a sensitive measure of polymermolecular weight. The relationship for flexible linear polymers is ηo2 AAN013
Figure 4: Molecular weight distribution differences in polymer meltsshow best in the terminal region of the storage modulus G’.A good indicator of MWD changes is the cross over modulus Gc.Figure 6: Elongation viscosity of LDPE (branched) and LLDPE (linear)show pronounced differences at high total strains. This strainhardening effect is a characteristic feature of long chain branchingFillersBranchingPolymer chain branches can vary in number, length anddistribution along the main chain. Increasing the number,the size, or the flexibility of the branches changes the meltviscosity. But if the branches are few and long enough toentangle, melt viscosity will be higher at low frequencythan that of a corresponding linear polymer of the samemolecular weight (Figure 5). The viscosity of long-branchedpolymers is more shear rate dependent than is the viscosityof linear polymers and long chain branching affects theelasticity of the polymer melts which shows in the normalstress difference and the storage modulus.Adding fillers to a neat polymer melt changes its rheology,influencing both the way the melt processes and theproperties of the ultimate product. Key factors are fillersize and shape, filler concentration, and the extent of anyinteractions among the particles.The consequences of adding fillers are an increase in meltviscosity and a decrease in die swell. Moreover do particleinteractions increase the non-Newtonian range and causeit to occur at a lower shear rate than for the unfilled polymermelt. Filled polymers have a higher viscosity at low shear rates,and yielding may occur with increased filler concentration(Figure 7). At higher shear rates the effect of the fillerdecreases and the matrix contributions dominate. Anothereffect of the filler is the reduction of the linear viscoelasticrange, characterized by the onset of the strain dependentbehavior.Figure 5: Effect of branching on the complex viscosity η* and thedynamic moduli G’, G””The extensional viscosity at high strains increases stronglywith long chain branches. Figure 6 compares the rheologicalresponses of a long chain branched LDPE and a linear LLDPEin elongation. The pronounced viscosity increase at largeelongation strains (strain hardening) is characteristic for longchain branching.Figure 7: The viscosity of a highly filled LDPE exhibits yielding at lowshear ratesBlendsPolymer blends are compositions of chemically differentpolymers. Polymer blends are homogeneous if thecomponents are compatible and mix at molecular level.3 AAN013
Blends are heterogeneous or incompatible if the componentsare present in separate phases. Usually the minor componentis dispersed in a matrix of the dominant component. Whethera blend is compatible or not, also depends on temperature;in this case the blend is considered partially miscible. Ifblends are incompatible, mechanical energy is needed todisperse the minor phase (mixing) and coalescence occursif the blend morphology is not stabilized. Interfacial forcessuch as the interfacial tension become important and canchange the rheological signature of the blend significantly.Moreover, the elastic properties of non-compatible blendsdepend on energy storage mechanisms at the interphase.Therelaxation of the dispersed phase itself is often much longerthan the relaxation of the polymer chains of the individualcomponents. Figure 8 shows the dynamic spectrum of aPMMA/PS blend with different volume fractions of the minorphase2. The additional low frequency contributions in G’ aredue to the form relaxations of the large dispersed domainsof the minor phase. If the average droplet size is known (fromTEM for example), the interfacial tension can be calculatedfrom the average relaxation time of the droplet relaxation.Figure 9: PPO/HIPS blend modified with MBS. The additional transitionat -45 C independent of concentration proves poor compatibility3Blending also provides a means to modify the elasticmodulus. Pressure sensitive adhesives PSA have the bestadhesion properties when the modulus is between 5x10⁵and 105 Pa at use temperature. By varying the content oftackifying resins in a natural or synthetic rubber matrix, themodulus can be adjusted as required (Figure 10).Figure 8: The increase contributions of G’ at low frequency can beused to calculate the interfacial tension of non-compatible blends2Incompatible blends show distinct glass transitions for eachcomponent. However, the value may change in relation tothe pure components. Homogeneous blends exhibit only oneglass transition. Thus the evaluation of the glass transitionsprovides information about compatibility and interphaseeffects. Figure 9 shows the tan δ trace of an PPO/HIPS 50:50blend, modified with MBS a (methyl-metacrylatebutadienestyrene) copolymer3. The modifier shows as an additionaltransition at -45 C, independent of the concentration. Thepoor compatibility is a result of the specific structure of theMBS, which consists of a PMMA shell imbedding a core of SBrubber.Figure 10: Comparison of PSA adhesive based on natural rubber andSIS copolymers. The SIS-based adhesive exhibits a wider applicationwindow (constant G’ 105 Pa)Process flows induce orientation of the dispersed phase in noncompatible blends.As a result of this fact, the morphology canbe modified to change the final product specific properties;a good example is the improved gas barrier in blow moldedbeverage bottles. Since non-compatible blends undergocoalescence in the melt state, compatibalizers such ascopolymers are added to stabilize the morphology. Anothertechnique to stabilize the morphology is reactive blending,which involves in situ chemical reactions at the interphase.APPLICATION EXAMPLESProcessingMolecular structure and ability to processRheological measurements are extensively used to study4 AAN013
polymer melts. The parameters obtained describe thefundamental behavior of materials such as ABS, PVC,polyolefin, etc. In processes such as bottle blow molding,injection molding, sheet forming, cable jacket extrusion,fiber spinning, etc., rheological measurements correlatemolecular structure, MW, MWD and LCB to such processingbehavior as flow rate, die swell, melt stability, recoverableshear and frozen-in stresses.Figure 11 shows melt viscosity and the first normal stressd
Polymer chain branches can vary in number, length and distribution along the main chain. Increasing the number, the size, or the flexibility of the branches changes the melt viscosity. But if the branches are few and long enough to entangle, melt viscosity will be higher at low frequency than that of a corresponding linear polymer of the same molecular weight (Figure 5). The viscosity of long .