Transcription
Data Breaches and Sensitive Data RiskSponsored by Informatica & Scale VenturePartnersIndependently conducted by Ponemon Institute LLCPublication Date: February 2016Data Breaches and Sensitive Data RisksPonemon Institute, February 2016Part 1. IntroductionPonemon Institute Research Report
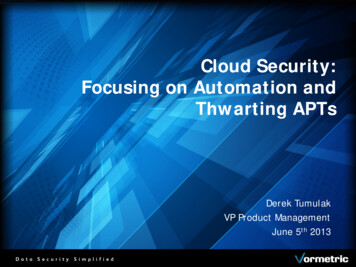
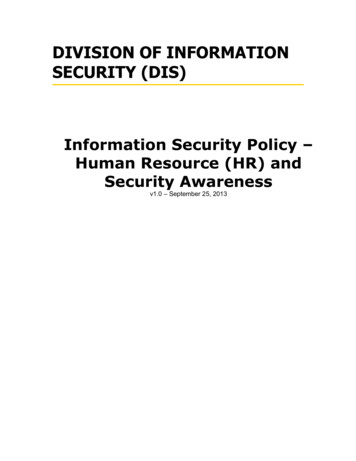
Ponemon Institute is pleased to present the results of Data Breaches and Sensitive Data Riskssponsored by Informatica and Scale Venture Partners. The purpose of this research is to learnhow organizations assess and minimize the risks to their sensitive and confidential information inorder to prevent a data breach.We surveyed 432 U.S. IT and IT security practitioners. To ensure a knowledgeable and qualityresponse, only IT practitioners whose job involves IT security and/or data protection activities intheir companies participated in this research. Their primary responsibilities include evaluatingprogram performance, managing IT security risks and managing IT budgets. Fifty-eight percent ofrespondents describe their companies’ security function as centralized across the enterprise, 25percent say it is decentralized by line of business and 17 percent say it is hybrid.According to participants in thisresearch, the two mostsignificant security problems are:not knowing the location ofsensitive data and not knowingthe data risk. As shown in Figure1, only 12 percent ofrespondents know the risk ofstructured data contained indatabases. According torespondents, the companiesrepresented in this researchhave an average of 4,275structured databases.Figure 1. Do you know the risk to all sensitive data in yourorganization?Similarly, very few know the riskto unstructured data contained inemails or files (8 percent of respondents), data located in the cloud (7 percent ofrespondents) and big data used for analytics (5 percent of respondents).The consequence of not knowing the risk makes a data breach the top security concern forcompanies represented in this research. However, they believe having the right technologies,including automated solutions that discover where sensitive data has proliferated, would increasetheir ability to mitigate the risk of a data breach.Other key takeaways from this research include the following:Sixty-two percent of respondents worry most about the inability to determine the locationof their organizations’ sensitive or confidential data. This is followed by not knowing theirorganizations’ data risk (60 percent of respondents). Other concerns include the migration to newmobile platforms (56 percent of respondents) and third-party or outsourcer management of data.A data breach is the top IT security risk and one that is increasing. Companies continue tostruggle with reducing the possibility of a data breach. When asked to select the one IT securityrisk that causes the most problems, it is the data breach of sensitive information, according to 35percent of respondents. This is followed by employee/user negligence (21 percent ofrespondents). Non-compliance and malware/advanced persistent threats are considered thesmallest IT security risk.Data breach risks are increasing. Sixty-five percent of respondents say the risk of a data breachof sensitive or confidential information is increasing and 63 percent say the risk of external attacksis increasing. Malware/advanced persistent threats (59 percent of respondents) are alsoincreasing.Ponemon Institute Research ReportPage 1
Many companies use homegrown automated solutions to discover sensitive data andassess its risk. More than half (51 percent) of respondents say their companies use anautomated solution to understand the data that needs to be protected. Sixty-four percent ofrespondents say the solution to discover sensitive data is developed in-house and 45 percent ofrespondents say they use a solution provided by a vendor.Respondents are uncertain what user activity is being tracked. While many companies areusing these automated solutions, 49 percent of respondents say they don’t know what is beingtracked. If they do know, 45 percent of respondents say they are tracking privileged user access,and 40 percent of respondents say they are tracking data risk escalation. However, the biggestgaps in what user activity is being tracked and what should be tracked are: privileged useraccess, cross border transfers, high volume access and new proliferation of data.Data classification is the technology most often used to stop data breaches. According to74 percent of respondents, their companies are using data classification tools to improve datasecurity. This tool is followed by: data monitoring (69 percent of respondents), encryption ortokenization (61 percent of respondents) and data discovery (55 percent of respondents).Certain risks could not be addressed by commercial solutions. According to respondents, itwas not possible to find commercial solutions to deal with the risks of employee and usernegligence and malicious insiders (68 percent and 66 percent of respondents, respectively). As aresult, they had to build a solution in-house. Similarly, 49 percent of respondents say they had tobuild a solution to prevent data breaches and another 49 percent of respondents say there wereno commercial solutions that addressed their malware/advanced persistent threats.Respondents predict the process and target-focused security controls that will be mostrelevant over the next three to five years. The most important process-focused controls will be:security intelligence analytics to identify risk and threats (52 percent of respondents), threat feedsand intelligence sharing (45 percent of respondents), advanced authentication and identificationschemes (40 percent of respondents) and user provisioning and identity management, especiallycloud and social media (37 percent of respondents).The most important target-focused security controls will be: cloud service brokers and cloudapplication gateways (40 percent of respondents), user awareness training (39 percent ofrespondents) information protection and control (DLP, tracking, masking, encryption) (35 percentof respondents) and database firewall/activity monitoring (30 percent of respondents).How do companies determine what changes to make to their security programs? With themultitude of security threats facing companies, how do they decide the areas of their IT securityprograms to refine or change? Sixty-seven percent of respondents look at threats andvulnerabilities that need to be attended to, and 63 percent say they decide based on budget orresource constraints. Fifty-three percent of respondents say their companies look at what parts ofthe program need to mature or evolve.What trends will influence IT security decision-making and programs? Over the next three tofive years, the three top industry trends that will most affect companies’ decisions related to theirsecurity programs are: consumerization of IT and/or shadow IT (45 percent of respondents),mobility such as smartphones and tablets (40 percent of respondents) and increased stealth andsophistication of the attacker (34 percent of respondents).Part 2. Key findingsIn this section, we provide an analysis of the key findings. The complete audited findings areshown in the appendix of this report. We have organized the report according to the followingtopics:Ponemon Institute Research ReportPage 2
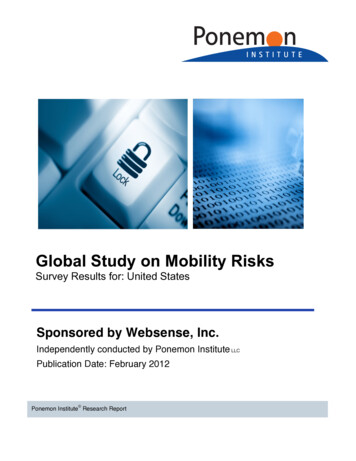
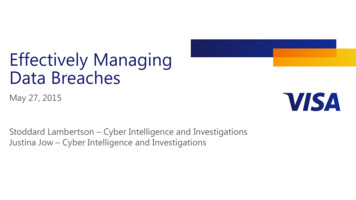
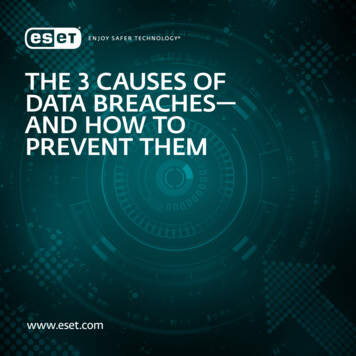
Data breaches are the top IT security riskTechnology solutions to address data security risksThe future of IT security programs and decision-makingData breaches are the top IT security riskWhat keeps IT practitioners up at night? As shown in Figure 2, the biggest worry is the inabilityto determine the location of their organizations’ sensitive or confidential data, according to 62percent of respondents. This is followed by not knowing their organization’s data risk (60 percentof respondents). Other concerns include the migration to new mobile platforms (56 percent ofrespondents) and third party or outsourcer management of data.Figure 2. What keeps you up at night?Four responses permittedNot knowing where the datais62%60%Not knowing the datarisk56%Migration to new mobileplatforms50%Third party or outsourcer management ofdata46%0%10%20%30%40%50%60%70%Temporary worker or contractor mistakesA data breach is the top IT security risk and one that is increasing. Companies continue tostruggle with reducing the possibility of a data breach. When asked to select the one IT securityrisk that causes the most problems, it is the data breach of sensitive information, according to 35percent of respondents and revealed in Figure 3. This is followed by employee/user negligence(21 percent of respondents). Non-compliance and malware/advanced persistent threats areconsidered the samllest IT security risk.Figure 3. What is your organization’s top IT security risk?Ponemon Institute Research ReportPage 3
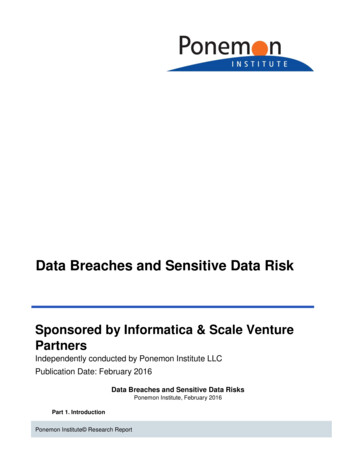
Data breach of sensitive information35%Employee/user negligence21%External attacks17%Malware/advanced persistent threats11%Malicious 0%Consistent with these findings, respondents are most confident in the controls used to achievecompliance with regulations and minimize malware/advanced persistent threats. While employeeand user negligence is a top IT security risk, respondents are fairly confident in the controls inplace to prevent a security incident, as presented in Figure 4.Figure 4. How confident are you in the current controls used to manage security risks?Very confident and confident responses combinedNon-compliance59%Malware/advanced persistent threats51%Employee/user negligence48%Malicious insiders44%External attacks40%Data breach of sensitive information33%0%10%20%30%40%50%60%70%Data breach risks are increasing. According to Figure 5, 65 percent of respondents say the riskof a data breach of sensitive or confidential information is increasing and 63 percent say the riskof external attacks is increasing. Also increasing is malware/advanced persistent threats (59percent of respondents). However, as discussed above, there is confidence in the ability ofexisting controls to deal with these threats.Figure 5. Which IT security risks are increasing?Increasing responses presentedPonemon Institute Research ReportPage 4
Data breach of sensitive information65%External attacks63%Malware/advanced persistent threats59%Employee/user negligence50%Malicious %Securing sensitive and confidential data is not the priority it should be. As presented inFigure 6, 56 percent of respondents are unsure (23 percent) or disagree (33 percent) that theirorganizations’ believe in the importance of protecting data.Figure 6. In my organization, securing and protecting data is a high priority30%25%25%20%23%19%19%14%15%10%5%0%Strongly agreeAgreeUnsureDisagreeStrongly disagreeThis lack of interest on the part of management could be related to not receiving information fromthe IT security function about the importance of safeguarding sensitive and confidentialinformation. In fact, only 34 percent of respondents say their organizations have defined metricsto communicate the business impact of their security program to colleagues and management.On average, 35 percent of an organization’s data is considered sensitive or confidential. Asshown in Figure 7, 54 percent of respondents say their organizations have no set schedule toassess the risk to its sensitive data.Figure 7. How frequently does your organization assess the risk of its sensitive data?Ponemon Institute Research ReportPage 5
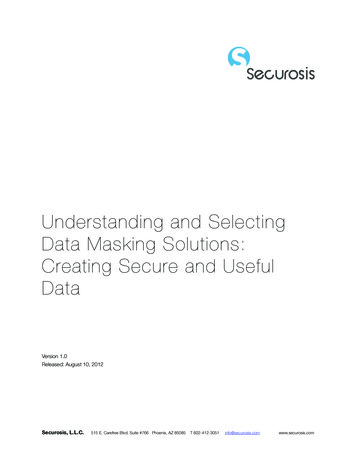
lly0%MonthlyAnnuallyNo set scheduleTechnology solutions to address data security risksMany companies use homegrown automated solutions to discover sensitive data andassess its risk. More than half (51 percent) of respondents say their companies use anautomated solution to understand the data that needs to be protected. As shown in Figure 8, 64percent of respondents say the solution to discover sensitive data is developed in-house and 45percent of respondents say they use a solution provided by a vendor.Figure 8. What automated solutions does your organization use to discover sensitive dataand asses its risk?More than one response wn solutionVendor providedsolutionOpen source solutionOtherRespondents are uncertain what user activity is being tracked. While many companies areusing these automated solutions, 49 percent of respondents, as shown in Figure 9, say they don’tknow what is being tracked. If they do know, 45 percent of respondents say they are trackingprivileged user access, and 40 percent of respondents say they are tracking data risk escalation.Ponemon Institute Research ReportPage 6
However, the biggest gaps in what user activity is being tracked and whatshould be tracked are: privileged user access, cross border transfers, highvolume access and new proliferation of data.Figure 9. What should be tracked and what is tracked today with an automated solution?More than one response permitted45%Privileged user access54%40%Sensitive data risk escalation27%33%Cross border transfers41%33%Cross border access11%24%High volume access39%16%New proliferation of data28%49%Cannot determine *0%10%What is being tracked today20%30%40%50%60%User activity that should be trackedNot a response for user activity that should be trackedData classification is the technology most often used to stop data breaches. According to74 percent of respondents, their companies use data classification tools to improve data security.This tool is followed by: data monitoring (69 percent of respondents), encryption or tokenization(61 percent of respondents) and data discovery (55 percent of respondents), as shown in Figure10.Figure 10. Technologies or “tools” organizations have in place today to address datasecurityMore than one response permittedData classification74%Data monitoring69%Encryption/tokenization61%Data discovery55%Data loss prevention50%Data risk analysis49%Data masking39%User access activity monitoring of sensitive/highrisk dataOtherPonemon Institute Research Report25%3%Page 7
0%10% 20% 30% 40% 50%60% 70% 80%Certain risks could not be addressed by commercial solutions. According to respondents, asshown in Figure 11, it was not possible to find commercial solutions to deal with the risks ofemployee and user negligence and malicious insiders (68 percent and 66 percent of respondents,respectively). As a result, they had to build a solution in-house. Similarly, 49 percent ofrespondents say they had to build a solution to prevent data breaches, and another 49 percent ofrespondents say there were no commercial solutions that addressed their malware/advancedpersistent threats.Figure 11. For which risks did you need to build a solution in-house because there were noviable commercial alternatives?More than one response permittedEmployee/user negligence68%Malicious insiders66%Malware/advanced persistent threats49%Data breach of sensitive information49%Non-compliance30%External attacks27%0%Ponemon Institute Research Report10%20%30%40%50%60%70%80%Page 8
Respondents predict the process and target-focused security controls that will be mostrelevant over the next three to five years. According to Figure 12, The most importantprocess-focused controls will be: security intelligence analytics to identify risk and threats (52percent of respondents), threat feeds and intelligence sharing (45 percent of respondents),advanced authentication and identification schemes (40 percent of respondents) and userprovisioning and identity management, especially cloud and social media (37 percent ofrespondents).The most important target-focused security controls will be: cloud service brokers and cloudapplication gateways (40 percent of respondents), user awareness training (39 percent ofrespondents), information protection and control (DLP, tracking, masking, encryption) (35 percentof respondents), and database firewall/activity monitoring (30 percent of respondents).Figure 12. Which process and target-focused security controls will be the most relevant?More than one response permittedTarget-focused security controlsCloudcloud application40%39%trainingProcess-focused security controlsSecurity intelligenceanalytics to identify risk 52%and threats35%Threat feeds,intelligence sharing30%45%0%Advanced authentication& Identification schemes40%15%30%45%service brokers /gatewaysUser provisioning andidentity managementespecially cloud andsocial media37%0%User awareness,15% 30% 45% 60%Information protection andcontrolDatabase firewall / activitymonitoringThe future of IT security programs and decision-makingPonemon Institute Research ReportPage 9
How do companies determine what changes to make to their security programs? With themultitude of security threats facing companies, how do they decide the areas of their IT securityprograms to refine or change? As shown in Figure 13, 67 percent of respondents look at threatsand vulnerabilities that need to be attended to, and 63 percent say they decide based on budgetor resource constraints. Fifty-three percent of respondents say their companies look at what partsof the program need to mature or evolve.Figure 13. How does your security operations team determine what areas of the IT securityprogram need to be refined or changed?More than one response permittedWe look at threats and vulnerabilities that needto be attended to67%We decide based on budget or resourceconstraints63%We look at what parts of program need to mature(evolve)53%We use a risk-based approach49%We look at changes to the company’s businessstrategy47%Other4%0%10% 20% 30% 40% 50% 60% 70% 80%What trends will influence IT security decision-making and programs? Over the next threeto five years, the three top industry trends that will most affect companies’ decisions related totheir security programs are: consumerization of IT and/or shadow IT (45 percent of respondents),mobility such as smartphones and tablets (40 percent of respondents) and increased stealth andsophistication of the attacker (34 percent of respondents), as shown in Figure 14.Figure 14. Trends that will have the biggest impact on the IT security program’sdecisionmaking processMore than one response permittedConsumerization of IT and/or shadowIT45%40%Mobility – smartphones andtablets34%Increased stealth and sophistication ofthe attacker Bring your own26%device (BYOD)23%Ubiquitous, high-speed InternetaccessPonemon Institute Research ReportPage 10
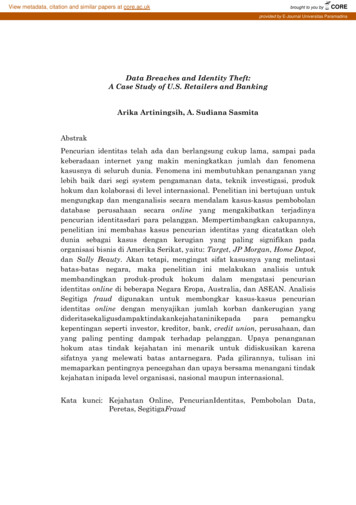
0% 5% 10% 15% 20% 25% 30% 35% 40% 45% 50%Part 3. MethodsA sampling frame of 13,095 experienced IT and IT security practitioners located in the UnitedStates were selected as participants to this survey. To ensure knowledgeable responses, only ITpractitioners whose job involves IT security and/or data protection activities in their companieswere selected as participants in this research. Table 1 shows 537 total returns. Screening andreliability checks required the removal of 105 surveys. Our final sample consisted of 432 surveys(3.3 percent response rate).Table 1. Sample responseFreqTotal sampling frame13,095100%Total returns5374.1%Rejected or screened surveys1050.8%Final sample4323.3%Pct%Pie Chart 1 reports the industry segments of respondents’ organizations. This chart identifiesfinancial services (19 percent) as the largest segment, followed by health & pharmaceutical (11percent), and public sector (11 percent).Pie Chart 1. Industry classification of respondents’ organizations2% 4%3%3%4%19%5%5%11%6%7%11%10%10%Financial servicesHealth & pharmaceuticalPublic sectorRetailServicesTechnology & softwareIndustrialConsumer productsEnergy & tertainment & mediaOtherIn addition to the United States, 72 percent of respondents reported having employees located inEurope, 67 percent responded Canada and 63 percent reported having employees in AsiaPacific,as shown in Table 2.Table 2. Location of employeesPct%United States100%EuropeCanadaPonemon Institute Research Report72%67%Page 11
Asia-PacificLatin America (including Mexico)Middle East & Africa63%61%54%Part 4. CaveatsThere are inherent limitations to survey research that need to be carefully considered beforedrawing inferences from the findings. The following items are specific limitations that are germaneto most web-based surveys.Non-response bias: The current findings are based on a sample of survey returns. We sentsurveys to a representative sample of individuals, thus resulting in a large number of usablereturned responses. Despite non-response tests, it is always possible that individuals who did notparticipate are substantially different in terms of underlying beliefs from those who completed theinstrument.Sampling-frame bias: The accuracy is based on contact information and the degree to which thelist is representative of individuals who are IT or IT security practitioners. We also acknowledgethat the results may be biased by external events such as media coverage. We also acknowledgebias caused by compensating subjects to complete this research within a holdout period.Self-reported results: The quality of survey research is based on the integrity of confidentialresponses received from subjects. While certain checks and balances can be incorporated intothe survey process, there is always the possibility that a subject did not provide a truthfulresponse.Ponemon Institute Research ReportPage 12
Appendix: Detailed Survey ResultsThe following tables provide the frequency or percentage frequency of responses to all surveyquestions contained in this study. All survey responses were captured in November 2015.Survey responseTotal sampling frameTotal returnsRejected or screened surveysFinal sampleResponse ratePart 1. ScreeningS1. Which of the following best describes your role in managing the IT and/orIT security function within your organization? Please select all that apply.Setting IT prioritiesFreq.13,0955371054323.3%Pct%53%Managing IT budgets55%Selecting vendors and contractors47%Determining IT strategy32%Evaluating program performance61%Mitigating IT security risks59%None of the above (stop)0%TotalS2. What best describes your level of involvement in leading IT securityand/or data protection activities within your organization?Very significantSignificantModerateNominal (stop)None (stop)Total307%Pct%33%41%26%0%0%100%S3. What best defines your position level within the organization?C-level executiveVice presidentDirectorManagerSupervisorStaff / associate (stop)Technician (stop)Contractor (stop)TotalPct%S4. What best describes your organization’s global headcount (size)?Pct%Ponemon Institute Research Report4%4%25%38%29%0%0%0%100%Page 13
Less than 1,0001,001 to 5,0005,001 to 10,00010,001 to 25,00025,001 to 75,000More than 75,000TotalPart 2. State of IT security riskQ1. What function does your company’s IT security department report to?CIO / CTOCSO / CISOComplianceFinance & accountingHuman resourcesInternal auditLegalRisk managementLines of business (data owner)Other (please specify)TotalQ2. How is your company’s security function organized?Centralized across the enterpriseDecentralized by line of businessHybridTotalQ3. At a high-level, how does you security operations team determine whichareas of your company’s IT security program to refine or change? Pleaseselect all that apply.We look at what parts of program need to mature (evolve)We look at changes to the company’s business strategyWe look at threats and vulnerabilities that need to be attended toWe decide based on budget or resource constraintsWe use a risk-based approachOther (please specify)TotalQ4. What is your organization's top IT security risk? Please select one topchoice.Data breach of sensitive informationEmployee/user negligenceExternal attacksMalicious insidersMalware/advanced persistent threatsNon-complianceOther (please specify)TotalPonemon Institute Research Pct%35%21%17%11%11%5%0%100%Page 14
Q5. For each IT security risk, please rate your level of confidence that thecurrent controls in place are effectively managing the risk? Please use thefollowing scale: 1 no confidence, 2 not confident, 3 somewhatconfident, 4 confident, and 5 very confident. Very confident andConfident (4 or 5) responses combined.Data breach of sensitive informationEmployee/user negligenceExternal attacksMalicious insidersMalware/advanced persistent threatsNon-complianceOther (please specify)TotalQ6. For each IT security risk, please provide your opinion whether IT securityrisk is increasing, decreasing or staying the same over the next 12 months.Please use the following scale: 1 increasing, 2 decreasing and 3 stayingthe same. Percent who selected 1 increasing.Data breach of sensitive informationEmployee/user negligenceExternal attacksMalicious insidersMalware/advanced persistent threatsNon-complianceOther (please specify)TotalQ7. For which risks (if any) did you need to build something in-housebecause there were no viable commercial alternatives? Please select all thatapply.Data breach of sensitive informationEmployee/user negligenceExternal attacksMalicious insidersMalware/advanced persistent threatsNon-complianceOther (please specify)TotalQ8. Do you have defined metrics to communicate the business impact of yoursecurity program to your peers and/or management?YesNoUnsureTotalQ9. Over the next 3-5 years, what industry trends (or forcing functions) willmost affect your organization’s IT security program’s decision-makingprocess? Please select your top 3 choices.Consumerization of IT and/or shadow ITPonemon Institute Research 5%100%Pct%45%Page 15
Mobility – smartphones and tabletsIncreased stealth and sophistication of the attackerBring your own device (BYOD)Ubiquitous, high-speed Internet accessIT Automation / API-level integrationsWeaponization of the InternetIncreased regulations and compliance requirementsNation-state attacksSoftware as a service (SaaS)Internet Of ThingsWork/life integrationAgile deployment methodologiesVirtualizationInfrastructure as a service (IaaS)TotalQ10. Over the next 3-5 years, which of the process-focused security controlswill be the most relevant to your organization? Please select your top 3choices.Security intelligence analytics to identify risk and threats (reactive andpredictive)Threat feeds, intelligence sharingAdvanced authentication & Identification schemesUser provisioning and identity management especially cloud and socialmedia)Incident response automation, orchestrationForensics and incident investigationVulnerability management, assessment and testingEnterprise risk management (including threat and risk modeling)Converged physical/logical securityGovernance, risk and compliance managementMetrics, dash-boarding, reportingDevOps security controlsTotalQ11. Over the next 3-5 years which of the target-focused security controlsare the most relevant to your organization? Please select your top 3 choices.Cloud service brokers / cloud application gatewaysUser awareness, trainingInformation protection and control (DLP, tracking, masking, encryption)Database firewall / activity monitoringIntrusion detection and preventionSoftware-defined networking & security automationEnterprise endpoint management (proactive, reactive)Sandboxing / process isolation / lightweight containersEncryption / key managementWeb application firewallCompliance monitoring /reportingAnti-spam / anti-phishing / brand reputationPonemon Institute Research %35%30%29%22%19%16%15%13%10%10%Page 16
FirewallSocial media / social networks content filteringNetwork admission controlTotalPart 3. State of data protection riskQ12. Do you know the risk to your organization’s sensitive or confidentialinformation?Q12a. Structured data contained in databasesYes, all dataYes, most dataYes, some dataNoTotal9%8%5%300%Pct%12%21%40%27%100%Q12b. Unstructured data contained in emails or filesYes, all dataYes, most dataYes, some dataNoTotalPct%Q12c. Big data used for analyticsYes, all dataYes, most dataYes, some dataNoTotalPct%Q12d. Data located in the cloud environmentYes, all dataYes, most dataYes, some dataNoTotalPct%Q13. In my organization, securing and/or protecting data is a high priority.Strongly agreeAgreeUnsureDisagreeStrongly disagreeTotalPct%Q14. What percentage of your organization’s data is considered sensitive orconfidential?Less than 5%5 to 10%11 to 25%Ponemon Institute Research %19%25%23%19%14%100%Pct%0%10%34%Page 17
26 to 50%51 to 75%76 to 100%TotalExtrapolated valueQ15a. Does your organization currently use any automated solution todiscover sensitive data and assess its risk?YesNoUnsureTotalQ15b. If yes, what automated solutions does your organization use todiscover sensitive data and assess its risk? Please select all that apply.Homegrown solutionVendor provided solution (please specify)Open source solutionOther (please specify)TotalQ16. How frequently does your organization access the risk of its yNo set scheduleTotalQ17a. What are the most important factors of user activity that should betracked for high-risk sensitive data? Please select your top two choices.Privileged user accessCross border transfersHigh volume accessNew proliferation of dataSensitive data risk escalationCross border accessTotalQ17b. What is being tracked today with an automated solution? Please selectall that apply.Cross border transfersCross border accessHigh volume accessPrivileged user accessNew proliferation of dataS
Ponemon Institute is pleased to present the results of Data Breaches and Sensitive Data Risks sponsored by Informatica and Scale Venture Partners. The purpose of this research is to learn . masking, encryption) (35 percent of respondents) and database firewall/activity monitoring (30 percent of respondents). How do companies determine what .