Transcription
Perceptual Mapping by MultidimensionalScaling: A Step by Step PrimerByBrian F. Blake, Ph.D.Stephanie Schulze, M.A.Jillian M. Hughes, M.A. CandidateMethodology SeriesSeptember 2003Cleveland State UniversityBrian F. Blake, Ph.D.Senior EditorJillian M. HughesCo-EditorEntire Series available: http://academic.csuohio.edu:8080/cbrsch/home.html
RESEARCH REPORTS IN CONSUMER BEHAVIORThese analyses address issues of concern to marketing and advertising professionals and toacademic researchers investigating consumer behavior. The reports present original researchand cutting edge analyses conducted by faculty and graduate students in the ConsumerIndustrial Research Program at Cleveland State University.Subscribers to the series include those in advertising agencies, market research organizations,product manufacturing firms, health care institutions, financial institutions and otherprofessional settings, as well as in university marketing and consumer psychology programs.To ensure quality and focus of the reports, only a handful of studies will be published eachyear.“Professional” Series - Brief, bottom line oriented reports for those in marketing andadvertising positions. Included are both B2B and B2C issues.“How To” Series - For marketers who deal with research vendors, as well as forprofessionals in research positions. Data collection and analysis procedures.“Behavioral Science” Series - Testing concepts of consumer behavior. Academicallyoriented.
AVAILABLE PUBLICATIONS:Professional Series Lyttle, B. & Weizenecker, M. Focus groups: A basic introduction, February, 2005.Arab, F., Blake, B.F., & Neuendorf, K.A. Attracting Internet shoppers in the Iranianmarket, February, 2003.Liu, C., Blake, B.F., & Neuendorf , K.A. Internet shopping in Taiwan and U.S.,February, 2003.Jurik, R., Blake, B.F., & Neuendorf, K.A. Attracting Internet shoppers in theAustrian market, January, 2003.Blake, B.F., & Smith, L. Marketers, Get More Actionable Results for Your ResearchDollar!, October, 2002.How To Series Blake, B.F., Valdiserri, J., Neuendorf, K.A., & Nemeth, J. Validity of the SDS-17measure of social desirability in the American context, November, 2005.Blake, B.F., Dostal, J., & Neuendorf, K.A. Identifying constellations of websitefeatures: Documentation of a proposed methodology, February, 2005.Saaka, A., Sidon , C., & Blake, B.F. Laddering: A “How to do it” manual – with anote of caution, February, 2004.Blake, B.F., Schulze, S., & Hughes, J.M. Perceptual mapping by multidimensionalscaling: A step by step primer, July, 2003.Behavioral Science Series Shamatta, C., Blake, B.F., Neuendorf, K.A, Dostal, J., & Guo, F. Comparing websiteattribute preferences across nationalities: The case of China, Poland, and the USA,October, 2005.Blake, B.F., Dostal, J., & Neuendorf, K.A. Website feature preference constellations:Conceptualization and measurement, February, 2005.Blake, B.F., Dostal, J., Neuendorf, K.A., Salamon, C., & Cambria, N.A. Attributepreference nets: An approach to specifying desired characteristics of an innovation,February, 2005.Blake, B.F., Neuendorf, K.A., Valdiserri, C.M., & Valdiserri, J. The OnlineShopping Profile in the cross-national context: The roles of innovativeness andperceived newness, February, 2005.Blake, B.F., & Neuendorf , K.A. Cross-national differences in website appeal: Aframework for assessment, July, 2003.Blake, B.F., Neuendorf , K.A., & Valdiserri , C.M. Appealing to those most likely toshop new websites, June, 2003.Blake, B.F., Neuendorf , K.A., & Valdiserri , C.M. Innovativeness and variety ofinformation shopping, April, 2003.
RESEARCH REPORTS IN CONSUMER BEHAVIOREDITORIAL DIRECTOR: DR. BRIAN BLAKEDr. Brian Blake has a wide variety of academic and professional experiences.His early career. academically, rising from Assistant Professor to tenured Professor at PurdueUniversity, his extensive published research spanned the realms of psychology (especiallyconsumer, social, and cross-cultural), marketing, regional science, sociology, communitydevelopment, applied economics, and even forestry. Professionally, he was a consultant to theU.S. State Department and to the USDA, as well as to private firms.Later on.on the professional front, he co-founded a marketing research firm, Tactical DecisionsGroup, and turned it into a million dollar organization. After merging it with another firm toform Triad Research Group, it was one of the largest market research organizations based inOhio. His clients ranged from large national firms (e.g., Merck and Co., Dupont, Land o’ Lakes)to locally based organizations (e.g., MetroHealth System, American Greetings, ProgressiveInsurance, Liggett Stashower Advertising). On the academic side, he moved to Cleveland StateUniversity and co-founded the Consumer-Industrial Research Program (CIRP). Some ofCleveland’s best and brightest young marketing research professionals are CIRP graduates.In the last few years.academically, he is actively focusing upon establishing CIRP as a centerfor cutting edge consumer research. Professionally, he resigned his position as Chairman ofTriad and is now Senior Consultant to Action Based Research and consultants with a variety ofclients.EDITOR (2003): JILLIAN HUGHESCurrently a CIRP graduate student, she graduated Magna Cum Laude from Mount UnionCollege, where she majored in Psychology, with a focus on Consumer Behavior, and minored inSociology. Among her many research interests; she focuses on Internet buying behavior, and theeffects of Social Desirability Bias on Innovativeness Scales. She had the honor of presentingresearch concerning age differences in brand labeling at the Ohio Undergraduate PsychologyConference in April of 2001 at Kenyon College. She also presented another piece of originalresearch on Internet buying behavior of college students at the Interdisciplinary Conference forthe Behavioral Sciences hosted by Mount Union College in April, 2001.
ForwardPerceptual Maps are widely used by market researchers, e.g., to portray a brand’simage or consumer’s reactions to product features. Although the major statisticaltechniques have been available for several decades, these are still many questions aboutthose techniques among practicing professionals.This report is intended for “on the job” professionals who are fairly unfamiliarwith the concrete procedures used to generate and to interpret such mapsIn overview, three types of maps are especially popular among professionalresearchers: “perceptual” maps that identify the images of brands, products, services, etc. “preference” maps that estimate differences among segments or individuals inthe appeal or attractiveness of brands, products, services, features. “hybrid” maps which portray both images and appeal.A variety of statistical techniques can be used to generate each type of map.Perceptual maps are usually constructed via multidimensional scaling - multiplediscriminant function – correspondence analysis. Preference maps are typicallydeveloped by a form of multidimensional “unfolding.” Hybrid maps are composedby first devising a perceptual map and then introjecting preferences as “ideal points”or as “vectors.”This paper focuses upon one mapping technique, multidimensional scaling(MDS), and executes it via a program package that is widely used by marketresearchers, SPSS.
AbstractThe overall objective of this report was to document the applications of twowidely applied forms of “perceptual mapping”, Classical and Weighted MultidimensionalScaling. A step-by-step guide is provided for the use of these mapping techniques. It isanticipated that this report will be valuable to the professional market researcher who isnew to perceptual mapping and to others looking for a detailed reference source forperforming the basics of these techniques.The illustrative data pertain to the images of particular hospitals in the NortheastOhio area. The data were gathered from a convenience sample of family, friends, andacquaintances of the researchers. A total of 107 took part in the study.The techniques were Classic Multidimensional Scaling (CMDS) and WeightedMultidimensional Scaling (WMDS). The statistical software program SPSS was used,but the ideas can be generalized to other statistical packages and programs.I.Overview of the Three Mapping ProceduresBefore describing each technique in detail, let us present them in overview.1) Classic Multidimensional Scaling (CMDS)To begin, the data for CMDS and WMDS are indicators of the degree ofsimilarity among objects, brand names, etc. Here, the data are ratings of the degree ofperceived similarity among the twelve “stimuli”- four hospitals identified by name, fourunnamed hospitals described by taglines, and four unnamed hospitals described byadvertisements.
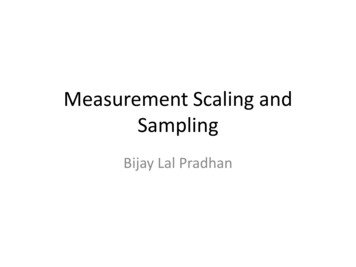
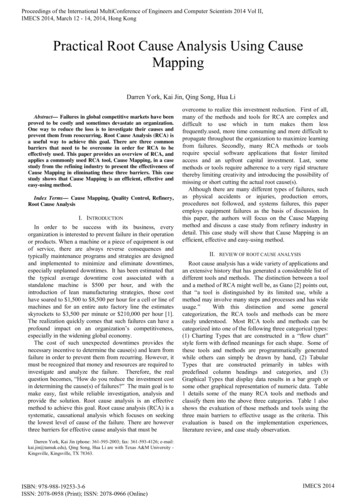
The four named hospitals in our illustration were Fairview Hospital, ParmaCommunity Hospital, Southwest General Hospital, and MetroHealth System. The fourtaglines were 1) “In the hands of doctors” 2) “It’s a people thing” 3) “When it’s yourhealth, experience counts” and 4) “Your partner in good health”. For this report, let usabbreviate them as 1) “doctor’s hands” 2) “people thing” 3) “experience counts” and 4)“partner”. The four advertisements were labeled 1) “magic bullet” 2) “heart surgery” 3)“diet and exercise” and 4) “heart center”. The advertisements are shown on pages 3-6.Respondents rated the similarity of pairs of these items on a 0-10 point scale, highernumbers meaning more similarity. For the CMDS example on the next page, we considerjust the four named hospitals and the four hospitals described by advertisements.CMDS analyzed ratings to produce the positioning map on page 7. The goal ofmapping is to portray the respondent’s perceptions of similarity among the items along agiven number of dimensions or yardsticks. The closer together on the map are the items,themore similar they are perceived to be. In the figure on the next page, the followingabbreviations are used for the named hospitals: fairview (Fairview Hospital), parmacom(Parma Community Hospital), swgener (Southwest General Hospital), and metro(MetroHealth System). The following abbreviations were used for the hospitalsdescribed by advertisements: magbull (“magic bullet”), hrtsurg (“heart surgery”),dietexe (“diet and exercise”), and hrtcent (“heart center”).
Classic Multidimensional Scaling CMDSHospitals by .5Dimension .5-1.0-.50.0.51.01.5Dimension 1Here, the hospital described in the advertisement “Heart Center” is perceived to besimilar to Parma Community Hospital. However, the advertisement “Heart Center” isseen as quite distinct from MetroHealth System. Thus, respondents as a group perceivedthat the advertisement “Heart Center” fits Parma Community Hospital better thanMetroHealth System.Among other uses, this kind of mapping can identify how well an advertisementor tagline can fit a hospital, or even be incompatible with a particular brand name.2) Weighted Multidimensional Scaling (WMDS)In Weighted Multidimensional Scaling (WMDS), we are again considering theperceived similarity among stimuli, but here we identify differences in perception amongspecific segments of individuals. WMDS calculates the differences among the groups ofrespondents on a given number of dimensions. Each dimension is essentially the same
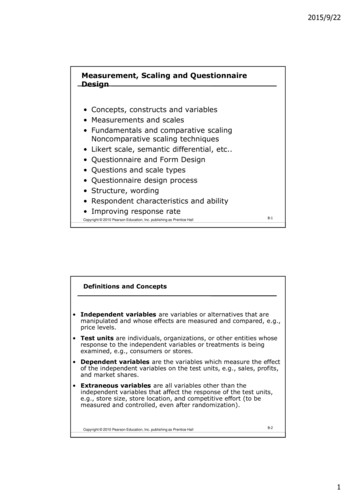
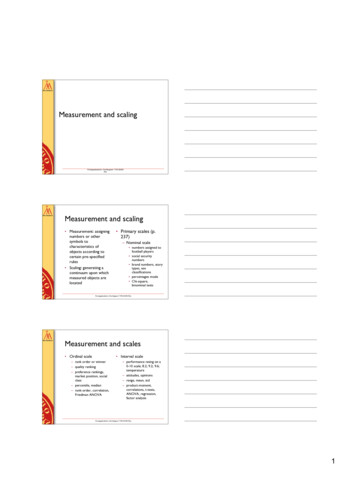
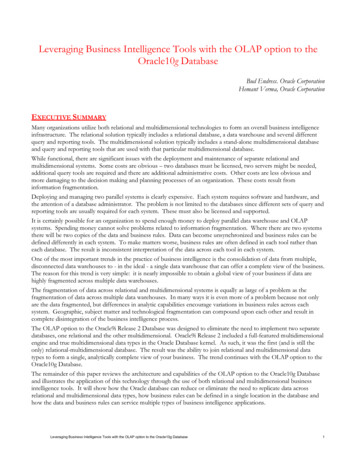
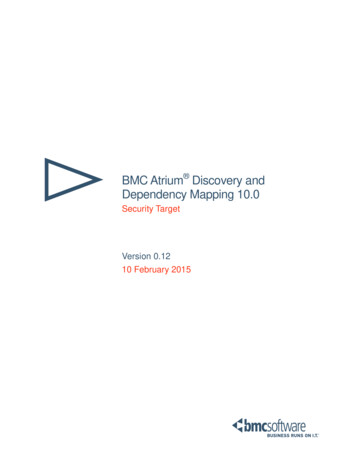
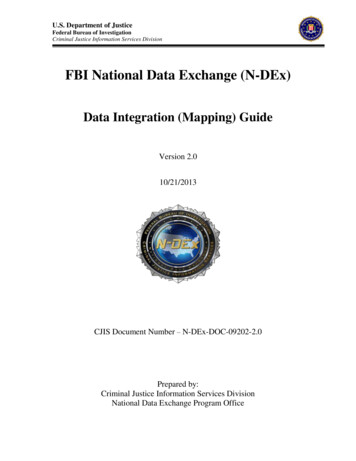
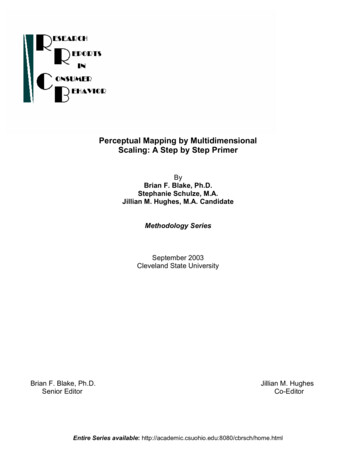
for all segments (e.g. world-wide reputation). In contrast, if we were to do a CMDSseparately for each segment, we could conceivably develop maps in which a dimension inone group would have to be interpreted as different from the dimension found in othergroups (e.g. personal attention, location close by).Respondents rated the same 12 objects (4 hospitals/ 4 advertisements/ 4 taglines)by similarity for selected pairs of these items. Also, WMDS shows the importance of adimension to a particular segment when that segment perceives the stimuli in question.One map is produced for each segment. The closer together the stimuli are on the map,the more similar is the weight assigned to an object on a particular dimension. WMDSanalyzed these ratings to produce the positioning map illustrated on the next page. Thedata were separated into male and female segments, and the maps can be seen on the nexttwo pages.
WMDS Hospitals by Ads (Males)Magic BulletHeart SurgeryDiet and ExerciseSW GeneralParma CommunityMetrohealthFairviewHeart Center
WMDS Hospitals by Ads (Females)SW GeneralFairviewMetrohealthMagic BulletDiet and ExerciseHeart SurgeryHeart CenterParma Community
In the male WMDS map, the hospital described in the advertisement “HeartCenter” is perceived to be similar to Parma Community Hospital in the eyes of males.However, the advertisement “Heart Center” is perceived to be much different fromSouthwest General Hospital. Therefore, male respondents as a group perceive that theadvertisement “Heart Center” fits Parma Community Hospital better than SouthwestGeneral Hospital.This kind of perceptual mapping can aid in determining how appropriate orinappropriate an advertisement or tagline can be for a hospital depending on the targetmarket segment of interest. Furthermore, this mapping technique can identify the mostappropriate advertisement or tagline for a particular brand name in general.The information used for more detailed explanation in subsequent sections of thispaper was drawn from: Young and Harris (19XX), Chapter 7 Multidimensional Scaling. Hair, Anderson, Tatham, and Black (1998), Multivariate Data Analysis,5th Ed., Chapter 10. Meyers (1996), Segmentation and Positioning for Strategic MarketingDecisions. Perceptual Positioning Maps, Chapter 8. Lecture notes from Professor Brian Blake’s Advanced Consumer Researchcourse PSY 620. George and Mallery (2001), SPSS for Windows Step by Step: A SimpleGuide and Reference 10.0 Update 3rd Ed., Multidimensional ScalingChapter 19.
II.CLASSIC MULTIDIMENSIONAL SCALING (CMDS)A.Goals/ Objectives of CMDSA researcher can use CMDS to reach two general goals or objectives. First,CMDS can estimate the relative importance of the dimensions that respondents use tojudge the degree of similarity or dissimilarity among the stimuli. Second, the degree ofsimilarity among all of the stimuli on those dimensions can be assessed. To empiricallyunderstand or to label the nature of a given dimension requires analyses above andbeyond CMDS itself.B.CMDS General RationaleClassic Multidimensional Scaling (CMDS) is a statistical technique created totransform data indicating the degree of rated similarity or dissimilarity of objects toscores indicating distances among the objects. Then, a “map” is constructed showing thedistances among the objects. Objects closer together on the map are perceived as moresimilar and objects further apart are perceived as more dissimilar. The same unit ofmeasurement is used for all of the distances among the objects. One matrix of data isused, displaying the perceptions of one person or the average person’s answers in thegroup of respondents in question.C.Alternatives/ OptionsCMDS can produce perceptual maps that portray disaggregated results (whichshow evaluations of a single individual) or aggregated results (which show the combinedassessments of many individuals). If a single respondent’s evaluations are desired, theresearcher should input the respondent’s judgments into a matrix where the units used for
comparison are listed across the columns and rows as shown in Table 1 on the next page.On the contrary, if cumulative respondent answers are desired, the average or meanevaluation can be computed in SPSS under the descriptives option. The researcher theninputs the resulting mean scores into a matrix.In this matrix, the hypothetical data below are the similarity ratings between thetwo items in each pair. The higher the number, the more similar respondents perceivedthe two items to be.
ABCDEFGHTABLE 1A06853546BCDEFGH0106867609103610047970524038020In the resulting positioning map, CMDS presents the distances between objects onthe dimensions along which the distances are calculated. The researcher must specifythe number of dimensions, which is usually two or three for ease of interpretation.CMDS doesn’t directly label these dimensions and the researcher must indirectlyestimate names for the dimensions based, for example, on the rank order of the objects ona given dimension.Specifically, each unit or object is illustrated by a plotted location inmultidimensional space on a positioning map. These plotted locations illustrate thesimilarities that are perceived by respondents. CMDS determines the distances among allcombinations of pairs of the objects and plots the objects accordingly. Briefly, theperceptual “space” is usually generated by a 2 or 3 dimensional “Euclidean model”. TheEuclidean geometrical representation is a multidimensional generalization of thePythagorean theorem we all learned in high school geometry class. The formula is: thesquared distance between the two points on Dimension X plus the squared distancebetween the two points on Dimension Y equals the squared straight line distance betweenthe two points. For example, we can figure the Euclidean straight-line distance on two
dimensions between A and C if we know their coordinates on the X and Y axes(dimensions). As shown below, if the plotted coordinates (locations) for A are 1 on Xand 3 on Y, and C’s coordinates are 4 on X and 2 on Y, then the distance between A & Ccan be calculated using the formula. The difference between A and C on Dimension 1for X is 4-1 3 and on Dimension 2 for Y is 3-2 1. Therefore, the Euclidean distanceEuclidean Distance3.532.5Y2AC1.510.50012345Xformula would be (1)2 (3)2 10 or 3.33. The Euclidean distance between A and C is3.33.D.Illustrative CaseTwelve presentation boards were presented to respondents representing twelvedifferent hospitals. The respondents were informed that the hospitals represented may ormay not be located in the Northeast Ohio area, and that they may or may not be familiarwith the hospitals portrayed. Four of the hospitals were described by taglines, four of thehospitals were described by advertisements, and four of the hospitals were described bytheir respective hospital names.
First, respondents were asked about their familiarity with a tagline. Therespondents were instructed to assume that the tagline was an accurate description of thehospital represented. An illustrative question stated, “Now, focus on tagline ‘In the handsof doctors’. What do you know about this tagline?” The respondent’s options were: “A)I have never seen it before, and know nothing about it, B) I have seen it before, but don’tknow much about it, C) I have seen it before, and know quite a bit about it, or D) I haveseen it before, and know that it’s a tagline for hospital.” This questioning wasrepeated for the other three taglines, which again were ‘It’s a people thing’, ‘When it’syour health, experience counts’, and ‘Your partner in good health’.Respondents rated a total of six pairs of the four taglines. Ratings were made on ascale of 0-10, where 0 indicated very different and 10 indicated very similar. Theinterviewer presented the taglines and a question example stated, “Rate how similar/dissimilar are the two hospitals described by the two taglines. Use a scale of 0 to 10, with0 meaning very different and 10 meaning very similar. The first two hospitals are theones described by ‘In the hands of doctors’ and the one described by ‘It’s a peoplething’.”Next, respondents were asked about their familiarity with an advertisement. Therespondents were instructed to assume that the advertisement was an accurate descriptionof a hospital. An illustrative question stated, “Now, focus on advertisement that waslabeled “magic bullet”. What do you know about this ad?” The respondent’s optionswere: “A) I have never seen it before, and know nothing about it, B) I have seen itbefore, but don’t know much about it, C) I have seen it before, and know quite a bit about
it, or D) I have seen it before, and know that it’s a advertisement for hospital.”This questioning was repeated for the other three advertisements.Then, respondents rated a total of six pairs of the four advertisements. Ratingswere made using the same scale of 0-10, where 0 indicated very different and 10indicated very similar. The interviewer then presented the advertisements and a questionexample stated, “Rate how similar/ dissimilar are the two hospitals described by the twoadvertisements. Use a scale of 0 to 10, with 0 meaning very different and 10 meaningvery similar. The first two hospitals are the ones described by the advertisements labeled“magic bullet” and “people thing”.Finally, hospital names were presented to respondents to assess what therespondents knew about the hospital names. An illustrative question stated, “What doyou know about Parma Community Hospital?” A respondent’s options were: “A) I knowpractically nothing about it, B) I have heard the name, but don’t know much about it, C) Ihave heard the name and know a little about it, or D) I have heard the name and knowquite a bit about it.”Next, respondents rated a total of six pairs of the four hospital names. Ratingswere made on the same scale of 0-10, again where 0 indicated very different and 10indicated very similar. The interviewer presented the hospital names and a questionexample stated, “Rate how similar/ dissimilar are the two hospitals named. Use a scale of0 to 10, with 0 meaning very different and 10 meaning very similar.” The respondentwas then presented with each of the six pairs of hospitals: Fairview & MetroHealthSystem, Fairview & Parma Community, etc.” This questioning was repeated for theother three hospital names.
Respondents were then asked to indicate the degree of similarity or dissimilarityof hospitals when taglines were paired with hospital names. The same 0-10 similarityscale was employed. There were 16 pairs of hospitals and taglines. An illustrativequestion stated, “Rate how similar/ dissimilar are the two hospitals using a scale of 0 to10, with 0 meaning very different and 10 meaning very similar.” The respondent wasthen presented with the pairs “doctor’s hands” and Fairview, etc.Respondents were then asked to indicate the degree of similarity or dissimilarityof advertisements paired with hospital names using the same 0-10 scale. There were 16pairs of hospitals and advertisements. An illustrative question stated, “Rate how similar/dissimilar are the two hospitals. Use a scale of 0 to 10 with 0 meaning very different and10 meaning very similar.” The respondents were then given the pairs “magic bullet” &Fairview, etc.E.Data NeededThe data analyzed in CMDS are displayed in a single matrix showing the degreeof rated dissimilarity between hospitals in a pair. The matrix consists of rows andcolumns listing each object paired with all other objects. The “measurement level”,“shape”, and “conditionality” of the data can vary among various CMDS analyses andmust be specified for any MDS to be conducted.A) Measurement level-- The data can be ordinal, interval, or ratio.1) Ordinal data arranges objects in a rank order from high to low on adimension.2) Interval data pertains to numbering in which one number is a fixedamount more or less than another number. For example, the amount of
the dimension (here, similarity) between the number 3 and 4 on a scaleis assumed to be the same as the amount between 4 and 5, and thatamount is the same as between 5 and 6 on the scale. In other words,an interval scale is one in which the intervals between consecutivenumbers are equal.3) Ratio data has a true zero point (absence of the factor) and allows oneto calculate ratios or proportions. One cannot do this with an intervalscale because there is no zero starting point for the numbers.However, a ratio scale has a true zero point, and so one can calculateratios, such as one item is twice as much as another.B) Shape-- The “shape” of the data for CMDS is square, where rows andcolumns in the matrix represent the same set of units or objects.C) Conditionality-- Data used in CMDS are typically “matrix conditional”indicating that in the analysis all numbers in the data matrix can be comparedto each other, no matter what the row or column involved. The data matrix isdevised by averaging (mean) similarity ratings for all respondents for a givenpair of stimuli. In the illustrative case, this yields an 8 X 8 matrix.By default, SPSS assesses higher numbers as more dissimilar, so it was necessaryto recode our values into higher numbers representing more dissimilarity and lowernumbers representing more similarity. Keep in mind that if the questionnaire uses highernumbers to indicate dissimilarity and lower numbers to indicate similarity, then it is notnecessary to recode the values.F.SPSS Specific Steps
After creating the desired matrix, the next step in conducting a CMDS analysis isunder the Analyze option at the top of the SPSS screen. After selecting Analyze, theresearcher should select the Scale option. Under the scale option, the analyst will findMultidimensional Scaling. Next, a box will appear illustrating the objects on the lefthand side. Each object should be highlighted and moved over to the empty area on theright-hand side. In the lower right-hand corner of the square, one will find the choicesmodel and options. Under the model selection, the researcher can specify the desiredlevel of measurement. Ratings or numerical scales, such as here, are typically treated asinterval. There are several measures of distance; the most popular one in consumerresearch is Euclidean. For conditionality, select matrix. Finally, the researcher shouldenter the desired number of dimensions. The number of dimensions that will beemployed in the final solution will depend upon the interpretability of the solution andupon the stress measure. However, it is recommended to begin with two dimensions andthen to increase the dimensions to three. You will be looking for the dimensionality thatis better in regard to interpretability and to stress, a measure of goodness of fit of themapping solution to the data. Dimensionalities higher than three are rarely employed inperceptual mapping. In professional applications, researchers strongly prefer the simplertwo dimensional solution.Finally, the options selection allows the researcher to specify group plots,individual subject plots, the data matrix, and the model and options summary. In theinitial analyses of the data, all of these choices should be selected and included in theSPSS output. The criteria box simply shows the options that are already set by default inthe SPSS program. The researcher does not need to manually select any of these options
and are listed here only for explanatory purposes. These options include the S-Stressconvergence, which represents the lowest possible level of improvement that thealgorithm will configure. The criteria box also specifies the minimum S-Stress value,which by default is .001 and the maximum number of iterations that the program willattempt in finding the best possible solution for the data. The default for the latter is 30.G.SPSS OutputAfter analyzing the ratings and specifying separate 2 and 3 dimensional solutionsfor both taglines by hospitals and advertisements by hospitals, a 3 dimensional solutionwas found to have the best fit. However, a 2 dimensional solution is shown forillustrative purposes because a two dimensional solution is used far more frequently inprofessional practice. It is important to note that the fit of the 2 dimensional solutionobtained in this data set would be too low to be considered useful in practice.The output generated in SPSS for a CMDS solution provides an abundance ofinformation. First, the SPSS output provides the unscaled means of the similarity ratingsof the objects among the aggregated respondents. The ratings are shown in SPSS Output1. Each unit or object used for the paired comparisons is shown on the left-hand side asrows numbered 1-8 and across the top of the matrix as columns numbered 1-8.Raw (unscaled) Data1234512345.000Magic BulletHeart SurgeryDiet & ExerciseHeart CenterFairview 0005.9204.230.0004.040
6 MetroHealth5.120.0005.4304.9707 Parma Comm.4.2305.430.0004.1408 SouthWest Gen.4.0404.9704.140.0004.0604.9604.18066 MetroHealth7 Parma Comm.8 SouthWest Gen.SPSS OUTPUT 1.0004.9604.7507.0004.5008.000CMDS (as well as the other variants of MDS) proceeds in a series of steps. TheSPSS output provides the iteration history of the solution. Iterations as the original inputdata are transformed step-by-step to produce the final solution (map). Next, stress testsand the RSQ value (i.e., r-squared correlation) are also shown in SPSS Output 2 on thenext page. Young’s S-Stress formula is a measure of statistical fit that ranges from 1indicating the worst possible fit to 0 indicating a perfect fit. It can be seen that there is animprovement (decrease) in Young’s S-Stress as the iterations proceed. The iterations willcontinue until there is no more improvement in S-Stress or until the specified number ofiterations is made. SPSS by default sets a maximum of 30 iterations. A value of .10 orless is considered a good fit for two dimensions; a lower stress (.07 or so) is consideredgood for a three dimensional solution. The RSQ value is the squared correlationcoefficient between the distances and the data, and it is the variance accounted for in thesolution. The RSQ and Kruskal’s stress index are used as the measures of goodness of fitof the solution. Here, the stress is too high and the RSQ is too low for comfort. Inpractice, we would want a better fit.
Iteration history for the 2 dimensional solution (insquared distances)Young's S-stress formula 1 i
professional settings, as well as in university marketing and consumer psychology programs. To ensure quality and focus of the reports, only a handful of studies will be published each year. “Professional” Series - Brief, bottom line oriented reports for those in marketing and adv